Estimated zip code population in 2022: 1,398 Zip code population in 2010: 1,615 Zip code population in 2000: 1,896
Houses and condos: 512 Renter-occupied apartments: 29
% of renters here:
7%
State:
27%
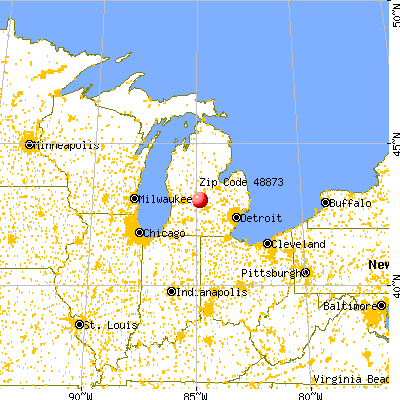
March 2022 cost of living index in zip code 48873: 79.9 (low, U.S. average is 100)
Land area: 33.5 sq. mi. Water area: 0.2 sq. mi.
Population density: 42 people per square mile
(very low).
OSM Map
General Map
Google Map
MSN Map
OSM Map
General Map
Google Map
MSN Map
OSM Map
General Map
Google Map
MSN Map
OSM Map
General Map
Google Map
MSN Map
Please wait while loading the map...
Real estate property taxes paid for housing units in 2022:
This zip code:
0.9% ($1,879)
Michigan:
1.2% ($2,746)
Median real estate property taxes paid for housing units with mortgages in 2022: $1,800 (0.9%) Median real estate property taxes paid for housing units with no mortgage in 2022: $1,972 (1.0%)
Business Search- 14 Million verified businesses
Males: 669
(47.8%)
Females: 729
(52.2%)
For population 25 years and over in 48873:
High school or higher: 95.3%
Bachelor's degree or higher: 25.0%
Graduate or professional degree: 5.8%
Unemployed: 1.5%
Mean travel time to work (commute): 27.6 minutes
For population 15 years and over in 48873:
Never married: 27.7%
Now married: 61.1%
Separated: 0.0%
Widowed: 4.5%
Divorced: 6.7%
Zip code 48873 compared to state average:
Unemployed percentage significantly below state average.
Black race population percentage significantly below state average.
Hispanic race population percentage significantly below state average.
Median age below state average.
Foreign-born population percentage significantly below state average.
Renting percentage significantly below state average.
Length of stay since moving in significantly above state average.
Percentage of population with a bachelor's degree or higher below state average.
Estimated median house/condo value in 2022: $206,100
48873:
$206,100
Michigan:
$224,400
According to our research of Michigan and other state lists, there were 5 registered sex offenders living in 48873 zip code as of May 28, 2024. The ratio of all residents to sex offenders in zip code 48873 is 309 to 1. The ratio of registered sex offenders to all residents in this zip code is near the state average.
Median resident age:
This zip code:
34.2 years
Michigan median age:
40.3 years
Average household size:
This zip code:
3.3 people
Michigan:
2.4 people
Averages for the 2020 tax year for zip code 48873, filed in 2021:
Average Adjusted Gross Income (AGI) in 2020: $65,569 (Individual Income Tax Returns)
Here:
$65,569
State:
$68,945
Salary/wage: $54,242 (reported on 79.2% of returns)
Here:
$54,242
State:
$57,142
(% of AGI for various income ranges: 1170.0% for AGIs below $25k, 3562.9% for AGIs $25k-50k, 5406.7% for AGIs $50k-75k, 8366.0% for AGIs $75k-100k, 15594.0% for AGIs $100k-200k)
Taxable interest for individuals: $880 (reported on 48.6% of returns)
This zip code:
$880
Michigan:
$1,630
(% of AGI for various income ranges: 32.7% for AGIs below $25k, 55.0% for AGIs $25k-50k, 47.8% for AGIs $50k-75k, 28.0% for AGIs $75k-100k, 138.0% for AGIs $100k-200k)
Ordinary dividends: $1,875 (reported on 22.2% of returns)
Here:
$1,875
State:
$6,972
(% of AGI for various income ranges: 90.7% for AGIs $25k-50k, 36.7% for AGIs $50k-75k, 140.0% for AGIs $100k-200k)
Net capital gain/loss in AGI: +$3,300 (reported on 19.4% of returns)
Here:
+$3,300
State:
+$20,064
(% of AGI for various income ranges: 70.7% for AGIs $25k-50k, 121.1% for AGIs $50k-75k, 254.0% for AGIs $100k-200k)
Profit/loss from business: +$9,375 (reported on 11.1% of returns)
Here:
+$9,375
State:
+$11,172
(% of AGI for various income ranges: 387.9% for AGIs $25k-50k, 207.0% for AGIs $100k-200k)
Taxable individual retirement arrangement distribution: $12,229 (reported on 9.7% of returns)
48873:
$12,229
Michigan:
$19,803
(% of AGI for various income ranges: 278.2% for AGIs below $25k, 611.1% for AGIs $50k-75k)
Total itemized deductions: $27,600 (reported on 2.8% of returns)
Here:
$27,600
State:
$34,117
(% of AGI for various income ranges: 394.3% for AGIs $25k-50k)
Taxes paid: $7,800 (reported on 2.8% of returns)
48873:
$7,800
State:
$7,972
(% of AGI for various income ranges: 111.4% for AGIs $25k-50k)
Earned income credit: $1,360 (reported on 6.9% of returns)
Here:
$1,360
State:
$2,251
(% of AGI for various income ranges: 48.6% for AGIs $25k-50k)
Percentage of individuals using paid preparers for their 2020 taxes: 91.7%
Here:
92%
State:
93%
(% for various income ranges: 88.9% for AGIs below $25k, 95.0% for AGIs $25k-50k, 91.7% for AGIs $50k-75k, 85.7% for AGIs $75k-100k, 93.3% for AGIs $100k-200k)
Averages for the 2012 tax year for zip code 48873, filed in 2013:
Average Adjusted Gross Income (AGI) in 2012: $53,341 (Individual Income Tax Returns)
Here:
$53,341
State:
$55,609
Salary/wage: $44,017 (reported on 82.9% of returns)
Here:
$44,017
State:
$46,782
(% of AGI for various income ranges: 66.0% for AGIs below $25k, 66.5% for AGIs $25k-50k, 70.5% for AGIs $50k-75k, 80.4% for AGIs $75k-100k, 64.1% for AGIs $100k-200k)
Taxable interest for individuals: $726 (reported on 44.3% of returns)
This zip code:
$726
Michigan:
$1,491
(% of AGI for various income ranges: 2.3% for AGIs below $25k, 0.7% for AGIs $25k-50k, 0.3% for AGIs $50k-75k, 0.4% for AGIs $75k-100k, 0.5% for AGIs $100k-200k)
Ordinary dividends: $1,607 (reported on 20.0% of returns)
Here:
$1,607
State:
$6,225
(% of AGI for various income ranges: 1.2% for AGIs below $25k, 0.8% for AGIs $25k-50k, 1.0% for AGIs $50k-75k, 0.5% for AGIs $100k-200k)
Net capital gain/loss in AGI: +$2,822 (reported on 12.9% of returns)
Here:
+$2,822
State:
+$9,326
(% of AGI for various income ranges: 0.3% for AGIs $25k-50k, 1.5% for AGIs $100k-200k)
Profit/loss from business: +$6,714 (reported on 10.0% of returns)
Here:
+$6,714
State:
+$11,523
(% of AGI for various income ranges: 5.0% for AGIs below $25k, 2.6% for AGIs $50k-75k, 0.9% for AGIs $100k-200k)
Taxable individual retirement arrangement distribution: $9,500 (reported on 8.6% of returns)
48873:
$9,500
Michigan:
$15,298
Total itemized deductions: $16,356 (17% of AGI, reported on 22.9% of returns)
Here:
$16,356
State:
$21,628
Here:
16.6% of AGI
State:
18.4% of AGI
(% of AGI for various income ranges: 12.5% for AGIs below $25k, 6.9% for AGIs $50k-75k, 8.8% for AGIs $75k-100k, 7.8% for AGIs $100k-200k)
Charity contributions: $3,015 (reported on 18.6% of returns)
Here:
$3,015
State:
$4,225
(% of AGI for various income ranges: 0.8% for AGIs below $25k, 0.8% for AGIs $50k-75k, 1.3% for AGIs $75k-100k, 1.5% for AGIs $100k-200k)
Taxes paid: $6,300 (reported on 22.9% of returns)
48873:
$6,300
State:
$8,327
(% of AGI for various income ranges: 3.0% for AGIs below $25k, 2.2% for AGIs $50k-75k, 3.2% for AGIs $75k-100k, 3.6% for AGIs $100k-200k)
Earned income credit: $1,967 (reported on 8.6% of returns)
Here:
$1,967
State:
$2,306
(% of AGI for various income ranges: 2.8% for AGIs below $25k, 0.7% for AGIs $25k-50k)
Percentage of individuals using paid preparers for their 2012 taxes: 61.4%
Here:
61%
State:
57%
(% for various income ranges: 50.0% for AGIs below $25k, 73.3% for AGIs $25k-50k, 66.7% for AGIs $50k-75k, 57.1% for AGIs $75k-100k, 70.0% for AGIs $100k-200k)
Averages for the 2004 tax year for zip code 48873, filed in 2005:
Average Adjusted Gross Income (AGI) in 2004: $43,803 (Individual Income Tax Returns)
Here:
$43,803
State:
$48,204
Salary/wage: $39,039 (reported on 87.0% of returns)
Here:
$39,039
State:
$42,791
(% of AGI for various income ranges: 73.0% for AGIs below $10k, 68.1% for AGIs $10k-25k, 74.9% for AGIs $25k-50k, 85.6% for AGIs $50k-75k, 89.8% for AGIs $75k-100k, 61.3% for AGIs over 100k)
Taxable interest for individuals: $1,345 (reported on 65.4% of returns)
This zip code:
$1,345
Michigan:
$1,725
(% of AGI for various income ranges: 6.6% for AGIs below $10k, 5.0% for AGIs $10k-25k, 2.1% for AGIs $25k-50k, 1.4% for AGIs $50k-75k, 0.5% for AGIs $75k-100k, 2.7% for AGIs over 100k)
Taxable dividends: $1,424 (reported on 27.8% of returns)
Here:
$1,424
State:
$3,420
(% of AGI for various income ranges: 2.3% for AGIs below $10k, 2.0% for AGIs $10k-25k, 1.0% for AGIs $25k-50k, 1.3% for AGIs $50k-75k, 0.3% for AGIs $75k-100k, 0.4% for AGIs over 100k)
Net capital gain/loss: +$3,186 (reported on 20.9% of returns)
Here:
+$3,186
State:
+$8,532
(% of AGI for various income ranges: -2.2% for AGIs below $10k, 1.8% for AGIs $10k-25k, 2.1% for AGIs $25k-50k, 1.9% for AGIs $50k-75k, 1.4% for AGIs $75k-100k, 0.8% for AGIs over 100k)
Profit/loss from business: +$2,557 (reported on 10.7% of returns)
Here:
+$2,557
State:
+$9,547
(% of AGI for various income ranges: -1.6% for AGIs below $10k, 3.7% for AGIs $10k-25k, 1.2% for AGIs $25k-50k, -0.0% for AGIs $50k-75k, 0.7% for AGIs $75k-100k)
IRA payment deduction: $2,375 (reported on 1.9% of returns)
48873:
$2,375
Michigan:
$2,875
Total itemized deductions: $13,982 (19% of AGI, reported on 27.3% of returns)
Here:
$13,982
State:
$18,509
Here:
18.5% of AGI
State:
20.7% of AGI
(% of AGI for various income ranges: 7.2% for AGIs $10k-25k, 8.0% for AGIs $25k-50k, 9.4% for AGIs $50k-75k, 10.5% for AGIs $75k-100k, 8.0% for AGIs over 100k)
Charity contributions deductions: $2,419 (3% of AGI, reported on 24.6% of returns)
Here:
$2,419
State:
$3,365
Here:
3.1% of AGI
State:
3.6% of AGI
(% of AGI for various income ranges: 0.4% for AGIs $10k-25k, 0.8% for AGIs $25k-50k, 1.6% for AGIs $50k-75k, 1.8% for AGIs $75k-100k, 1.6% for AGIs over 100k)
Total tax: $5,179 (reported on 80.6% of returns)
48873:
$5,179
State:
$7,691
(% of AGI for various income ranges: 2.2% for AGIs below $10k, 5.2% for AGIs $10k-25k, 6.6% for AGIs $25k-50k, 7.4% for AGIs $50k-75k, 9.0% for AGIs $75k-100k, 18.2% for AGIs over 100k)
Earned income credit: $1,000 (reported on 5.0% of returns)
Here:
$1,000
State:
$1,737
Percentage of individuals using paid preparers for their 2004 taxes: 61.8%
Here:
62%
State:
60%
(% for various income ranges: 46.0% for AGIs below $10k, 54.4% for AGIs $10k-25k, 68.0% for AGIs $25k-50k, 69.1% for AGIs $50k-75k, 67.4% for AGIs $75k-100k, 76.1% for AGIs over 100k)
Household received Food Stamps/SNAP in the past 12 months: 29 Household did not receive Food Stamps/SNAP in the past 12 months: 392
Women who had a birth in the past 12 months: 11 (7 now married, 3 unmarried) Women who did not have a birth in the past 12 months: 274 (116 now married, 158 unmarried)
Housing units in zip code 48873 with a mortgage: 204 (6 second mortgage, 7 both second mortgage and home equity loan) Houses without a mortgage: 3
Median monthly owner costs for units with a mortgage: $1,177 Median monthly owner costs for units without a mortgage: $504
Residents with income below the poverty level in 2022:
This zip code:
3.7%
Whole state:
13.4%
Residents with income below 50% of the poverty level in 2022:
This zip code:
2.8%
Whole state:
6.9%
Median number of rooms in houses and condos:
Here:
6.6
State:
6.5
Median number of rooms in apartments:
Here:
5.4
State:
4.3
Notable locations in this zip code not listed on our city pages
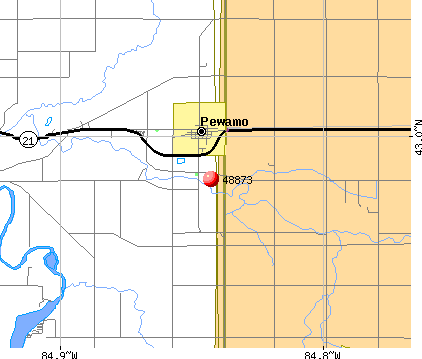
Notable locations in zip code 48873: Nurenberg Farms (A), Maple River Campground (B), Huckleberry Creek Golf Course (C), Pewamo Fire Department (D). Display/hide their locations on the map
Cemeteries: Pewamo Cemetery (1), East Plains Cemetery (2), Spaulding Cemetery (3), Maple Corners Cemetery (4), Mount Calvary Cemetery (5). Display/hide their locations on the map
Size of family households: 131 2-persons, 37 3-persons, 35 4-persons, 53 5-persons, 9 6-persons, 54 7-or-more-persons
Size of nonfamily households: 88 1-person, 13 2-persons
487 married couples with children.
40 single-parent households (12 men, 28 women).
97.8% of residents of 48873 zip code speak English at home.
1.3% of residents speak other Indo-European language at home (100% very well).
Foreign born population: 13 (0.9%) (70.3% of them are naturalized citizens)
This zip code:
0.9%
Whole state:
6.9%
62%Germany
23%Honduras
86%German
5%Irish
4%American
3%English
1%Dutch
1%French Canadian
1%Polish
Year of entry for the foreign-born population
02010 or later
02000 to 2009
131990 to 1999
0Before 1990
Facilities with environmental interests located in this zip code:
MI DEPT/STATE POLICE (9460 WAGER RD in PEWAMO, MI)
(Resource Conservation and Recovery Act (tracking hazardous waste)) Alternative names: CENTRAL MICHIGAN ENFORCEMENT TEAM
Housing units lacking complete plumbing facilities: 4.7% Housing units lacking complete kitchen facilities: 3.5%
52.5%Utility gas
19.1%Bottled, tank, or LP gas
18.9%Wood
4.8%Fuel oil, kerosene, etc.
2.9%Electricity
1.9%Other fuel
Population in 1990: 654. Population change in the 1990s: +1,242 (+189.9%).
Place of birth for U.S.-born residents:
This state: 1,241
Northeast: 10
Midwest: 35
West: 97
76% of the 48873 zip code residents lived in the same house 5 years ago. Out of people who lived in different houses, 62% lived in this county. Out of people who lived in different counties, 50% lived in Michigan.
99% of the 48873 zip code residents lived in the same house 1 year ago. Out of people who lived in different houses, 55% moved from this county. Out of people who lived in different houses, 27% moved from different county within same state. Out of people who lived in different houses, 36% moved from different state.
Private vs. public school enrollment:
Students in private schools in grades 1 to 8 (elementary and middle school): 164
Here:
47.7%
Michigan:
12.4%
Students in private schools in grades 9 to 12 (high school): 2
Here:
2.8%
Michigan:
9.8%
Students in private undergraduate colleges:
Here:
0.0%
Michigan:
14.9%
Occupation by median earnings in the past 12 months ($)
152,383Sales and related occupations
89,630Computer and mathematical occupations
89,126Architecture and engineering occupations
76,346Management occupations
69,203Business and financial operations occupations
61,423Installation, maintenance, and repair occupations
Top industries in this zip code by the number of employees in 2005:
Other Services (except Public Administration): Religious Organizations (10-19 employees: 1 establishment)
Construction: Plumbing, Heating, and Air-Conditioning Contractors (5-9: 1)
Professional, Scientific, and Technical Services: Veterinary Services (5-9: 1)
Accommodation and Food Services: Full-Service Restaurants (5-9: 1)
Finance and Insurance: Commercial Banking (1-4: 1)
Fatal accident statistics in 2014:
Fatal accident count: 1
Vehicles involved in fatal accidents: 1
Fatal accidents caused by drunken drivers: 1
Fatalities: 1
Persons involved in fatal accidents: 1
Pedestrians involved in fatal accidents: 0
Fatal accident statistics in 2010:
Fatal accident count: 1
Vehicles involved in fatal accidents: 1
Fatal accidents caused by drunken drivers: 1
Fatalities: 1
Persons involved in fatal accidents: 2
Pedestrians involved in fatal accidents: 0
Home Mortgage Disclosure Act Aggregated Statistics For Year 2009 (Based on 8 partial tracts)
A) FHA, FSA/RHS & VA Home Purchase Loans
B) Conventional Home Purchase Loans
C) Refinancings
D) Home Improvement Loans
F) Non-occupant Loans on < 5 Family Dwellings (A B C & D)
G) Loans On Manufactured Home Dwelling (A B C & D)
Number
Average Value
Number
Average Value
Number
Average Value
Number
Average Value
Number
Average Value
Number
Average Value
LOANS ORIGINATED
14
$110,421
16
$83,376
101
$117,087
10
$23,174
4
$71,580
11
$57,661
APPLICATIONS APPROVED, NOT ACCEPTED
1
$114,970
2
$52,120
7
$124,816
0
$0
0
$0
1
$16,210
APPLICATIONS DENIED
4
$86,910
2
$62,725
30
$147,578
4
$25,582
2
$82,860
4
$70,238
APPLICATIONS WITHDRAWN
2
$106,455
3
$68,187
20
$129,464
1
$7,290
1
$73,450
1
$103,790
FILES CLOSED FOR INCOMPLETENESS
0
$0
1
$52,530
4
$96,238
0
$0
0
$0
0
$0
Aggregated Statistics For Year 2008 (Based on 8 partial tracts)
A) FHA, FSA/RHS & VA Home Purchase Loans
B) Conventional Home Purchase Loans
C) Refinancings
D) Home Improvement Loans
F) Non-occupant Loans on < 5 Family Dwellings (A B C & D)
G) Loans On Manufactured Home Dwelling (A B C & D)
Number
Average Value
Number
Average Value
Number
Average Value
Number
Average Value
Number
Average Value
Number
Average Value
LOANS ORIGINATED
11
$96,405
25
$114,628
67
$109,681
13
$24,476
5
$61,616
17
$58,573
APPLICATIONS APPROVED, NOT ACCEPTED
2
$87,030
2
$60,220
10
$132,616
0
$0
1
$37,350
2
$96,720
APPLICATIONS DENIED
2
$87,545
4
$70,552
36
$127,035
6
$63,703
3
$39,903
8
$78,669
APPLICATIONS WITHDRAWN
1
$131,280
2
$109,400
15
$140,095
1
$46,090
1
$103,220
1
$90,890
FILES CLOSED FOR INCOMPLETENESS
0
$0
1
$76,920
3
$150,637
1
$4,880
0
$0
0
$0
Aggregated Statistics For Year 2007 (Based on 8 partial tracts)
A) FHA, FSA/RHS & VA Home Purchase Loans
B) Conventional Home Purchase Loans
C) Refinancings
D) Home Improvement Loans
F) Non-occupant Loans on < 5 Family Dwellings (A B C & D)
G) Loans On Manufactured Home Dwelling (A B C & D)
Number
Average Value
Number
Average Value
Number
Average Value
Number
Average Value
Number
Average Value
Number
Average Value
LOANS ORIGINATED
4
$99,010
41
$110,008
92
$96,644
26
$37,223
6
$62,285
13
$51,918
APPLICATIONS APPROVED, NOT ACCEPTED
0
$0
5
$133,208
14
$105,938
1
$117,830
0
$0
2
$58,690
APPLICATIONS DENIED
3
$119,890
13
$104,330
60
$126,129
8
$54,941
3
$98,387
9
$72,386
APPLICATIONS WITHDRAWN
1
$35,410
5
$94,438
18
$152,560
2
$118,120
0
$0
1
$102,590
FILES CLOSED FOR INCOMPLETENESS
0
$0
2
$334,655
7
$112,941
1
$109,470
0
$0
0
$0
Aggregated Statistics For Year 2006 (Based on 8 partial tracts)
A) FHA, FSA/RHS & VA Home Purchase Loans
B) Conventional Home Purchase Loans
C) Refinancings
D) Home Improvement Loans
F) Non-occupant Loans on < 5 Family Dwellings (A B C & D)
G) Loans On Manufactured Home Dwelling (A B C & D)
Number
Average Value
Number
Average Value
Number
Average Value
Number
Average Value
Number
Average Value
Number
Average Value
LOANS ORIGINATED
6
$115,413
55
$105,842
100
$101,694
26
$31,138
7
$62,996
19
$61,766
APPLICATIONS APPROVED, NOT ACCEPTED
1
$101,690
9
$85,791
18
$106,392
1
$70,390
1
$38,020
2
$46,245
APPLICATIONS DENIED
1
$109,130
18
$80,237
66
$118,425
8
$71,852
4
$78,625
9
$53,486
APPLICATIONS WITHDRAWN
1
$154,750
7
$92,079
32
$126,515
2
$29,655
2
$70,285
2
$120,180
FILES CLOSED FOR INCOMPLETENESS
0
$0
2
$137,710
13
$138,441
1
$19,690
0
$0
0
$0
Aggregated Statistics For Year 2005 (Based on 8 partial tracts)
A) FHA, FSA/RHS & VA Home Purchase Loans
B) Conventional Home Purchase Loans
C) Refinancings
D) Home Improvement Loans
F) Non-occupant Loans on < 5 Family Dwellings (A B C & D)
G) Loans On Manufactured Home Dwelling (A B C & D)
Number
Average Value
Number
Average Value
Number
Average Value
Number
Average Value
Number
Average Value
Number
Average Value
LOANS ORIGINATED
5
$118,730
59
$113,488
147
$112,165
27
$35,737
7
$77,679
22
$57,891
APPLICATIONS APPROVED, NOT ACCEPTED
0
$0
9
$106,860
18
$104,998
3
$30,180
1
$63,010
3
$45,630
APPLICATIONS DENIED
1
$53,320
13
$76,962
76
$114,284
10
$35,326
3
$86,233
11
$73,516
APPLICATIONS WITHDRAWN
1
$101,950
10
$107,035
46
$124,827
6
$104,452
2
$99,425
2
$73,830
FILES CLOSED FOR INCOMPLETENESS
0
$0
3
$125,360
16
$153,015
1
$53,090
0
$0
1
$64,090
Aggregated Statistics For Year 2004 (Based on 8 partial tracts)
A) FHA, FSA/RHS & VA Home Purchase Loans
B) Conventional Home Purchase Loans
C) Refinancings
D) Home Improvement Loans
F) Non-occupant Loans on < 5 Family Dwellings (A B C & D)
G) Loans On Manufactured Home Dwelling (A B C & D)
Number
Average Value
Number
Average Value
Number
Average Value
Number
Average Value
Number
Average Value
Number
Average Value
LOANS ORIGINATED
9
$120,142
59
$107,375
147
$106,323
24
$31,951
7
$76,483
22
$59,548
APPLICATIONS APPROVED, NOT ACCEPTED
1
$68,300
6
$91,173
23
$107,032
3
$59,353
1
$93,900
4
$62,722
APPLICATIONS DENIED
1
$74,450
17
$71,872
67
$109,282
9
$39,372
2
$99,420
14
$54,029
APPLICATIONS WITHDRAWN
1
$82,460
5
$117,820
33
$113,559
1
$73,710
2
$63,900
3
$90,283
FILES CLOSED FOR INCOMPLETENESS
0
$0
2
$98,570
18
$128,468
2
$34,850
0
$0
1
$86,900
Aggregated Statistics For Year 2003 (Based on 4 partial tracts)
A) FHA, FSA/RHS & VA Home Purchase Loans
B) Conventional Home Purchase Loans
C) Refinancings
D) Home Improvement Loans
F) Non-occupant Loans on < 5 Family Dwellings (A B C & D)
Number
Average Value
Number
Average Value
Number
Average Value
Number
Average Value
Number
Average Value
LOANS ORIGINATED
3
$93,213
15
$128,938
95
$112,605
5
$24,920
1
$70,530
APPLICATIONS APPROVED, NOT ACCEPTED
0
$0
2
$57,870
7
$129,020
1
$11,290
0
$0
APPLICATIONS DENIED
0
$0
2
$72,605
16
$122,291
1
$39,670
0
$0
APPLICATIONS WITHDRAWN
0
$0
2
$177,480
8
$126,386
0
$0
0
$0
FILES CLOSED FOR INCOMPLETENESS
0
$0
1
$88,210
2
$131,225
0
$0
0
$0
Aggregated Statistics For Year 2002 (Based on 4 partial tracts)
A) FHA, FSA/RHS & VA Home Purchase Loans
B) Conventional Home Purchase Loans
C) Refinancings
D) Home Improvement Loans
F) Non-occupant Loans on < 5 Family Dwellings (A B C & D)
Number
Average Value
Number
Average Value
Number
Average Value
Number
Average Value
Number
Average Value
LOANS ORIGINATED
3
$108,463
12
$135,711
67
$116,376
5
$26,198
2
$63,370
APPLICATIONS APPROVED, NOT ACCEPTED
0
$0
2
$146,975
5
$104,628
1
$6,880
0
$0
APPLICATIONS DENIED
0
$0
1
$79,570
12
$96,168
3
$14,123
0
$0
APPLICATIONS WITHDRAWN
0
$0
1
$105,560
3
$100,467
0
$0
0
$0
FILES CLOSED FOR INCOMPLETENESS
0
$0
0
$0
3
$111,177
0
$0
0
$0
Aggregated Statistics For Year 2001 (Based on 4 partial tracts)
A) FHA, FSA/RHS & VA Home Purchase Loans
B) Conventional Home Purchase Loans
C) Refinancings
D) Home Improvement Loans
F) Non-occupant Loans on < 5 Family Dwellings (A B C & D)
Number
Average Value
Number
Average Value
Number
Average Value
Number
Average Value
Number
Average Value
LOANS ORIGINATED
1
$112,130
16
$109,256
44
$101,958
10
$18,903
2
$53,570
APPLICATIONS APPROVED, NOT ACCEPTED
0
$0
1
$50,310
5
$113,002
2
$22,375
0
$0
APPLICATIONS DENIED
0
$0
2
$65,670
13
$104,218
2
$19,550
0
$0
APPLICATIONS WITHDRAWN
0
$0
1
$47,950
5
$117,816
0
$0
0
$0
FILES CLOSED FOR INCOMPLETENESS
0
$0
0
$0
2
$100,075
0
$0
0
$0
Aggregated Statistics For Year 2000 (Based on 4 partial tracts)
A) FHA, FSA/RHS & VA Home Purchase Loans
B) Conventional Home Purchase Loans
C) Refinancings
D) Home Improvement Loans
Number
Average Value
Number
Average Value
Number
Average Value
Number
Average Value
LOANS ORIGINATED
2
$89,370
13
$104,075
15
$83,384
12
$11,535
APPLICATIONS APPROVED, NOT ACCEPTED
0
$0
0
$0
3
$77,893
2
$25,185
APPLICATIONS DENIED
0
$0
1
$69,880
9
$68,236
3
$21,353
APPLICATIONS WITHDRAWN
0
$0
1
$52,410
4
$80,925
0
$0
FILES CLOSED FOR INCOMPLETENESS
0
$0
0
$0
1
$75,850
0
$0
Aggregated Statistics For Year 1999 (Based on 2 partial tracts)


 Nearest zip codes: 48860, 48894, 48835, 48851, 48845, 48875.


