Estimated zip code population in 2022: 1,962 Zip code population in 2010: 2,392 Zip code population in 2000: 2,477
Houses and condos: 1,048 Renter-occupied apartments: 79
% of renters here:
9%
State:
27%
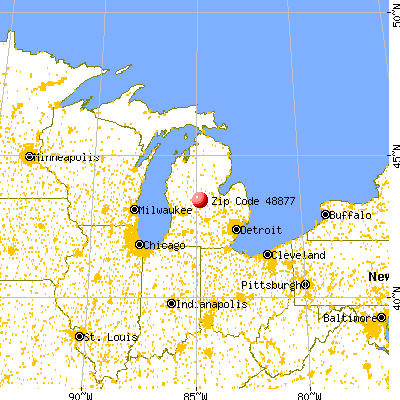
March 2022 cost of living index in zip code 48877: 80.0 (low, U.S. average is 100)
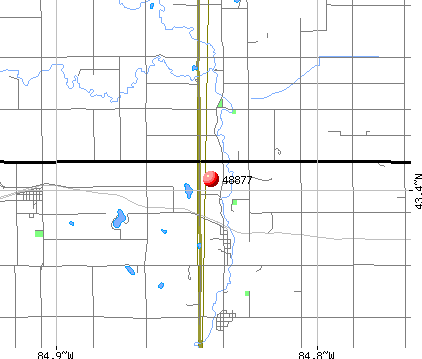
Land area: 33.7 sq. mi. Water area: 0.4 sq. mi.
Population density: 58 people per square mile
(very low).
OSM Map
General Map
Google Map
MSN Map
OSM Map
General Map
Google Map
MSN Map
OSM Map
General Map
Google Map
MSN Map
OSM Map
General Map
Google Map
MSN Map
Please wait while loading the map...
Real estate property taxes paid for housing units in 2022:
This zip code:
1.1% ($1,292)
Michigan:
1.2% ($2,746)
Median real estate property taxes paid for housing units with mortgages in 2022: $1,448 (1.1%) Median real estate property taxes paid for housing units with no mortgage in 2022: $1,161 (1.2%)
Business Search- 14 Million verified businesses
Males: 984
(50.2%)
Females: 978
(49.8%)
For population 25 years and over in 48877:
High school or higher: 85.3%
Bachelor's degree or higher: 9.4%
Graduate or professional degree: 3.3%
Unemployed: 7.7%
Mean travel time to work (commute): 39.9 minutes
For population 15 years and over in 48877:
Never married: 28.4%
Now married: 49.0%
Separated: 0.6%
Widowed: 8.4%
Divorced: 13.5%
Zip code 48877 compared to state average:
Median house value below state average.
Black race population percentage significantly below state average.
Hispanic race population percentage below state average.
Median age above state average.
Foreign-born population percentage significantly below state average.
Renting percentage significantly below state average.
Length of stay since moving in significantly above state average.
Number of college students below state average.
Percentage of population with a bachelor's degree or higher significantly below state average.
Averages for the 2020 tax year for zip code 48877, filed in 2021:
Average Adjusted Gross Income (AGI) in 2020: $47,376 (Individual Income Tax Returns)
Here:
$47,376
State:
$68,945
Salary/wage: $42,627 (reported on 76.7% of returns)
Here:
$42,627
State:
$57,142
(% of AGI for various income ranges: 1030.4% for AGIs below $25k, 3359.6% for AGIs $25k-50k, 5447.1% for AGIs $50k-75k, 7920.0% for AGIs $75k-100k, 19732.0% for AGIs $100k-200k)
Taxable interest for individuals: $583 (reported on 23.3% of returns)
This zip code:
$583
Michigan:
$1,630
(% of AGI for various income ranges: 10.8% for AGIs below $25k, 12.5% for AGIs $25k-50k, 7.9% for AGIs $50k-75k, 51.4% for AGIs $75k-100k, 72.0% for AGIs $100k-200k)
Ordinary dividends: $1,510 (reported on 9.7% of returns)
Here:
$1,510
State:
$6,972
(% of AGI for various income ranges: 33.6% for AGIs below $25k, 20.0% for AGIs $50k-75k, 78.0% for AGIs $100k-200k)
Net capital gain/loss in AGI: +$4,611 (reported on 8.7% of returns)
Here:
+$4,611
State:
+$20,064
(% of AGI for various income ranges: 4.0% for AGIs below $25k, 35.0% for AGIs $25k-50k, 70.0% for AGIs $50k-75k, 446.0% for AGIs $100k-200k)
Profit/loss from business: +$7,077 (reported on 12.6% of returns)
Here:
+$7,077
State:
+$11,172
(% of AGI for various income ranges: 101.6% for AGIs below $25k, 202.1% for AGIs $25k-50k, 129.3% for AGIs $50k-75k)
Taxable individual retirement arrangement distribution: $17,380 (reported on 9.7% of returns)
48877:
$17,380
Michigan:
$19,803
(% of AGI for various income ranges: 96.0% for AGIs below $25k, 105.4% for AGIs $25k-50k, 327.1% for AGIs $50k-75k, 1124.3% for AGIs $75k-100k)
Earned income credit: $2,195 (reported on 18.4% of returns)
Here:
$2,195
State:
$2,251
(% of AGI for various income ranges: 89.2% for AGIs below $25k, 80.8% for AGIs $25k-50k)
Percentage of individuals using paid preparers for their 2020 taxes: 94.2%
Here:
94%
State:
93%
(% for various income ranges: 94.6% for AGIs below $25k, 96.7% for AGIs $25k-50k, 94.1% for AGIs $50k-75k, 88.9% for AGIs $75k-100k, 90.0% for AGIs $100k-200k)
Averages for the 2012 tax year for zip code 48877, filed in 2013:
Average Adjusted Gross Income (AGI) in 2012: $38,946 (Individual Income Tax Returns)
Here:
$38,946
State:
$55,609
Salary/wage: $33,796 (reported on 83.3% of returns)
Here:
$33,796
State:
$46,782
(% of AGI for various income ranges: 69.2% for AGIs below $25k, 80.6% for AGIs $25k-50k, 75.6% for AGIs $50k-75k, 83.0% for AGIs $75k-100k, 59.2% for AGIs $100k-200k)
Taxable interest for individuals: $614 (reported on 21.6% of returns)
This zip code:
$614
Michigan:
$1,491
(% of AGI for various income ranges: 0.7% for AGIs below $25k, 0.4% for AGIs $25k-50k, 0.5% for AGIs $50k-75k, 0.1% for AGIs $75k-100k)
Ordinary dividends: $1,308 (reported on 12.7% of returns)
Here:
$1,308
State:
$6,225
(% of AGI for various income ranges: 0.6% for AGIs below $25k, 0.2% for AGIs $25k-50k, 0.7% for AGIs $50k-75k, 1.0% for AGIs $75k-100k)
Net capital gain/loss in AGI: +$7,929 (reported on 6.9% of returns)
Here:
+$7,929
State:
+$9,326
(% of AGI for various income ranges: 0.2% for AGIs $25k-50k, 6.2% for AGIs $50k-75k)
Profit/loss from business: +$5,750 (reported on 11.8% of returns)
Here:
+$5,750
State:
+$11,523
(% of AGI for various income ranges: 5.4% for AGIs below $25k, 1.9% for AGIs $25k-50k, 2.1% for AGIs $50k-75k)
Taxable individual retirement arrangement distribution: $12,488 (reported on 7.8% of returns)
48877:
$12,488
Michigan:
$15,298
(% of AGI for various income ranges: 3.0% for AGIs below $25k, 4.0% for AGIs $25k-50k, 8.9% for AGIs $75k-100k)
Total itemized deductions: $18,018 (20% of AGI, reported on 16.7% of returns)
Here:
$18,018
State:
$21,628
Here:
20.2% of AGI
State:
18.4% of AGI
(% of AGI for various income ranges: 8.8% for AGIs $25k-50k, 7.6% for AGIs $50k-75k, 7.9% for AGIs $75k-100k, 11.2% for AGIs $100k-200k)
Charity contributions: $3,458 (reported on 11.8% of returns)
Here:
$3,458
State:
$4,225
(% of AGI for various income ranges: 0.8% for AGIs $25k-50k, 1.5% for AGIs $50k-75k, 2.0% for AGIs $100k-200k)
Taxes paid: $5,847 (reported on 16.7% of returns)
48877:
$5,847
State:
$8,327
(% of AGI for various income ranges: 1.6% for AGIs $25k-50k, 2.4% for AGIs $50k-75k, 2.7% for AGIs $75k-100k, 4.6% for AGIs $100k-200k)
Earned income credit: $2,364 (reported on 24.5% of returns)
Here:
$2,364
State:
$2,306
(% of AGI for various income ranges: 7.6% for AGIs below $25k, 1.4% for AGIs $25k-50k)
Percentage of individuals using paid preparers for their 2012 taxes: 60.8%
Here:
61%
State:
57%
(% for various income ranges: 55.1% for AGIs below $25k, 61.5% for AGIs $25k-50k, 66.7% for AGIs $50k-75k, 83.3% for AGIs $75k-100k, 66.7% for AGIs $100k-200k)
Averages for the 2004 tax year for zip code 48877, filed in 2005:
Average Adjusted Gross Income (AGI) in 2004: $33,136 (Individual Income Tax Returns)
Here:
$33,136
State:
$48,204
Salary/wage: $31,139 (reported on 86.8% of returns)
Here:
$31,139
State:
$42,791
(% of AGI for various income ranges: 113.8% for AGIs below $10k, 74.4% for AGIs $10k-25k, 83.2% for AGIs $25k-50k, 87.7% for AGIs $50k-75k, 89.3% for AGIs $75k-100k, 56.4% for AGIs over 100k)
Taxable interest for individuals: $631 (reported on 30.7% of returns)
This zip code:
$631
Michigan:
$1,725
(% of AGI for various income ranges: 1.5% for AGIs below $10k, 1.4% for AGIs $10k-25k, 0.4% for AGIs $25k-50k, 0.2% for AGIs $50k-75k, 0.1% for AGIs $75k-100k, 1.3% for AGIs over 100k)
Taxable dividends: $1,173 (reported on 12.7% of returns)
Here:
$1,173
State:
$3,420
(% of AGI for various income ranges: 1.3% for AGIs below $10k, 0.7% for AGIs $10k-25k, 0.1% for AGIs $25k-50k, 0.2% for AGIs $50k-75k, 1.5% for AGIs $75k-100k)
Net capital gain/loss: +$1,989 (reported on 8.8% of returns)
Here:
+$1,989
State:
+$8,532
(% of AGI for various income ranges: -0.6% for AGIs below $10k, 0.6% for AGIs $10k-25k, 0.2% for AGIs $25k-50k, 0.4% for AGIs $50k-75k, 1.9% for AGIs $75k-100k)
Profit/loss from business: +$4,481 (reported on 15.4% of returns)
Here:
+$4,481
State:
+$9,547
(% of AGI for various income ranges: 21.3% for AGIs below $10k, 6.6% for AGIs $10k-25k, 1.7% for AGIs $25k-50k, 0.5% for AGIs $50k-75k, 0.2% for AGIs $75k-100k)
IRA payment deduction: $2,154 (reported on 1.3% of returns)
48877:
$2,154
Michigan:
$2,875
Total itemized deductions: $14,516 (23% of AGI, reported on 19.2% of returns)
Here:
$14,516
State:
$18,509
Here:
22.7% of AGI
State:
20.7% of AGI
(% of AGI for various income ranges: 5.4% for AGIs $10k-25k, 6.5% for AGIs $25k-50k, 10.1% for AGIs $50k-75k, 13.9% for AGIs $75k-100k, 7.8% for AGIs over 100k)
Charity contributions deductions: $2,439 (4% of AGI, reported on 15.5% of returns)
Here:
$2,439
State:
$3,365
Here:
3.6% of AGI
State:
3.6% of AGI
(% of AGI for various income ranges: 0.3% for AGIs $10k-25k, 0.6% for AGIs $25k-50k, 1.2% for AGIs $50k-75k, 1.9% for AGIs $75k-100k, 2.9% for AGIs over 100k)
Total tax: $3,276 (reported on 70.7% of returns)
48877:
$3,276
State:
$7,691
(% of AGI for various income ranges: 4.1% for AGIs below $10k, 3.7% for AGIs $10k-25k, 5.9% for AGIs $25k-50k, 7.8% for AGIs $50k-75k, 9.6% for AGIs $75k-100k, 9.2% for AGIs over 100k)
Earned income credit: $1,764 (reported on 21.6% of returns)
Here:
$1,764
State:
$1,737
Percentage of individuals using paid preparers for their 2004 taxes: 49.9%
Here:
50%
State:
60%
(% for various income ranges: 42.9% for AGIs below $10k, 53.1% for AGIs $10k-25k, 45.6% for AGIs $25k-50k, 58.6% for AGIs $50k-75k, 55.9% for AGIs $75k-100k, 66.7% for AGIs over 100k)
Likely homosexual households (counted as self-reported same-sex unmarried-partner households)
Lesbian couples: 0.0% of all households
Gay men: 1.0% of all households
Household received Food Stamps/SNAP in the past 12 months: 111 Household did not receive Food Stamps/SNAP in the past 12 months: 745
Women who had a birth in the past 12 months: 24 (16 now married, 8 unmarried) Women who did not have a birth in the past 12 months: 407 (160 now married, 247 unmarried)
Housing units in zip code 48877 with a mortgage: 399 (28 second mortgage, 18 both second mortgage and home equity loan) Median monthly owner costs for units with a mortgage: $1,021 Median monthly owner costs for units without a mortgage: $406
Residents with income below the poverty level in 2022:
This zip code:
17.7%
Whole state:
13.4%
Residents with income below 50% of the poverty level in 2022:
This zip code:
11.9%
Whole state:
6.9%
Median number of rooms in houses and condos:
Here:
6.1
State:
6.5
Median number of rooms in apartments:
Here:
5.6
State:
4.3
Notable locations in this zip code not listed on our city pages
Churches in zip code 48877 include: Tabernacle Church (A), Lincoln Road United Methodist Church (B), Lighthouse Baptist Church (C). Display/hide their locations on the map
In group quarters: 20 (-1 institutionalized population)
Size of family households: 392 2-persons, 75 3-persons, 127 4-persons, 11 5-persons, 3 6-persons, 2 7-or-more-persons
Size of nonfamily households: 162 1-person, 64 2-persons, 20 3-persons
159 married couples with children.
76 single-parent households (24 men, 52 women).
99.6% of residents of 48877 zip code speak English at home.
0.4% of residents speak Spanish at home (100% very well).
Foreign born population: 7 (0.4%) (58.4% of them are naturalized citizens)
This zip code:
0.4%
Whole state:
6.9%
57%Malaysia
29%Sweden
29%United Kingdom, excluding England and Scotland
29%German
21%American
15%English
3%Irish
3%Italian
2%Hungarian
2%Pennsylvania German
Year of entry for the foreign-born population
02010 or later
02000 to 2009
31990 to 1999
6Before 1990
Facilities with environmental interests located in this zip code:
MI DEPT/NATURAL RESOURCES (8345 LUMBERJACK RD in RIVERDALE, MI)
(Resource Conservation and Recovery Act (tracking hazardous waste)) Organizations: MICH DEPT OF NATURAL RESOURCES (CONTACT/OPERATOR)
Alternative names: MIDNR LUMBERJACK ROAD RIVERDALE
MI DEPT/TRANSPORTATION BRIDGE (M-46 OVER PINE RIVER in RIVERDALE, MI)
(Resource Conservation and Recovery Act (tracking hazardous waste)) Organizations: MICH DEPT OF TRANSPORTATION (CONTACT/OPERATOR)
Alternative names: MIDOT BRIDGE M-46 OVER PINE RIVER
Housing units lacking complete plumbing facilities: 1.7% Housing units lacking complete kitchen facilities: 2.1%
47.4%Bottled, tank, or LP gas
25.1%Utility gas
14.6%Wood
6.0%Electricity
3.8%Fuel oil, kerosene, etc.
3.6%Other fuel
Population in 1990: 1,211. Population change in the 1990s: +1,266 (+104.5%).
Place of birth for U.S.-born residents:
This state: 1,805
Northeast: 7
Midwest: 42
South: 81
West: 8
63% of the 48877 zip code residents lived in the same house 5 years ago. Out of people who lived in different houses, 52% lived in this county. Out of people who lived in different counties, 50% lived in Michigan.
97% of the 48877 zip code residents lived in the same house 1 year ago. Out of people who lived in different houses, 42% moved from this county. Out of people who lived in different houses, 51% moved from different county within same state. Out of people who lived in different houses, 13% moved from different state.
Private vs. public school enrollment:
Students in private schools in grades 1 to 8 (elementary and middle school): 4
Here:
4.7%
Michigan:
12.4%
Students in private schools in grades 9 to 12 (high school): 9
Here:
7.0%
Michigan:
9.8%
Students in private undergraduate colleges:
Here:
0.0%
Michigan:
14.9%
Occupation by median earnings in the past 12 months ($)
103,761Farming, fishing, and forestry occupations
50,737Health technologists and technicians
47,315Management occupations
45,639Health diagnosing and treating practitioners and other technical occupations
41,528Installation, maintenance, and repair occupations
38,733Material moving occupations
Companies with federal contracts located in this zip code:
AMERICAN SOFT TRIM, INC (8734 N LUMBERJACK RD in RIVERDALE, MI; small business)
$67,659 with Army for Aircraft Propellers and Components. Taking place in NY. Signed on 2003-04-17. Completion date: 2003-07-11.
Top industries in this zip code by the number of employees in 2005:
Accommodation and Food Services: Full-Service Restaurants (10-19 employees: 1 establishment)
Construction: Water and Sewer Line and Related Structures Construction (10-19: 1)
Construction: Electrical Contractors (5-9: 1)
Construction: Site Preparation Contractors (5-9: 1)
Health Care and Social Assistance: Services for the Elderly and Persons with Disabilities (5-9: 1)
Construction: Commercial and Institutional Building Construction (1-4: 2)
Administrative and Support and Waste Management and Remediation Services: Landscaping Services (1-4: 1)
Construction: New Single-Family Housing Construction (except Operative Builders) (1-4: 1)
People in group quarters in 2010:
37 people in group homes intended for adults
People in group quarters in 2000:
44 people in homes for the mentally retarded
3 people in other group homes
Fatal accident statistics in 2012:
Fatal accident count: 1
Vehicles involved in fatal accidents: 2
Fatal accidents caused by drunken drivers: 0
Fatalities: 1
Persons involved in fatal accidents: 9
Pedestrians involved in fatal accidents: 0
Fatal accident statistics in 2010:
Fatal accident count: 1
Vehicles involved in fatal accidents: 1
Fatal accidents caused by drunken drivers: 1
Fatalities: 1
Persons involved in fatal accidents: 1
Pedestrians involved in fatal accidents: 0
2002 - 2018 National Fire Incident Reporting System (NFIRS) incidents
Based on the data from the years 2002 - 2018 the average number of fire incidents per year is 7. The highest number of fire incidents - 15 took place in 2018, and the least - 1 in 2003. The data has a rising trend.
When looking into fire subcategories, the most incidents belonged to: Structure Fires (59.5%), and Outside Fires (30.6%).
Fire incident types reported to NFIRS in Zip Code 48877


 Nearest zip codes: 48832, 48891, 48889, 48896, 48818, 48801.


 Based on the data from the years 2002 - 2018 the average number of fire incidents per year is 7. The highest number of fire incidents - 15 took place in 2018, and the least - 1 in 2003. The data has a rising trend.
 When looking into fire subcategories, the most incidents belonged to: Structure Fires (59.5%), and Outside Fires (30.6%).