Estimated zip code population in 2022: 18,562 Zip code population in 2010: 18,075 Zip code population in 2000: 17,193
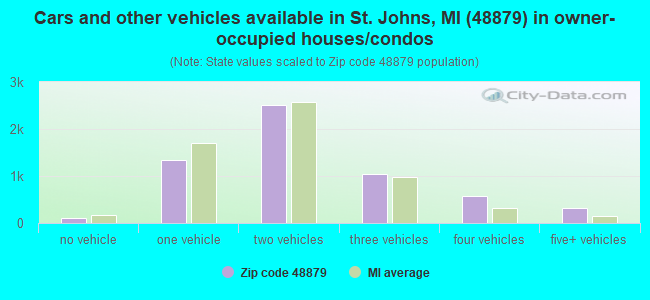
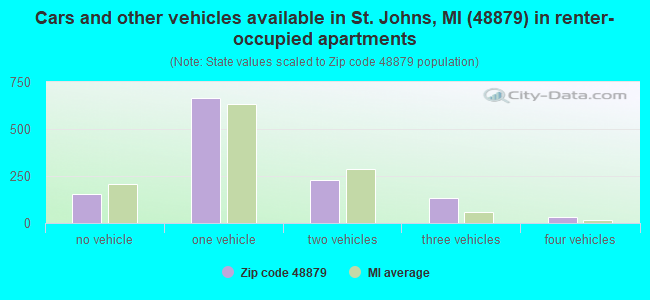
Houses and condos: 7,466 Renter-occupied apartments: 1,211
% of renters here:
17%
State:
27%
March 2022 cost of living index in zip code 48879: 81.4 (low, U.S. average is 100)
Land area: 189.1 sq. mi. Water area: 0.8 sq. mi.
Population density: 98 people per square mile
(very low).
OSM Map
General Map
Google Map
MSN Map
OSM Map
General Map
Google Map
MSN Map
OSM Map
General Map
Google Map
MSN Map
OSM Map
General Map
Google Map
MSN Map
Please wait while loading the map...
Real estate property taxes paid for housing units in 2022:
This zip code:
1.1% ($2,540)
Michigan:
1.2% ($2,746)
Median real estate property taxes paid for housing units with mortgages in 2022: $2,563 (1.2%) Median real estate property taxes paid for housing units with no mortgage in 2022: $2,527 (1.1%)
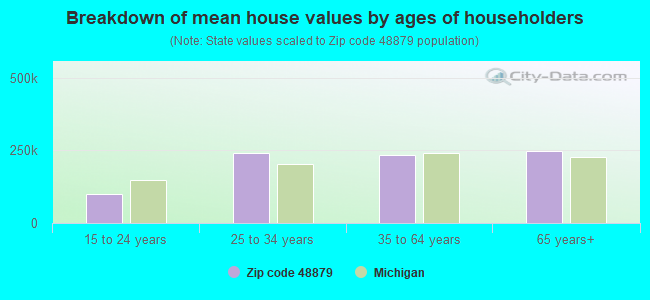
Estimated median house/condo value in 2022: $223,284
48879:
$223,284
Michigan:
$224,400
According to our research of Michigan and other state lists, there were 47 registered sex offenders living in 48879 zip code as of May 15, 2024. The ratio of all residents to sex offenders in zip code 48879 is 387 to 1. The ratio of registered sex offenders to all residents in this zip code is lower than the state average.
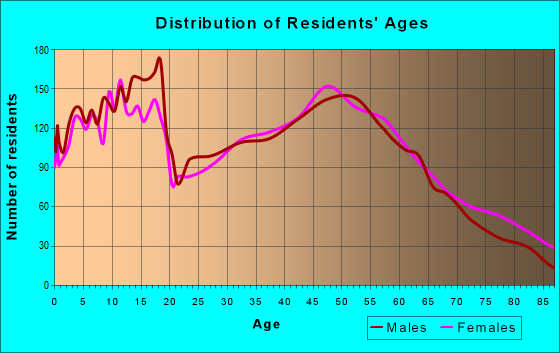
Median resident age:
This zip code:
42.7 years
Michigan median age:
40.3 years
Average household size:
This zip code:
2.6 people
Michigan:
2.4 people
Averages for the 2020 tax year for zip code 48879, filed in 2021:
Average Adjusted Gross Income (AGI) in 2020: $62,691 (Individual Income Tax Returns)
Here:
$62,691
State:
$68,945
Salary/wage: $54,081 (reported on 77.6% of returns)
Here:
$54,081
State:
$57,142
(% of AGI for various income ranges: 978.9% for AGIs below $25k, 3280.1% for AGIs $25k-50k, 5792.3% for AGIs $50k-75k, 8868.5% for AGIs $75k-100k, 16235.7% for AGIs $100k-200k, 76742.0% for AGIs over 200k)
Taxable interest for individuals: $1,521 (reported on 34.3% of returns)
This zip code:
$1,521
Michigan:
$1,630
(% of AGI for various income ranges: 21.2% for AGIs below $25k, 26.2% for AGIs $25k-50k, 57.4% for AGIs $50k-75k, 79.1% for AGIs $75k-100k, 87.5% for AGIs $100k-200k, 3912.0% for AGIs over 200k)
Ordinary dividends: $3,959 (reported on 17.3% of returns)
Here:
$3,959
State:
$6,972
(% of AGI for various income ranges: 18.7% for AGIs below $25k, 25.1% for AGIs $25k-50k, 77.4% for AGIs $50k-75k, 99.3% for AGIs $75k-100k, 149.3% for AGIs $100k-200k, 5232.0% for AGIs over 200k)
Net capital gain/loss in AGI: +$10,239 (reported on 16.1% of returns)
Here:
+$10,239
State:
+$20,064
(% of AGI for various income ranges: 3.1% for AGIs below $25k, 28.7% for AGIs $25k-50k, 82.7% for AGIs $50k-75k, 190.1% for AGIs $75k-100k, 412.9% for AGIs $100k-200k, 16982.0% for AGIs over 200k)
Profit/loss from business: +$9,724 (reported on 12.5% of returns)
Here:
+$9,724
State:
+$11,172
(% of AGI for various income ranges: 75.7% for AGIs below $25k, 78.6% for AGIs $25k-50k, 129.9% for AGIs $50k-75k, 231.0% for AGIs $75k-100k, 437.2% for AGIs $100k-200k, 2712.0% for AGIs over 200k)
Taxable individual retirement arrangement distribution: $16,215 (reported on 11.3% of returns)
48879:
$16,215
Michigan:
$19,803
(% of AGI for various income ranges: 75.6% for AGIs below $25k, 130.4% for AGIs $25k-50k, 243.0% for AGIs $50k-75k, 434.9% for AGIs $75k-100k, 593.6% for AGIs $100k-200k, 4162.0% for AGIs over 200k)
Total itemized deductions: $31,261 (reported on 3.6% of returns)
Here:
$31,261
State:
$34,117
(% of AGI for various income ranges: 96.4% for AGIs $25k-50k, 140.3% for AGIs $50k-75k, 196.9% for AGIs $75k-100k, 294.1% for AGIs $100k-200k, 6480.0% for AGIs over 200k)
Charity contributions: $12,738 (reported on 2.9% of returns)
Here:
$12,738
State:
$13,548
(% of AGI for various income ranges: 12.4% for AGIs $25k-50k, 28.3% for AGIs $50k-75k, 41.2% for AGIs $75k-100k, 83.0% for AGIs $100k-200k, 3550.0% for AGIs over 200k)
Taxes paid: $6,915 (reported on 3.6% of returns)
48879:
$6,915
State:
$7,972
(% of AGI for various income ranges: 12.1% for AGIs $25k-50k, 29.8% for AGIs $50k-75k, 53.6% for AGIs $75k-100k, 95.1% for AGIs $100k-200k, 1080.0% for AGIs over 200k)
Earned income credit: $2,061 (reported on 10.3% of returns)
Here:
$2,061
State:
$2,251
(% of AGI for various income ranges: 54.9% for AGIs below $25k, 52.4% for AGIs $25k-50k, 1.1% for AGIs $50k-75k)
Percentage of individuals using paid preparers for their 2020 taxes: 94.8%
Here:
95%
State:
93%
(% for various income ranges: 94.0% for AGIs below $25k, 95.3% for AGIs $25k-50k, 95.0% for AGIs $50k-75k, 94.9% for AGIs $75k-100k, 95.3% for AGIs $100k-200k, 95.0% for AGIs over 200k)
Averages for the 2012 tax year for zip code 48879, filed in 2013:
Average Adjusted Gross Income (AGI) in 2012: $56,614 (Individual Income Tax Returns)
Here:
$56,614
State:
$55,609
Salary/wage: $45,076 (reported on 83.7% of returns)
Here:
$45,076
State:
$46,782
(% of AGI for various income ranges: 69.1% for AGIs below $25k, 69.7% for AGIs $25k-50k, 72.9% for AGIs $50k-75k, 75.2% for AGIs $75k-100k, 77.8% for AGIs $100k-200k, 32.0% for AGIs over 200k)
Taxable interest for individuals: $1,334 (reported on 36.6% of returns)
This zip code:
$1,334
Michigan:
$1,491
(% of AGI for various income ranges: 1.3% for AGIs below $25k, 0.8% for AGIs $25k-50k, 0.6% for AGIs $50k-75k, 0.6% for AGIs $75k-100k, 0.6% for AGIs $100k-200k, 1.5% for AGIs over 200k)
Ordinary dividends: $2,895 (reported on 17.7% of returns)
Here:
$2,895
State:
$6,225
(% of AGI for various income ranges: 1.2% for AGIs below $25k, 0.8% for AGIs $25k-50k, 0.7% for AGIs $50k-75k, 0.6% for AGIs $75k-100k, 0.7% for AGIs $100k-200k, 1.6% for AGIs over 200k)
Net capital gain/loss in AGI: +$5,743 (reported on 14.6% of returns)
Here:
+$5,743
State:
+$9,326
(% of AGI for various income ranges: 0.4% for AGIs $25k-50k, 0.4% for AGIs $50k-75k, 0.9% for AGIs $75k-100k, 1.7% for AGIs $100k-200k, 4.2% for AGIs over 200k)
Profit/loss from business: +$9,319 (reported on 13.5% of returns)
Here:
+$9,319
State:
+$11,523
(% of AGI for various income ranges: 4.3% for AGIs below $25k, 1.9% for AGIs $25k-50k, 1.8% for AGIs $50k-75k, 1.5% for AGIs $75k-100k, 1.7% for AGIs $100k-200k, 3.3% for AGIs over 200k)
Taxable individual retirement arrangement distribution: $12,271 (reported on 10.9% of returns)
48879:
$12,271
Michigan:
$15,298
(% of AGI for various income ranges: 3.6% for AGIs below $25k, 2.7% for AGIs $25k-50k, 2.4% for AGIs $50k-75k, 2.9% for AGIs $75k-100k, 3.0% for AGIs $100k-200k)
Self-employment retirement plans: $24,233 (reported on 0.4% of returns)
48879:
$24,233
Michigan:
$20,834
Total itemized deductions: $19,088 (17% of AGI, reported on 29.8% of returns)
Here:
$19,088
State:
$21,628
Here:
17.2% of AGI
State:
18.4% of AGI
(% of AGI for various income ranges: 6.4% for AGIs below $25k, 9.0% for AGIs $25k-50k, 9.7% for AGIs $50k-75k, 10.8% for AGIs $75k-100k, 12.8% for AGIs $100k-200k, 8.0% for AGIs over 200k)
Charity contributions: $3,012 (reported on 24.7% of returns)
Here:
$3,012
State:
$4,225
(% of AGI for various income ranges: 0.6% for AGIs below $25k, 0.9% for AGIs $25k-50k, 1.2% for AGIs $50k-75k, 1.5% for AGIs $75k-100k, 1.8% for AGIs $100k-200k, 1.2% for AGIs over 200k)
Taxes paid: $7,096 (reported on 29.7% of returns)
48879:
$7,096
State:
$8,327
(% of AGI for various income ranges: 1.3% for AGIs below $25k, 2.3% for AGIs $25k-50k, 3.2% for AGIs $50k-75k, 3.9% for AGIs $75k-100k, 5.3% for AGIs $100k-200k, 4.0% for AGIs over 200k)
Earned income credit: $2,107 (reported on 13.2% of returns)
Here:
$2,107
State:
$2,306
(% of AGI for various income ranges: 4.6% for AGIs below $25k, 0.9% for AGIs $25k-50k)
Percentage of individuals using paid preparers for their 2012 taxes: 59.8%
Here:
60%
State:
57%
(% for various income ranges: 53.3% for AGIs below $25k, 62.2% for AGIs $25k-50k, 65.1% for AGIs $50k-75k, 63.8% for AGIs $75k-100k, 63.3% for AGIs $100k-200k, 81.8% for AGIs over 200k)
Averages for the 2004 tax year for zip code 48879, filed in 2005:
Average Adjusted Gross Income (AGI) in 2004: $43,346 (Individual Income Tax Returns)
Here:
$43,346
State:
$48,204
Salary/wage: $40,113 (reported on 86.7% of returns)
Here:
$40,113
State:
$42,791
(% of AGI for various income ranges: 105.0% for AGIs below $10k, 68.8% for AGIs $10k-25k, 77.8% for AGIs $25k-50k, 83.4% for AGIs $50k-75k, 87.9% for AGIs $75k-100k, 74.4% for AGIs over 100k)
Taxable interest for individuals: $1,277 (reported on 49.4% of returns)
This zip code:
$1,277
Michigan:
$1,725
(% of AGI for various income ranges: 5.3% for AGIs below $10k, 2.9% for AGIs $10k-25k, 1.7% for AGIs $25k-50k, 0.9% for AGIs $50k-75k, 0.9% for AGIs $75k-100k, 1.5% for AGIs over 100k)
Taxable dividends: $1,481 (reported on 23.0% of returns)
Here:
$1,481
State:
$3,420
(% of AGI for various income ranges: 2.4% for AGIs below $10k, 1.4% for AGIs $10k-25k, 0.7% for AGIs $25k-50k, 0.5% for AGIs $50k-75k, 0.5% for AGIs $75k-100k, 1.1% for AGIs over 100k)
Net capital gain/loss: +$4,224 (reported on 16.9% of returns)
Here:
+$4,224
State:
+$8,532
(% of AGI for various income ranges: 1.2% for AGIs below $10k, 0.6% for AGIs $10k-25k, 0.8% for AGIs $25k-50k, 0.7% for AGIs $50k-75k, 1.0% for AGIs $75k-100k, 4.2% for AGIs over 100k)
Profit/loss from business: +$7,372 (reported on 14.7% of returns)
Here:
+$7,372
State:
+$9,547
(% of AGI for various income ranges: 5.6% for AGIs below $10k, 3.6% for AGIs $10k-25k, 2.4% for AGIs $25k-50k, 2.1% for AGIs $50k-75k, 1.0% for AGIs $75k-100k, 3.7% for AGIs over 100k)
IRA payment deduction: $3,006 (reported on 1.9% of returns)
48879:
$3,006
Michigan:
$2,875
(% of AGI for various income ranges: 0.2% for AGIs $10k-25k, 0.2% for AGIs $25k-50k, 0.2% for AGIs $50k-75k, 0.1% for AGIs $75k-100k, 0.1% for AGIs over 100k)
Self-employed pension: $9,188 (reported on 0.6% of returns)
Here:
$9,188
Michigan:
$13,826
(% of AGI for various income ranges: 0.1% for AGIs $50k-75k, 0.1% for AGIs $75k-100k, 0.3% for AGIs over 100k)
Total itemized deductions: $15,597 (21% of AGI, reported on 36.6% of returns)
Here:
$15,597
State:
$18,509
Here:
21.4% of AGI
State:
20.7% of AGI
(% of AGI for various income ranges: 11.9% for AGIs below $10k, 9.3% for AGIs $10k-25k, 11.5% for AGIs $25k-50k, 13.4% for AGIs $50k-75k, 14.9% for AGIs $75k-100k, 14.1% for AGIs over 100k)
Charity contributions deductions: $2,325 (3% of AGI, reported on 31.9% of returns)
Here:
$2,325
State:
$3,365
Here:
3.1% of AGI
State:
3.6% of AGI
(% of AGI for various income ranges: 0.6% for AGIs below $10k, 1.0% for AGIs $10k-25k, 1.2% for AGIs $25k-50k, 1.6% for AGIs $50k-75k, 1.9% for AGIs $75k-100k, 2.3% for AGIs over 100k)
Total tax: $5,344 (reported on 77.8% of returns)
48879:
$5,344
State:
$7,691
(% of AGI for various income ranges: 2.9% for AGIs below $10k, 4.3% for AGIs $10k-25k, 6.9% for AGIs $25k-50k, 8.1% for AGIs $50k-75k, 9.5% for AGIs $75k-100k, 15.5% for AGIs over 100k)
Earned income credit: $1,558 (reported on 9.3% of returns)
Here:
$1,558
State:
$1,737
Percentage of individuals using paid preparers for their 2004 taxes: 60.0%
Here:
60%
State:
60%
(% for various income ranges: 50.5% for AGIs below $10k, 61.9% for AGIs $10k-25k, 61.2% for AGIs $25k-50k, 63.6% for AGIs $50k-75k, 61.7% for AGIs $75k-100k, 66.5% for AGIs over 100k)
Likely homosexual households (counted as self-reported same-sex unmarried-partner households)
Lesbian couples: 0.1% of all households
Gay men: 0.1% of all households
Household received Food Stamps/SNAP in the past 12 months: 703 Household did not receive Food Stamps/SNAP in the past 12 months: 6,388
Women who had a birth in the past 12 months: 154 (120 now married, 35 unmarried) Women who did not have a birth in the past 12 months: 3,568 (1,674 now married, 1,888 unmarried)
Housing units in zip code 48879 with a mortgage: 3,488 (346 second mortgage, 4 home equity loan, 339 both second mortgage and home equity loan) Houses without a mortgage: 161
Median monthly owner costs for units with a mortgage: $1,391 Median monthly owner costs for units without a mortgage: $592
Residents with income below the poverty level in 2022:
This zip code:
11.5%
Whole state:
13.4%
Residents with income below 50% of the poverty level in 2022:
This zip code:
4.3%
Whole state:
6.9%
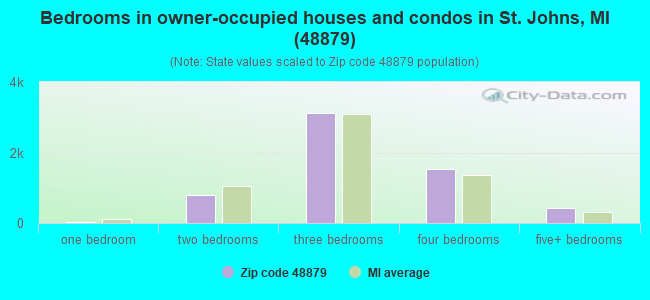
Median number of rooms in houses and condos:
Here:
7.0
State:
6.5
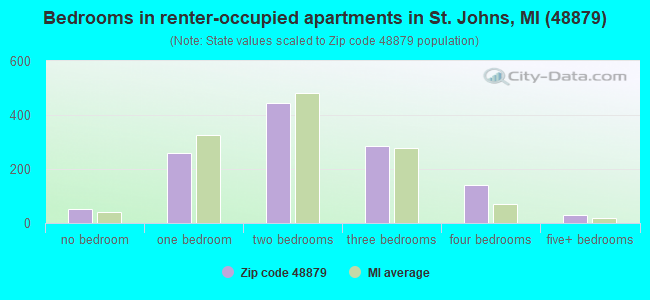
Median number of rooms in apartments:
Here:
4.6
State:
4.3
Notable locations in this zip code not listed on our city pages
Churches in zip code 48879 include: Greenbush Church (A), Grove Bible Church (B), South Bingham Church (C), Salem Church (D), Bengal Church (E), Lowe Church (F), Saint Joseph Catholic Church (G), Price United Methodist Church (H), Jehovah's Witnesses (I). Display/hide their locations on the map
Cemeteries: Duplain Cemetery (1), Danley Cemetery (2), Eureka Cemetery (3), Union Home Cemetery (4), Prairie Cemetery (5), Stoll Cemetery (6), Stilson Cemetery (7). Display/hide their locations on the map
Lakes and reservoirs: Richmond Lake (A), Mud Lake (B), Montague Lake (C), Curtis Lake (D), Cedar Lake (E), Lake Ovid (F). Display/hide their locations on the map
Streams, rivers, and creeks: Bad Creek (A), Hamilton Drain (B), Holden Drain (C), Spaulding Drain (D), South Fork Hayworth Creek (E), Kneeland Branch (F), Kniffin Drain (G), Lapham Branch (H), Doty Brook (I). Display/hide their locations on the map
Parks in zip code 48879 include: Sleepy Hollow State Park (1), Saint John's Church Historical Marker (2), Paine-Gillam-Scott House Historical Marker (3), Greenbush United Methodist Church Historical Marker (4), Rochester Colony Historical Marker (5). Display/hide their locations on the map
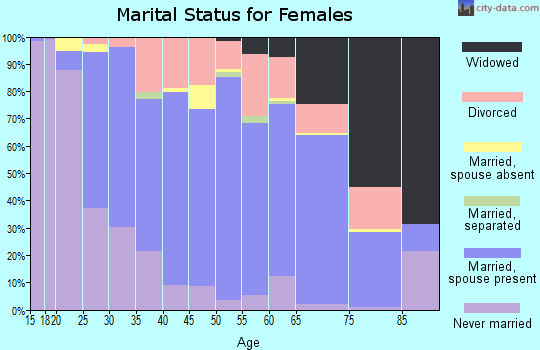
2,442 married couples with children.
1,447 single-parent households (215 men, 1,232 women).
98.0% of residents of 48879 zip code speak English at home.
0.8% of residents speak Spanish at home (66% very well, 14% well, 15% not well, 5% not at all).
0.7% of residents speak other Indo-European language at home (86% very well, 10% well, 4% not well).
0.2% of residents speak Asian or Pacific Island language at home (79% very well, 21% well).
0.1% of residents speak other language at home (100% very well).
Foreign born population: 177 (1.0%) (78.6% of them are naturalized citizens)
This zip code:
1.0%
Whole state:
6.9%
20%Romania
10%France
9%Honduras
7%Malaysia
7%Bhutan
5%Sweden
4%United Kingdom, excluding England and Scotland
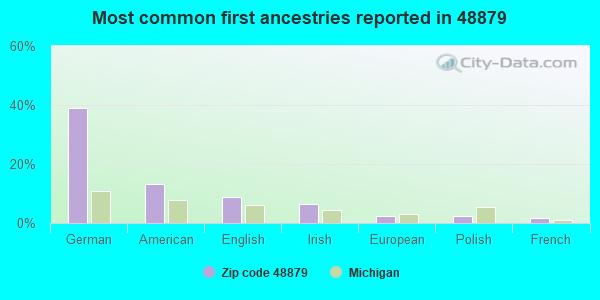
39%German
13%American
9%English
7%Irish
3%European
2%Polish
2%French
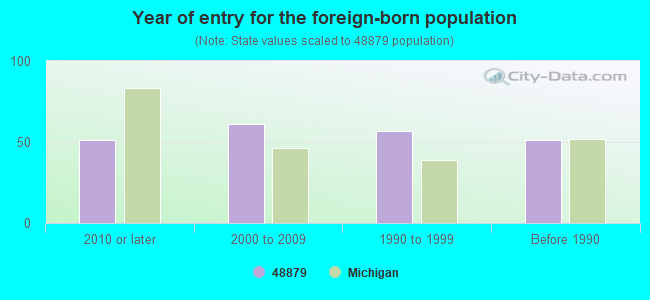
Year of entry for the foreign-born population
512010 or later
612000 to 2009
571990 to 1999
51Before 1990
Major facilities with environmental interests located in this zip code:
FEDERAL MOGUL CORP (310 STEEL STREET in SAINT JOHNS, MI)
AIR SYNTHETIC MINOR (AIRS/AFS) COMPLIANCE ACTIVITY (Tracking inspections of insecticide, fungicide, and rodenticide, and toxic substances) CRITERIA AND HAZARDOUS AIR POLLUTANT INVENTORY (Inventory of air pollution sources) HAZARDOUS WASTE BIENNIAL REPORTER (Resource Conservation and Recovery Act (tracking hazardous waste)) Large Quantity Generators, more that 1000 kg of hazardous waste/month (Resource Conservation and Recovery Act (tracking hazardous waste)) TRI REPORTER (Tracking of toxic chemicals releasing facilities) Business SIC classification: MOTOR VEHICLE PARTS AND ACCESSORIES Business NAICS classification: GASOLINE ENGINE AND ENGINE PARTS MANUFACTURING. Organizations: FEDERAL-MOGUL CORP (CONTACT/OPERATOR)
EAST ESSEX SCHOOL (5531 W. LOWE ROAD in ST. JOHNS, MI)
(Geographic Names Information System) (National Center for Education Statistics) - STATE ID-01010 Organizations: ST. JOHNS PUBLIC SCHOOLS (SCHOOL DISTRICT)
GATEWAY ELEMENTARY SCHOOL (915 N. LANSING STREET in ST. JOHNS, MI)
(National Center for Education Statistics) - STATE ID-03009 Organizations: ST. JOHNS PUBLIC SCHOOLS (SCHOOL DISTRICT)
EAST OLIVE ELEMENTARY SCHOOL (2583 E. GREEN ROAD in ST. JOHNS, MI)
(National Center for Education Statistics) - STATE ID-05709 Organizations: ST. JOHNS PUBLIC SCHOOLS (SCHOOL DISTRICT)
APPLEBEE OIL CO (603 E STEEL ST in SAINT JOHNS, MI)
(Resource Conservation and Recovery Act (tracking hazardous waste)) Business NAICS classification: HEATING OIL DEALERS.
BECKS DEVELOPMENT COMPANY (2121 W HYDE RD in ST. JOHNS, MI)
National Pollutant Discharge Elimination System NON-MAJOR (Tracking pollutant discharge elimination systems) - permit Business SIC classification: EATING PLACES
MI DEPT/TRANSPORTATION BRIDGE (2250 E TOWNSEND in SAINT JOHNS, MI)
(Resource Conservation and Recovery Act (tracking hazardous waste)) Organizations: MICH DEPT OF TRANSPORTATION (CONTACT/OPERATOR)
Alternative names: MIDOT ST JOHNS
Housing units lacking complete plumbing facilities: 0.6% Housing units lacking complete kitchen facilities: 0.5%
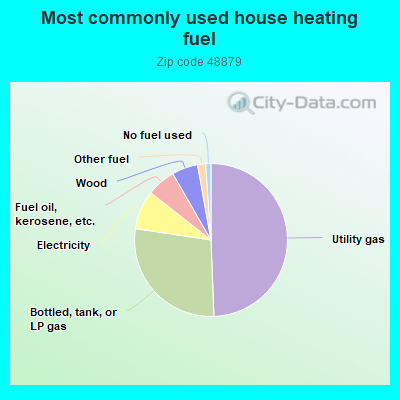
49.4%Utility gas
28.0%Bottled, tank, or LP gas
8.2%Electricity
6.1%Fuel oil, kerosene, etc.
5.5%Wood
1.7%Other fuel
1.1%No fuel used
Population in 1990: 16,472. Population change in the 1990s: +721 (+4.4%).
Place of birth for U.S.-born residents:
This state: 16,508
Northeast: 159
Midwest: 850
South: 571
West: 210
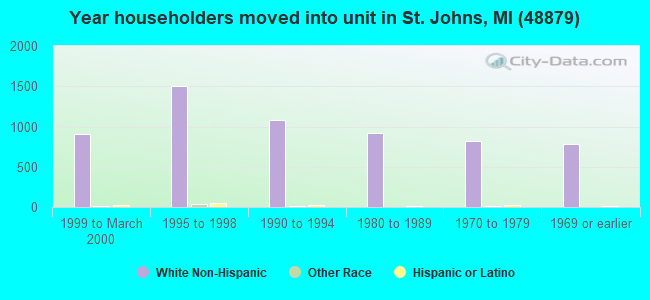
62% of the 48879 zip code residents lived in the same house 5 years ago. Out of people who lived in different houses, 63% lived in this county. Out of people who lived in different counties, 50% lived in Michigan.
92% of the 48879 zip code residents lived in the same house 1 year ago. Out of people who lived in different houses, 48% moved from this county. Out of people who lived in different houses, 37% moved from different county within same state. Out of people who lived in different houses, 15% moved from different state. Out of people who lived in different houses, 1% moved from abroad.
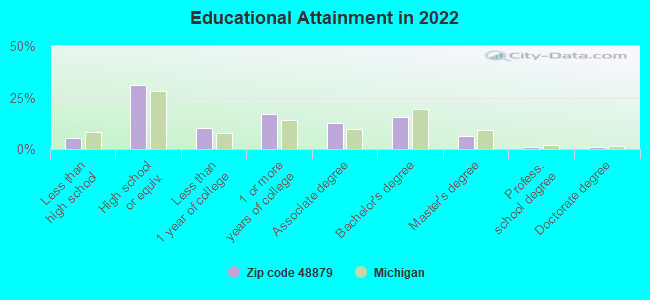
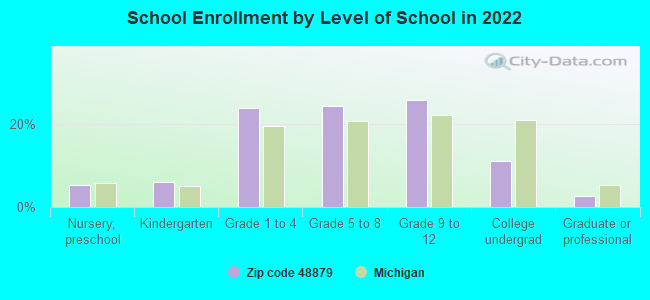
Private vs. public school enrollment:
Students in private schools in grades 1 to 8 (elementary and middle school): 269
Here:
13.1%
Michigan:
12.4%
Students in private schools in grades 9 to 12 (high school): 71
Here:
6.5%
Michigan:
9.8%
Students in private undergraduate colleges: 43
Here:
9.0%
Michigan:
14.9%
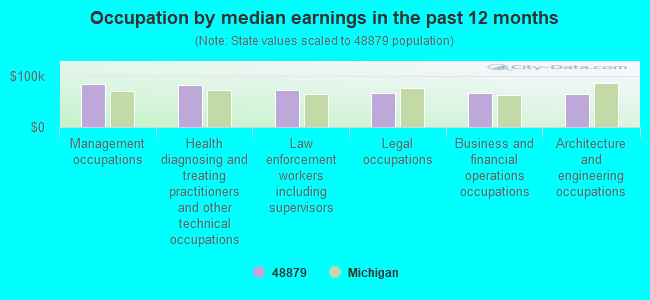
Occupation by median earnings in the past 12 months ($)
84,168Management occupations
83,114Health diagnosing and treating practitioners and other technical occupations
72,523Law enforcement workers including supervisors
67,092Legal occupations
66,585Business and financial operations occupations
64,552Architecture and engineering occupations
Companies with federal contracts located in this zip code:
SAYLOR-BEALL MANUFACTURING COM (400 N KIBBEE ST in SAINT JOHNS, MI; small business) : $10,878 in 3 contractsfrom 2003 to 2005
$3,666 with Indian Affairs (Assistant Secretary) for Generators and Generators Sets, Electrical. Taking place in MT. Signed on 2004-07-13. Completion date: 2004-08-01.
$3,659 with Navy for Non-nuclear Ship Repair (West) Ship repair (including overhauls and conversions) performed on. non-nuclear propelled and nonpropelled ships west of the 108th meridian. Signed on 2005-11-08. Completion date: 2005-11-18.
$3,553 with Army for Compressors and Vacuum Pumps. Signed on 2003-07-03. Completion date: 2003-07-08.
LOMA INDUSTRIES INCORPORATED (4117 W TOWNSEND ROAD in SAINT JOHNS, MI; small business)
$4,000 with Navy for Signs, Advertising Displays, and Identification Plates. Signed on 2004-09-28. Completion date: 2004-10-08.
Top industries in this zip code by the number of employees in 2005:
Health Care and Social Assistance: General Medical and Surgical Hospitals (250-499 employees: 1 establishment)
2002 - 2018 National Fire Incident Reporting System (NFIRS) incidents
Based on the data from the years 2002 - 2018 the average number of fire incidents per year is 45. The highest number of fire incidents - 75 took place in 2003, and the least - 9 in 2004. The data has a constant trend.
When looking into fire subcategories, the most reports belonged to: Structure Fires (46.1%), and Outside Fires (32.4%).
Fire incident types reported to NFIRS in Zip Code 48879
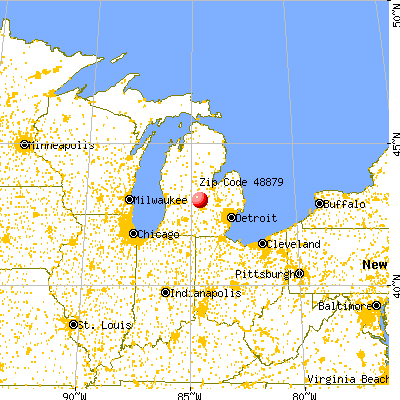


 Nearest zip codes: 48820, 48853, 48835, 48871, 48874, 48806.
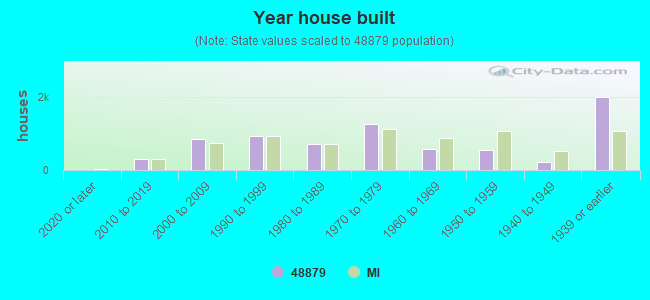


 Based on the data from the years 2002 - 2018 the average number of fire incidents per year is 45. The highest number of fire incidents - 75 took place in 2003, and the least - 9 in 2004. The data has a constant trend.
 When looking into fire subcategories, the most reports belonged to: Structure Fires (46.1%), and Outside Fires (32.4%).