Estimated zip code population in 2022: 1,430 Zip code population in 2010: 1,525 Zip code population in 2000: 1,442
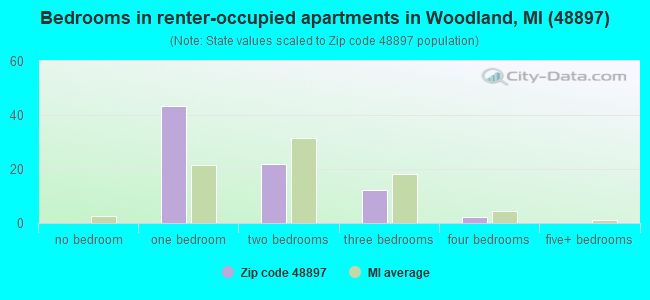
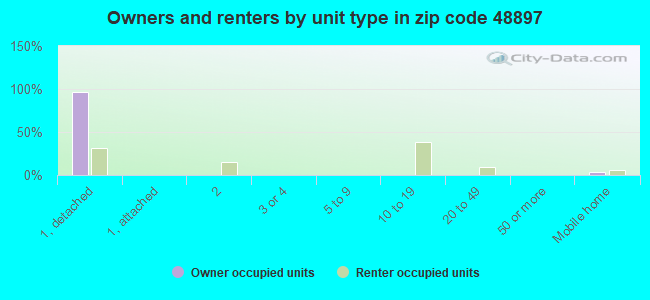
Houses and condos: 628 Renter-occupied apartments: 78
% of renters here:
13%
State:
27%
March 2022 cost of living index in zip code 48897: 80.3 (low, U.S. average is 100)
Land area: 32.5 sq. mi. Water area: 0.2 sq. mi.
Population density: 44 people per square mile
(very low).
OSM Map
General Map
Google Map
MSN Map
OSM Map
General Map
Google Map
MSN Map
OSM Map
General Map
Google Map
MSN Map
OSM Map
General Map
Google Map
MSN Map
Please wait while loading the map...
Real estate property taxes paid for housing units in 2022:
This zip code:
1.1% ($2,338)
Michigan:
1.2% ($2,746)
Median real estate property taxes paid for housing units with mortgages in 2022: $2,519 (1.1%) Median real estate property taxes paid for housing units with no mortgage in 2022: $2,141 (1.2%)
Business Search- 14 Million verified businesses
Males: 747
(52.3%)
Females: 682
(47.7%)
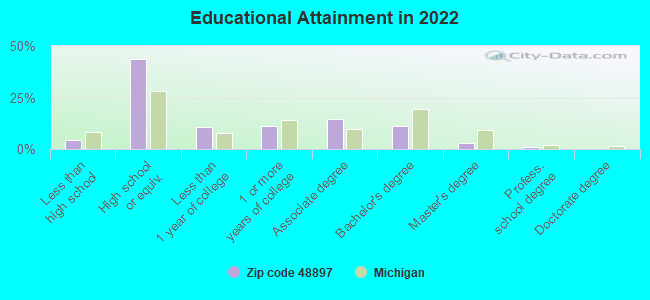
For population 25 years and over in 48897:
High school or higher: 94.8%
Bachelor's degree or higher: 15.5%
Graduate or professional degree: 4.2%
Unemployed: 4.5%
Mean travel time to work (commute): 25.3 minutes
For population 15 years and over in 48897:
Never married: 15.1%
Now married: 68.2%
Separated: 1.0%
Widowed: 6.1%
Divorced: 9.5%
Zip code 48897 compared to state average:
Black race population percentage significantly below state average.
Foreign-born population percentage significantly below state average.
Renting percentage below state average.
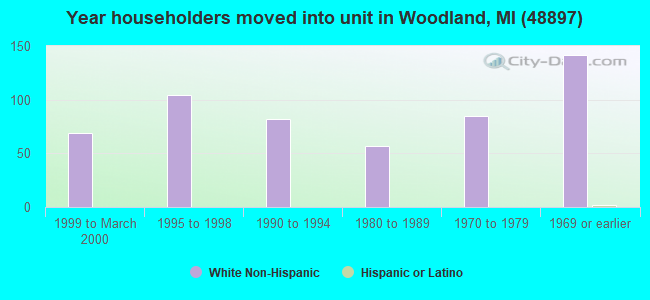
Length of stay since moving in significantly above state average.
House age above state average.
Number of college students below state average.
Percentage of population with a bachelor's degree or higher below state average.
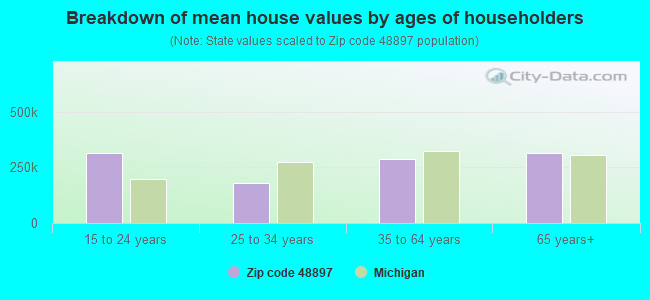
Estimated median house/condo value in 2022: $214,915
48897:
$214,915
Michigan:
$224,400
According to our research of Michigan and other state lists, there were 5 registered sex offenders living in 48897 zip code as of May 28, 2024. The ratio of all residents to sex offenders in zip code 48897 is 302 to 1. The ratio of registered sex offenders to all residents in this zip code is near the state average.
Median resident age:
This zip code:
42.5 years
Michigan median age:
40.3 years
Average household size:
This zip code:
2.4 people
Michigan:
2.4 people
Averages for the 2020 tax year for zip code 48897, filed in 2021:
Average Adjusted Gross Income (AGI) in 2020: $55,372 (Individual Income Tax Returns)
Here:
$55,372
State:
$68,945
Salary/wage: $49,698 (reported on 79.2% of returns)
Here:
$49,698
State:
$57,142
(% of AGI for various income ranges: 1120.8% for AGIs below $25k, 3475.7% for AGIs $25k-50k, 6735.6% for AGIs $50k-75k, 8346.7% for AGIs $75k-100k, 18225.0% for AGIs $100k-200k)
Taxable interest for individuals: $504 (reported on 31.9% of returns)
This zip code:
$504
Michigan:
$1,630
(% of AGI for various income ranges: 31.5% for AGIs below $25k, 19.3% for AGIs $25k-50k, 22.2% for AGIs $50k-75k, 18.3% for AGIs $75k-100k, 28.3% for AGIs $100k-200k)
Ordinary dividends: $1,230 (reported on 13.9% of returns)
Here:
$1,230
State:
$6,972
(% of AGI for various income ranges: 9.2% for AGIs below $25k, 49.3% for AGIs $25k-50k, 15.6% for AGIs $50k-75k, 46.7% for AGIs $100k-200k)
Net capital gain/loss in AGI: +$9,489 (reported on 12.5% of returns)
Here:
+$9,489
State:
+$20,064
(% of AGI for various income ranges: 9.2% for AGIs below $25k, 70.7% for AGIs $25k-50k, 57.8% for AGIs $50k-75k, 1151.7% for AGIs $100k-200k)
Profit/loss from business: +$7,989 (reported on 12.5% of returns)
Here:
+$7,989
State:
+$11,172
(% of AGI for various income ranges: 84.6% for AGIs below $25k, 217.1% for AGIs $25k-50k, 508.3% for AGIs $75k-100k)
Taxable individual retirement arrangement distribution: $14,650 (reported on 13.9% of returns)
48897:
$14,650
Michigan:
$19,803
(% of AGI for various income ranges: 100.0% for AGIs below $25k, 309.3% for AGIs $25k-50k, 1503.3% for AGIs $75k-100k)
Earned income credit: $2,543 (reported on 9.7% of returns)
Here:
$2,543
State:
$2,251
(% of AGI for various income ranges: 77.7% for AGIs below $25k, 55.0% for AGIs $25k-50k)
Percentage of individuals using paid preparers for their 2020 taxes: 94.4%
Here:
94%
State:
93%
(% for various income ranges: 95.2% for AGIs below $25k, 90.0% for AGIs $25k-50k, 92.3% for AGIs $50k-75k, 100.0% for AGIs $75k-100k, 100.0% for AGIs $100k-200k)
Averages for the 2012 tax year for zip code 48897, filed in 2013:
Average Adjusted Gross Income (AGI) in 2012: $47,884 (Individual Income Tax Returns)
Here:
$47,884
State:
$55,609
Salary/wage: $41,495 (reported on 81.2% of returns)
Here:
$41,495
State:
$46,782
(% of AGI for various income ranges: 59.8% for AGIs below $25k, 70.2% for AGIs $25k-50k, 73.4% for AGIs $50k-75k, 81.1% for AGIs $75k-100k, 65.2% for AGIs $100k-200k)
Taxable interest for individuals: $582 (reported on 31.9% of returns)
This zip code:
$582
Michigan:
$1,491
(% of AGI for various income ranges: 0.9% for AGIs below $25k, 0.5% for AGIs $25k-50k, 0.5% for AGIs $50k-75k, 0.2% for AGIs $75k-100k, 0.2% for AGIs $100k-200k)
Ordinary dividends: $1,225 (reported on 11.6% of returns)
Here:
$1,225
State:
$6,225
(% of AGI for various income ranges: 0.4% for AGIs below $25k, 0.6% for AGIs $25k-50k, 0.7% for AGIs $75k-100k)
Net capital gain/loss in AGI: +$6,471 (reported on 10.1% of returns)
Here:
+$6,471
State:
+$9,326
Profit/loss from business: +$2,850 (reported on 14.5% of returns)
Here:
+$2,850
State:
+$11,523
(% of AGI for various income ranges: 4.8% for AGIs below $25k, 1.3% for AGIs $25k-50k, 0.8% for AGIs $50k-75k)
Taxable individual retirement arrangement distribution: $8,543 (reported on 10.1% of returns)
48897:
$8,543
Michigan:
$15,298
(% of AGI for various income ranges: 2.5% for AGIs below $25k, 3.5% for AGIs $25k-50k, 4.3% for AGIs $50k-75k)
Total itemized deductions: $17,459 (19% of AGI, reported on 24.6% of returns)
Here:
$17,459
State:
$21,628
Here:
19.2% of AGI
State:
18.4% of AGI
(% of AGI for various income ranges: 8.7% for AGIs $25k-50k, 8.7% for AGIs $50k-75k, 10.4% for AGIs $75k-100k, 11.0% for AGIs $100k-200k)
Charity contributions: $4,175 (reported on 17.4% of returns)
Here:
$4,175
State:
$4,225
(% of AGI for various income ranges: 1.9% for AGIs $50k-75k, 1.9% for AGIs $75k-100k, 2.4% for AGIs $100k-200k)
Taxes paid: $5,924 (reported on 24.6% of returns)
48897:
$5,924
State:
$8,327
(% of AGI for various income ranges: 1.7% for AGIs $25k-50k, 2.7% for AGIs $50k-75k, 3.7% for AGIs $75k-100k, 4.6% for AGIs $100k-200k)
Earned income credit: $2,489 (reported on 13.0% of returns)
Here:
$2,489
State:
$2,306
(% of AGI for various income ranges: 5.2% for AGIs below $25k, 1.0% for AGIs $25k-50k)
Percentage of individuals using paid preparers for their 2012 taxes: 58.0%
Here:
58%
State:
57%
(% for various income ranges: 52.0% for AGIs below $25k, 63.2% for AGIs $25k-50k, 54.5% for AGIs $50k-75k, 71.4% for AGIs $75k-100k, 57.1% for AGIs $100k-200k)
Averages for the 2004 tax year for zip code 48897, filed in 2005:
Average Adjusted Gross Income (AGI) in 2004: $38,419 (Individual Income Tax Returns)
Here:
$38,419
State:
$48,204
Salary/wage: $35,343 (reported on 84.1% of returns)
Here:
$35,343
State:
$42,791
(% of AGI for various income ranges: 83.8% for AGIs below $10k, 60.2% for AGIs $10k-25k, 72.7% for AGIs $25k-50k, 83.7% for AGIs $50k-75k, 85.6% for AGIs $75k-100k, 72.9% for AGIs over 100k)
Taxable interest for individuals: $966 (reported on 46.8% of returns)
This zip code:
$966
Michigan:
$1,725
(% of AGI for various income ranges: 5.2% for AGIs below $10k, 3.4% for AGIs $10k-25k, 1.5% for AGIs $25k-50k, 0.7% for AGIs $50k-75k, 0.1% for AGIs $75k-100k, 0.6% for AGIs over 100k)
Taxable dividends: $922 (reported on 18.7% of returns)
Here:
$922
State:
$3,420
(% of AGI for various income ranges: 2.4% for AGIs below $10k, 1.3% for AGIs $10k-25k, 0.3% for AGIs $25k-50k, 0.3% for AGIs $50k-75k, 0.2% for AGIs $75k-100k, 0.4% for AGIs over 100k)
Net capital gain/loss: +$569 (reported on 15.8% of returns)
Here:
+$569
State:
+$8,532
(% of AGI for various income ranges: -3.3% for AGIs below $10k, 0.8% for AGIs $10k-25k, 0.9% for AGIs $25k-50k, 0.1% for AGIs $50k-75k, -0.2% for AGIs $75k-100k)
Profit/loss from business: +$5,365 (reported on 16.7% of returns)
Here:
+$5,365
State:
+$9,547
(% of AGI for various income ranges: 5.6% for AGIs $10k-25k, 3.1% for AGIs $25k-50k, 1.5% for AGIs $50k-75k, 3.2% for AGIs $75k-100k)
Total itemized deductions: $14,711 (24% of AGI, reported on 33.0% of returns)
Here:
$14,711
State:
$18,509
Here:
23.7% of AGI
State:
20.7% of AGI
(% of AGI for various income ranges: 11.6% for AGIs $10k-25k, 12.4% for AGIs $25k-50k, 12.1% for AGIs $50k-75k, 14.4% for AGIs $75k-100k, 15.3% for AGIs over 100k)
Charity contributions deductions: $3,177 (5% of AGI, reported on 27.0% of returns)
Here:
$3,177
State:
$3,365
Here:
4.8% of AGI
State:
3.6% of AGI
(% of AGI for various income ranges: 1.8% for AGIs $10k-25k, 1.9% for AGIs $25k-50k, 2.1% for AGIs $50k-75k, 2.2% for AGIs $75k-100k, 3.9% for AGIs over 100k)
Total tax: $4,009 (reported on 78.3% of returns)
48897:
$4,009
State:
$7,691
(% of AGI for various income ranges: 2.4% for AGIs below $10k, 3.7% for AGIs $10k-25k, 6.3% for AGIs $25k-50k, 8.0% for AGIs $50k-75k, 9.6% for AGIs $75k-100k, 14.6% for AGIs over 100k)
Earned income credit: $1,616 (reported on 10.6% of returns)
Here:
$1,616
State:
$1,737
Percentage of individuals using paid preparers for their 2004 taxes: 57.8%
Here:
58%
State:
60%
(% for various income ranges: 40.5% for AGIs below $10k, 61.1% for AGIs $10k-25k, 65.2% for AGIs $25k-50k, 59.7% for AGIs $50k-75k, 52.2% for AGIs $75k-100k, 69.2% for AGIs over 100k)
Household received Food Stamps/SNAP in the past 12 months: 44 Household did not receive Food Stamps/SNAP in the past 12 months: 554
Women who had a birth in the past 12 months: 13 (7 now married, 5 unmarried) Women who did not have a birth in the past 12 months: 276 (214 now married, 60 unmarried)
Housing units in zip code 48897 with a mortgage: 304 (72 second mortgage, 75 both second mortgage and home equity loan) Houses without a mortgage: 5
Median monthly owner costs for units with a mortgage: $1,523 Median monthly owner costs for units without a mortgage: $502
Residents with income below the poverty level in 2022:
This zip code:
8.8%
Whole state:
13.4%
Residents with income below 50% of the poverty level in 2022:
This zip code:
4.0%
Whole state:
6.9%
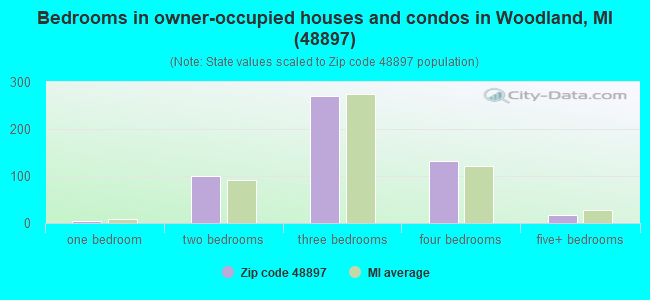
Median number of rooms in houses and condos:
Here:
6.6
State:
6.5
Median number of rooms in apartments:
Here:
3.4
State:
4.3
Notable locations in this zip code not listed on our city pages
Churches in zip code 48897 include: Free Church (A), Stoney Point Church (B), Kilpatrick Church (C), Brethren Church (D), Woodland United Methodist Church (E). Display/hide their locations on the map
Size of family households: 208 2-persons, 78 3-persons, 109 4-persons, 23 5-persons, 2 6-persons
Size of nonfamily households: 166 1-person, 10 2-persons
322 married couples with children.
27 single-parent households (7 men, 20 women).
98.8% of residents of 48897 zip code speak English at home.
0.4% of residents speak other Indo-European language at home (100% very well).
0.1% of residents speak Asian or Pacific Island language at home (100% very well).
0.1% of residents speak other language at home (100% very well).
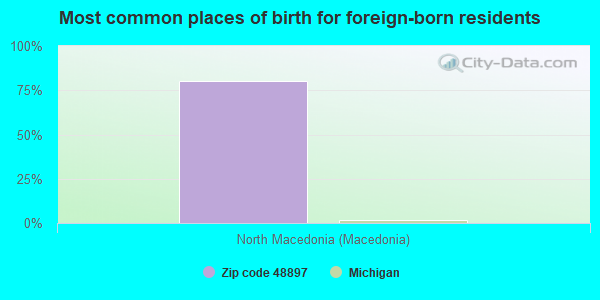
Foreign born population: 5 (0.4%) (100.0% of them are naturalized citizens)
This zip code:
0.4%
Whole state:
6.9%
80%North Macedonia (Macedonia)
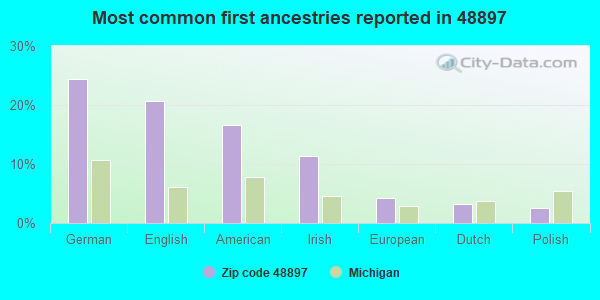
24%German
21%English
17%American
11%Irish
4%European
3%Dutch
2%Polish
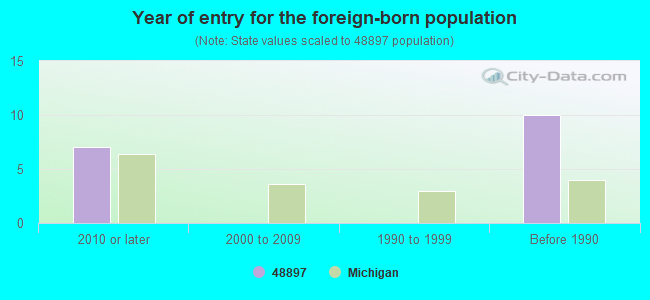
Year of entry for the foreign-born population
72010 or later
02000 to 2009
01990 to 1999
10Before 1990
Facilities with environmental interests located in this zip code:
MI DEPT/STATE POLICE (T04N R07W WOODLAND TWP SEC 3 in WOODLAND, MI)
(Resource Conservation and Recovery Act (tracking hazardous waste))
Housing units lacking complete plumbing facilities: 0.3%
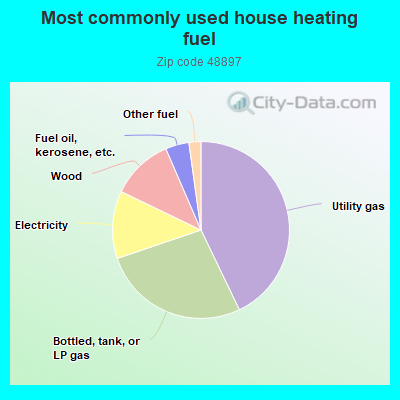
43.0%Utility gas
27.0%Bottled, tank, or LP gas
12.4%Electricity
11.4%Wood
4.3%Fuel oil, kerosene, etc.
2.2%Other fuel
Population in 1990: 1,405. Population change in the 1990s: +37 (+2.6%).
Place of birth for U.S.-born residents:
This state: 1,247
Northeast: 7
Midwest: 127
South: 16
West: 11
67% of the 48897 zip code residents lived in the same house 5 years ago. Out of people who lived in different houses, 19% lived in this county. Out of people who lived in different counties, 50% lived in Michigan.
95% of the 48897 zip code residents lived in the same house 1 year ago. Out of people who lived in different houses, 38% moved from this county. Out of people who lived in different houses, 53% moved from different county within same state. Out of people who lived in different houses, 11% moved from abroad.
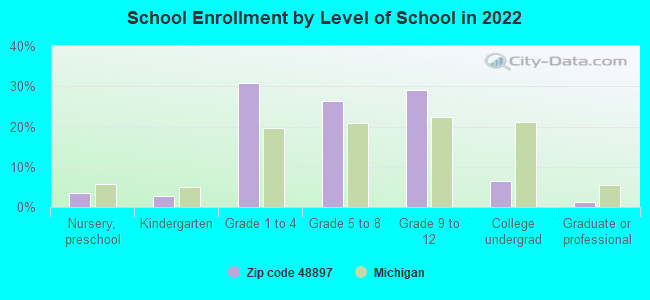
Private vs. public school enrollment:
Students in private schools in grades 1 to 8 (elementary and middle school): 11
Here:
6.7%
Michigan:
12.4%
Students in private schools in grades 9 to 12 (high school): 8
Here:
10.3%
Michigan:
9.8%
Students in private undergraduate colleges: 5
Here:
28.4%
Michigan:
14.9%
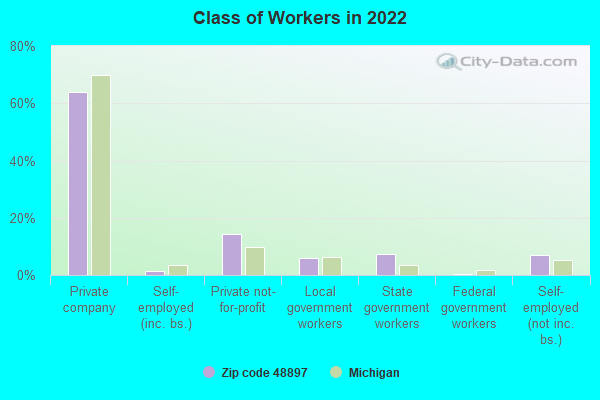
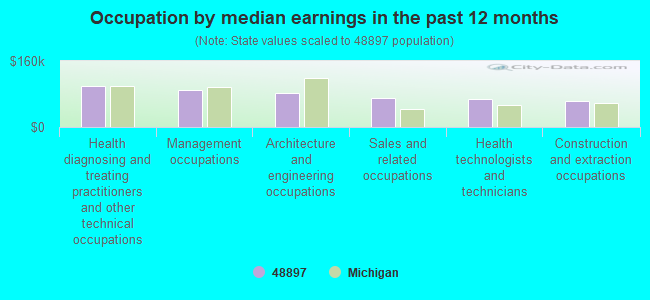
Occupation by median earnings in the past 12 months ($)
98,876Health diagnosing and treating practitioners and other technical occupations
90,409Management occupations
82,824Architecture and engineering occupations
69,763Sales and related occupations
67,792Health technologists and technicians
63,385Construction and extraction occupations
Top industries in this zip code by the number of employees in 2005:
Other Services (except Public Administration): Automotive Body, Paint, and Interior Repair and Maintenance (5-9 employees: 1 establishment)
Other Services (except Public Administration): Religious Organizations (1-4: 2)
Other Services (except Public Administration): Civic and Social Organizations (1-4: 1)
Construction: Site Preparation Contractors (1-4: 1)
Educational Services: Professional and Management Development Training (1-4: 1)
Health Care and Social Assistance: Ambulance Services (1-4: 1)
Construction: Flooring Contractors (1-4: 1)
Wholesale Trade: Recyclable Material Merchant Wholesalers (1-4: 1)
Finance and Insurance: Real Estate Credit (1-4: 1)
Fatal accident statistics in 2010:
Fatal accident count: 1
Vehicles involved in fatal accidents: 2
Fatal accidents caused by drunken drivers: 0
Fatalities: 1
Persons involved in fatal accidents: 2
Pedestrians involved in fatal accidents: 0
Home Mortgage Disclosure Act Aggregated Statistics For Year 2009 (Based on 2 partial tracts)
A) FHA, FSA/RHS & VA Home Purchase Loans
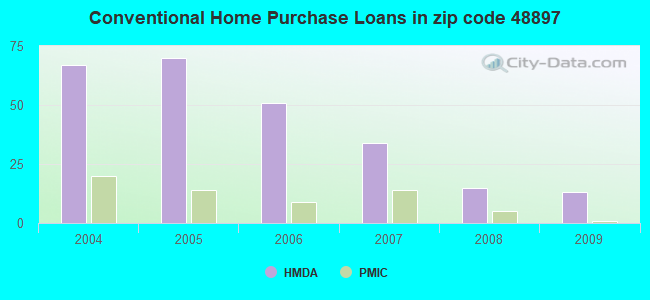
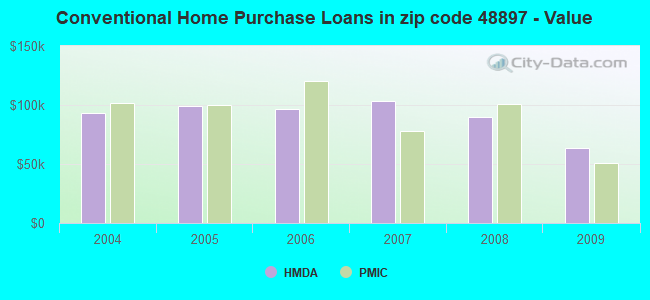
B) Conventional Home Purchase Loans
C) Refinancings
D) Home Improvement Loans
F) Non-occupant Loans on < 5 Family Dwellings (A B C & D)
G) Loans On Manufactured Home Dwelling (A B C & D)
Number
Average Value
Number
Average Value
Number
Average Value
Number
Average Value
Number
Average Value
Number
Average Value
LOANS ORIGINATED
8
$58,001
13
$63,658
78
$108,412
14
$18,426
7
$75,289
3
$28,663
APPLICATIONS APPROVED, NOT ACCEPTED
0
$0
1
$44,270
6
$106,850
1
$7,660
3
$99,613
3
$72,937
APPLICATIONS DENIED
3
$62,437
2
$190,715
39
$108,783
5
$27,756
2
$77,475
2
$47,255
APPLICATIONS WITHDRAWN
5
$61,812
1
$38,310
20
$127,838
0
$0
1
$38,310
0
$0
FILES CLOSED FOR INCOMPLETENESS
1
$37,460
1
$122,600
1
$102,170
0
$0
0
$0
0
$0
Aggregated Statistics For Year 2008 (Based on 2 partial tracts)
A) FHA, FSA/RHS & VA Home Purchase Loans
B) Conventional Home Purchase Loans
C) Refinancings
D) Home Improvement Loans
F) Non-occupant Loans on < 5 Family Dwellings (A B C & D)
G) Loans On Manufactured Home Dwelling (A B C & D)
Number
Average Value
Number
Average Value
Number
Average Value
Number
Average Value
Number
Average Value
Number
Average Value
LOANS ORIGINATED
14
$77,477
15
$89,851
55
$154,939
12
$47,892
5
$101,658
4
$656,642
APPLICATIONS APPROVED, NOT ACCEPTED
2
$44,275
3
$42,570
9
$77,478
0
$0
0
$0
2
$49,805
APPLICATIONS DENIED
4
$78,542
4
$56,405
44
$108,089
9
$39,543
1
$53,640
5
$38,654
APPLICATIONS WITHDRAWN
0
$0
3
$52,220
13
$124,894
2
$8,515
0
$0
0
$0
FILES CLOSED FOR INCOMPLETENESS
0
$0
1
$91,100
2
$54,065
0
$0
0
$0
0
$0
Aggregated Statistics For Year 2007 (Based on 2 partial tracts)
A) FHA, FSA/RHS & VA Home Purchase Loans
B) Conventional Home Purchase Loans
C) Refinancings
D) Home Improvement Loans
F) Non-occupant Loans on < 5 Family Dwellings (A B C & D)
G) Loans On Manufactured Home Dwelling (A B C & D)
Number
Average Value
Number
Average Value
Number
Average Value
Number
Average Value
Number
Average Value
Number
Average Value
LOANS ORIGINATED
10
$100,976
34
$103,220
80
$106,478
26
$34,122
17
$89,196
6
$69,388
APPLICATIONS APPROVED, NOT ACCEPTED
1
$66,410
10
$88,546
14
$101,256
3
$65,273
9
$109,263
3
$45,977
APPLICATIONS DENIED
3
$80,030
25
$101,146
74
$118,126
17
$52,887
9
$140,954
5
$66,410
APPLICATIONS WITHDRAWN
1
$100,470
7
$87,086
13
$97,191
3
$49,667
2
$65,560
1
$102,170
FILES CLOSED FOR INCOMPLETENESS
0
$0
3
$112,383
7
$74,437
1
$68,110
0
$0
0
$0
Aggregated Statistics For Year 2006 (Based on 2 partial tracts)
A) FHA, FSA/RHS & VA Home Purchase Loans
B) Conventional Home Purchase Loans
C) Refinancings
D) Home Improvement Loans
F) Non-occupant Loans on < 5 Family Dwellings (A B C & D)
G) Loans On Manufactured Home Dwelling (A B C & D)
Number
Average Value
Number
Average Value
Number
Average Value
Number
Average Value
Number
Average Value
Number
Average Value
LOANS ORIGINATED
7
$95,964
51
$96,375
107
$95,198
27
$35,412
14
$107,216
12
$70,524
APPLICATIONS APPROVED, NOT ACCEPTED
2
$117,070
7
$39,894
23
$84,696
3
$28,097
3
$78,330
1
$17,030
APPLICATIONS DENIED
4
$60,022
17
$64,406
89
$101,374
13
$54,358
4
$97,272
8
$72,156
APPLICATIONS WITHDRAWN
0
$0
9
$77,856
37
$104,699
2
$18,730
1
$61,300
2
$80,030
FILES CLOSED FOR INCOMPLETENESS
1
$99,610
1
$75,770
22
$105,806
0
$0
0
$0
0
$0
Aggregated Statistics For Year 2005 (Based on 2 partial tracts)
A) FHA, FSA/RHS & VA Home Purchase Loans
B) Conventional Home Purchase Loans
C) Refinancings
D) Home Improvement Loans
F) Non-occupant Loans on < 5 Family Dwellings (A B C & D)
G) Loans On Manufactured Home Dwelling (A B C & D)
Number
Average Value
Number
Average Value
Number
Average Value
Number
Average Value
Number
Average Value
Number
Average Value
LOANS ORIGINATED
7
$87,451
70
$98,823
146
$98,395
22
$32,663
23
$112,089
11
$67,647
APPLICATIONS APPROVED, NOT ACCEPTED
1
$149,000
11
$109,598
20
$120,516
3
$13,907
3
$128,847
3
$45,693
APPLICATIONS DENIED
3
$127,143
24
$76,094
112
$100,693
10
$55,511
7
$75,896
13
$83,830
APPLICATIONS WITHDRAWN
0
$0
15
$106,482
66
$115,236
8
$57,895
3
$157,793
5
$90,930
FILES CLOSED FOR INCOMPLETENESS
0
$0
3
$135,373
28
$113,844
2
$10,645
0
$0
1
$51,940
Aggregated Statistics For Year 2004 (Based on 2 partial tracts)
A) FHA, FSA/RHS & VA Home Purchase Loans
B) Conventional Home Purchase Loans
C) Refinancings
D) Home Improvement Loans
F) Non-occupant Loans on < 5 Family Dwellings (A B C & D)
G) Loans On Manufactured Home Dwelling (A B C & D)
Detailed PMIC statistics for the following Tracts:0101.00
2002 - 2018 National Fire Incident Reporting System (NFIRS) incidents
Based on the data from the years 2002 - 2018 the average number of fires per year is 11. The highest number of fire incidents - 23 took place in 2017, and the least - 2 in 2008. The data has an increasing trend.
When looking into fire subcategories, the most reports belonged to: Structure Fires (55.2%), and Outside Fires (33.5%).
Fire incident types reported to NFIRS in Zip Code 48897

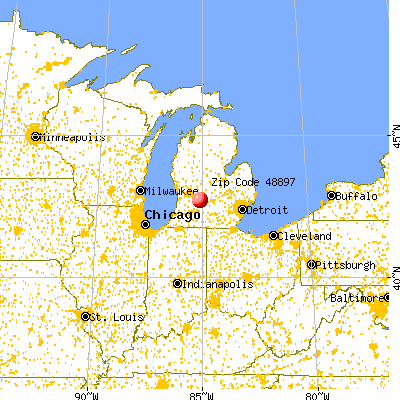


 Nearest zip codes: 48849, 49096, 49073, 48890, 49325, 49058.
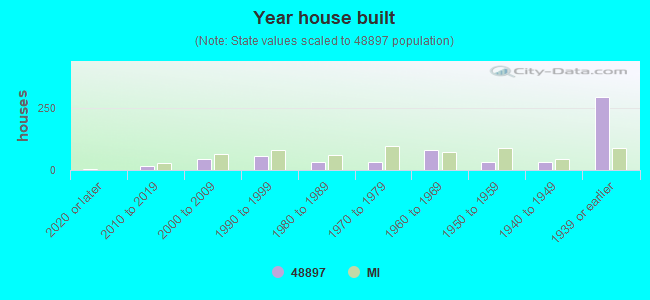


 Based on the data from the years 2002 - 2018 the average number of fires per year is 11. The highest number of fire incidents - 23 took place in 2017, and the least - 2 in 2008. The data has an increasing trend.
 When looking into fire subcategories, the most reports belonged to: Structure Fires (55.2%), and Outside Fires (33.5%).