Estimated zip code population in 2022: 5,023 Zip code population in 2010: 4,951 Zip code population in 2000: 5,134
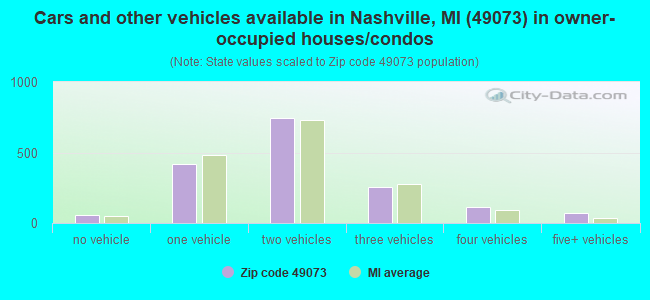
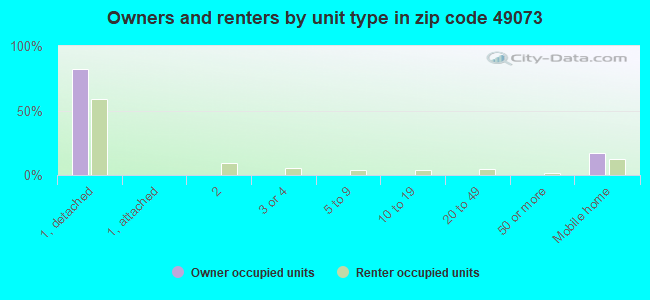
Houses and condos: 2,131 Renter-occupied apartments: 332
% of renters here:
17%
State:
27%
March 2022 cost of living index in zip code 49073: 81.5 (low, U.S. average is 100)
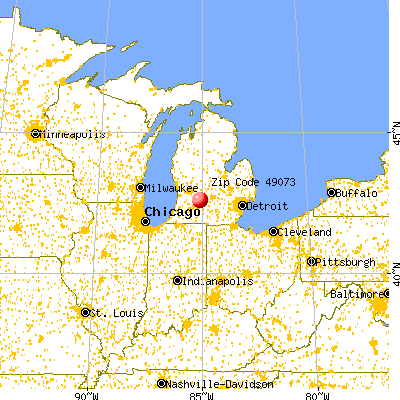
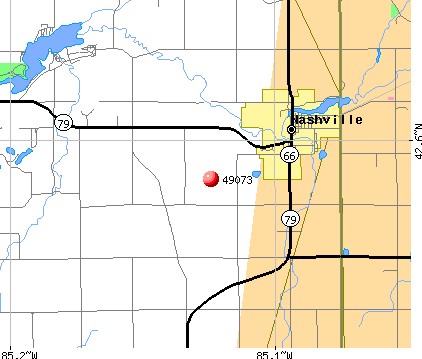
Land area: 69.7 sq. mi. Water area: 0.9 sq. mi.
Population density: 72 people per square mile
(very low).
OSM Map
General Map
Google Map
MSN Map
OSM Map
General Map
Google Map
MSN Map
OSM Map
General Map
Google Map
MSN Map
OSM Map
General Map
Google Map
MSN Map
Please wait while loading the map...
Real estate property taxes paid for housing units in 2022:
This zip code:
1.2% ($2,012)
Michigan:
1.2% ($2,746)
Median real estate property taxes paid for housing units with mortgages in 2022: $2,042 (1.1%) Median real estate property taxes paid for housing units with no mortgage in 2022: $1,988 (1.6%)
Business Search- 14 Million verified businesses
Males: 2,565
(51.1%)
Females: 2,457
(48.9%)
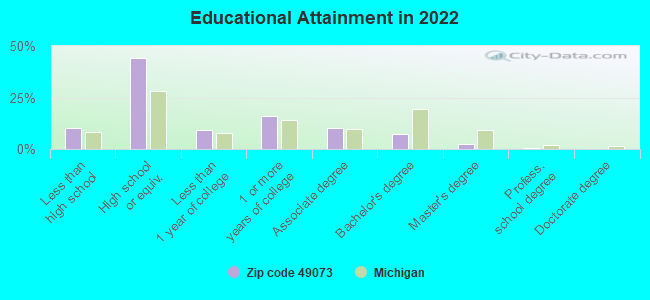
For population 25 years and over in 49073:
High school or higher: 88.6%
Bachelor's degree or higher: 10.0%
Graduate or professional degree: 2.8%
Unemployed: 10.8%
Mean travel time to work (commute): 30.4 minutes
For population 15 years and over in 49073:
Never married: 26.7%
Now married: 45.6%
Separated: 0.9%
Widowed: 8.6%
Divorced: 18.1%
Zip code 49073 compared to state average:
Unemployed percentage above state average.
Black race population percentage significantly below state average.
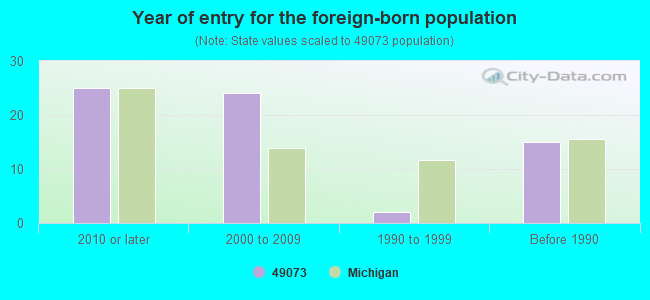
Foreign-born population percentage significantly below state average.
Renting percentage below state average.
Length of stay since moving in significantly above state average.
Number of college students below state average.
Percentage of population with a bachelor's degree or higher significantly below state average.
Averages for the 2020 tax year for zip code 49073, filed in 2021:
Average Adjusted Gross Income (AGI) in 2020: $49,287 (Individual Income Tax Returns)
Here:
$49,287
State:
$68,945
Salary/wage: $44,365 (reported on 75.7% of returns)
Here:
$44,365
State:
$57,142
(% of AGI for various income ranges: 977.5% for AGIs below $25k, 3209.6% for AGIs $25k-50k, 5656.4% for AGIs $50k-75k, 8907.3% for AGIs $75k-100k, 17415.3% for AGIs $100k-200k)
Taxable interest for individuals: $632 (reported on 29.3% of returns)
This zip code:
$632
Michigan:
$1,630
(% of AGI for various income ranges: 8.3% for AGIs below $25k, 16.7% for AGIs $25k-50k, 17.2% for AGIs $50k-75k, 40.7% for AGIs $75k-100k, 120.7% for AGIs $100k-200k)
Ordinary dividends: $2,548 (reported on 12.2% of returns)
Here:
$2,548
State:
$6,972
(% of AGI for various income ranges: 12.5% for AGIs below $25k, 34.5% for AGIs $25k-50k, 22.8% for AGIs $50k-75k, 76.7% for AGIs $75k-100k, 187.3% for AGIs $100k-200k)
Net capital gain/loss in AGI: +$5,084 (reported on 11.3% of returns)
Here:
+$5,084
State:
+$20,064
(% of AGI for various income ranges: 5.1% for AGIs below $25k, 62.2% for AGIs $25k-50k, 81.6% for AGIs $50k-75k, 81.3% for AGIs $75k-100k, 408.7% for AGIs $100k-200k)
Profit/loss from business: +$15,206 (reported on 14.4% of returns)
Here:
+$15,206
State:
+$11,172
(% of AGI for various income ranges: 90.8% for AGIs below $25k, 286.7% for AGIs $25k-50k, 370.4% for AGIs $50k-75k, 496.7% for AGIs $75k-100k, 872.7% for AGIs $100k-200k)
Taxable individual retirement arrangement distribution: $15,041 (reported on 9.9% of returns)
49073:
$15,041
Michigan:
$19,803
(% of AGI for various income ranges: 63.2% for AGIs below $25k, 90.2% for AGIs $25k-50k, 142.4% for AGIs $50k-75k, 475.3% for AGIs $75k-100k, 975.3% for AGIs $100k-200k)
Total itemized deductions: $26,075 (reported on 1.8% of returns)
Here:
$26,075
State:
$34,117
(% of AGI for various income ranges: 695.3% for AGIs $75k-100k)
Charity contributions: $7,767 (reported on 1.4% of returns)
Here:
$7,767
State:
$13,548
(% of AGI for various income ranges: 93.2% for AGIs $50k-75k)
Taxes paid: $6,900 (reported on 1.8% of returns)
49073:
$6,900
State:
$7,972
(% of AGI for various income ranges: 184.0% for AGIs $75k-100k)
Earned income credit: $2,350 (reported on 18.0% of returns)
Here:
$2,350
State:
$2,251
(% of AGI for various income ranges: 101.7% for AGIs below $25k, 81.8% for AGIs $25k-50k)
Percentage of individuals using paid preparers for their 2020 taxes: 95.9%
Here:
96%
State:
93%
(% for various income ranges: 96.1% for AGIs below $25k, 96.9% for AGIs $25k-50k, 94.1% for AGIs $50k-75k, 95.2% for AGIs $75k-100k, 95.8% for AGIs $100k-200k, 100.0% for AGIs over 200k)
Averages for the 2012 tax year for zip code 49073, filed in 2013:
Average Adjusted Gross Income (AGI) in 2012: $40,600 (Individual Income Tax Returns)
Here:
$40,600
State:
$55,609
Salary/wage: $35,771 (reported on 81.6% of returns)
Here:
$35,771
State:
$46,782
(% of AGI for various income ranges: 64.4% for AGIs below $25k, 74.0% for AGIs $25k-50k, 78.2% for AGIs $50k-75k, 71.6% for AGIs $75k-100k, 66.8% for AGIs $100k-200k)
Taxable interest for individuals: $914 (reported on 28.6% of returns)
This zip code:
$914
Michigan:
$1,491
(% of AGI for various income ranges: 1.3% for AGIs below $25k, 0.4% for AGIs $25k-50k, 0.4% for AGIs $50k-75k, 0.7% for AGIs $75k-100k, 0.8% for AGIs $100k-200k)
Ordinary dividends: $1,856 (reported on 13.1% of returns)
Here:
$1,856
State:
$6,225
(% of AGI for various income ranges: 1.0% for AGIs below $25k, 0.5% for AGIs $25k-50k, 0.4% for AGIs $50k-75k, 0.5% for AGIs $75k-100k, 0.7% for AGIs $100k-200k)
Net capital gain/loss in AGI: +$2,245 (reported on 9.7% of returns)
Here:
+$2,245
State:
+$9,326
(% of AGI for various income ranges: 0.4% for AGIs below $25k, 0.2% for AGIs $25k-50k, 0.4% for AGIs $50k-75k, 0.3% for AGIs $75k-100k, 1.4% for AGIs $100k-200k)
Profit/loss from business: +$8,285 (reported on 13.1% of returns)
Here:
+$8,285
State:
+$11,523
(% of AGI for various income ranges: 5.7% for AGIs below $25k, 3.2% for AGIs $25k-50k, 1.9% for AGIs $50k-75k, 1.9% for AGIs $75k-100k, 1.9% for AGIs $100k-200k)
Taxable individual retirement arrangement distribution: $11,760 (reported on 9.7% of returns)
49073:
$11,760
Michigan:
$15,298
(% of AGI for various income ranges: 2.7% for AGIs below $25k, 2.0% for AGIs $25k-50k, 1.5% for AGIs $50k-75k, 4.4% for AGIs $75k-100k, 3.9% for AGIs $100k-200k)
Total itemized deductions: $16,910 (23% of AGI, reported on 20.4% of returns)
Here:
$16,910
State:
$21,628
Here:
23.1% of AGI
State:
18.4% of AGI
(% of AGI for various income ranges: 6.5% for AGIs below $25k, 6.4% for AGIs $25k-50k, 7.6% for AGIs $50k-75k, 11.2% for AGIs $75k-100k, 10.7% for AGIs $100k-200k)
Charity contributions: $2,930 (reported on 14.6% of returns)
Here:
$2,930
State:
$4,225
(% of AGI for various income ranges: 0.5% for AGIs below $25k, 0.6% for AGIs $25k-50k, 0.6% for AGIs $50k-75k, 1.6% for AGIs $75k-100k, 1.9% for AGIs $100k-200k)
Taxes paid: $5,057 (reported on 20.4% of returns)
49073:
$5,057
State:
$8,327
(% of AGI for various income ranges: 0.8% for AGIs below $25k, 1.6% for AGIs $25k-50k, 2.2% for AGIs $50k-75k, 3.5% for AGIs $75k-100k, 4.2% for AGIs $100k-200k)
Earned income credit: $2,249 (reported on 20.9% of returns)
Here:
$2,249
State:
$2,306
(% of AGI for various income ranges: 7.0% for AGIs below $25k, 1.2% for AGIs $25k-50k)
Percentage of individuals using paid preparers for their 2012 taxes: 61.2%
Here:
61%
State:
57%
(% for various income ranges: 57.5% for AGIs below $25k, 64.3% for AGIs $25k-50k, 62.5% for AGIs $50k-75k, 61.1% for AGIs $75k-100k, 69.2% for AGIs $100k-200k)
Averages for the 2004 tax year for zip code 49073, filed in 2005:
Average Adjusted Gross Income (AGI) in 2004: $35,061 (Individual Income Tax Returns)
Here:
$35,061
State:
$48,204
Salary/wage: $33,461 (reported on 85.8% of returns)
Here:
$33,461
State:
$42,791
(% of AGI for various income ranges: 135.9% for AGIs below $10k, 64.3% for AGIs $10k-25k, 81.7% for AGIs $25k-50k, 84.7% for AGIs $50k-75k, 87.2% for AGIs $75k-100k, 77.0% for AGIs over 100k)
Taxable interest for individuals: $1,295 (reported on 38.7% of returns)
This zip code:
$1,295
Michigan:
$1,725
(% of AGI for various income ranges: 5.7% for AGIs below $10k, 2.9% for AGIs $10k-25k, 1.1% for AGIs $25k-50k, 1.1% for AGIs $50k-75k, 0.8% for AGIs $75k-100k, 1.8% for AGIs over 100k)
Taxable dividends: $1,291 (reported on 14.9% of returns)
Here:
$1,291
State:
$3,420
(% of AGI for various income ranges: 1.9% for AGIs below $10k, 1.6% for AGIs $10k-25k, 0.2% for AGIs $25k-50k, 0.4% for AGIs $50k-75k, 0.2% for AGIs $75k-100k, 0.8% for AGIs over 100k)
Net capital gain/loss: +$2,205 (reported on 12.7% of returns)
Here:
+$2,205
State:
+$8,532
(% of AGI for various income ranges: -0.2% for AGIs below $10k, 1.0% for AGIs $10k-25k, 0.8% for AGIs $25k-50k, 0.7% for AGIs $50k-75k, 0.4% for AGIs $75k-100k, 1.4% for AGIs over 100k)
Profit/loss from business: +$4,782 (reported on 14.5% of returns)
Here:
+$4,782
State:
+$9,547
(% of AGI for various income ranges: 0.5% for AGIs below $10k, 6.7% for AGIs $10k-25k, 2.0% for AGIs $25k-50k, 1.9% for AGIs $50k-75k, 0.2% for AGIs $75k-100k, 0.2% for AGIs over 100k)
IRA payment deduction: $2,552 (reported on 1.3% of returns)
49073:
$2,552
Michigan:
$2,875
Total itemized deductions: $14,550 (23% of AGI, reported on 24.9% of returns)
Here:
$14,550
State:
$18,509
Here:
23.3% of AGI
State:
20.7% of AGI
(% of AGI for various income ranges: 7.8% for AGIs $10k-25k, 7.9% for AGIs $25k-50k, 12.0% for AGIs $50k-75k, 12.2% for AGIs $75k-100k, 13.5% for AGIs over 100k)
Charity contributions deductions: $2,189 (3% of AGI, reported on 18.4% of returns)
Here:
$2,189
State:
$3,365
Here:
3.3% of AGI
State:
3.6% of AGI
(% of AGI for various income ranges: 0.6% for AGIs $10k-25k, 0.8% for AGIs $25k-50k, 1.1% for AGIs $50k-75k, 1.6% for AGIs $75k-100k, 2.2% for AGIs over 100k)
Total tax: $3,933 (reported on 72.2% of returns)
49073:
$3,933
State:
$7,691
(% of AGI for various income ranges: 3.5% for AGIs below $10k, 4.0% for AGIs $10k-25k, 6.0% for AGIs $25k-50k, 7.9% for AGIs $50k-75k, 10.1% for AGIs $75k-100k, 15.9% for AGIs over 100k)
Earned income credit: $1,618 (reported on 16.3% of returns)
Here:
$1,618
State:
$1,737
Percentage of individuals using paid preparers for their 2004 taxes: 61.1%
Here:
61%
State:
60%
(% for various income ranges: 53.9% for AGIs below $10k, 62.8% for AGIs $10k-25k, 65.4% for AGIs $25k-50k, 60.3% for AGIs $50k-75k, 57.1% for AGIs $75k-100k, 75.8% for AGIs over 100k)
Household received Food Stamps/SNAP in the past 12 months: 440 Household did not receive Food Stamps/SNAP in the past 12 months: 1,566
Women who had a birth in the past 12 months: 35 (32 now married, 3 unmarried) Women who did not have a birth in the past 12 months: 979 (417 now married, 560 unmarried)
Housing units in zip code 49073 with a mortgage: 788 (45 second mortgage, 47 both second mortgage and home equity loan) Houses without a mortgage: 13
Median monthly owner costs for units with a mortgage: $1,179 Median monthly owner costs for units without a mortgage: $539
Residents with income below the poverty level in 2022:
This zip code:
15.3%
Whole state:
13.4%
Residents with income below 50% of the poverty level in 2022:
This zip code:
8.1%
Whole state:
6.9%
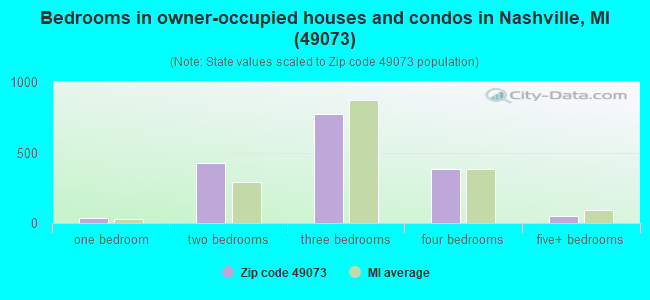
Median number of rooms in houses and condos:
Here:
6.5
State:
6.5
Median number of rooms in apartments:
Here:
5.0
State:
4.3
Notable locations in this zip code not listed on our city pages
Notable locations in zip code 49073: Castleto - Maple Grove - Nashville Ambulance Service (A), Laurel Manor Rest Home (B), Putnam Public Library (C), Castleto - Maple Grove - Nashville Fire Department (D), Nashville Police Department (E), Maple Leaf Grange Hall (F). Display/hide their locations on the map
Churches in zip code 49073 include: Maple Grove Church (A), Peace United Methodist Church (B), Church of the Nazarene (C), Grace Community Church (D), Assembly of God Church (E), Saint Cyril Catholic Church (F), Nashville United Methodist Church (G), Nashville Baptist Church (H). Display/hide their locations on the map
Cemeteries: Barryville Cemetery (1), Nashville Cemetery (2), Quaker Cemetery (3), Hosmer Cemetery (4), Wilcox Cemetery (5), German Evangelical Cemetery (6), Mason Cemetery (7). Display/hide their locations on the map
Lakes: Lake One (A), Wild Lake (B), Mill Pond (C), Ellison Lake (D), Ellis Lake (E), Taylor Lake (F), Thornapple Lake (G). Display/hide their locations on the map
In group quarters: 17 (-1 institutionalized population)
Size of family households: 698 2-persons, 244 3-persons, 195 4-persons, 65 5-persons, 27 6-persons, 30 7-or-more-persons
Size of nonfamily households: 568 1-person, 98 2-persons, 66 3-persons
723 married couples with children.
292 single-parent households (120 men, 172 women).
93.6% of residents of 49073 zip code speak English at home.
2.1% of residents speak Spanish at home (57% very well, 14% well, 29% not well).
4.1% of residents speak other Indo-European language at home (73% very well, 23% well, 4% not well).
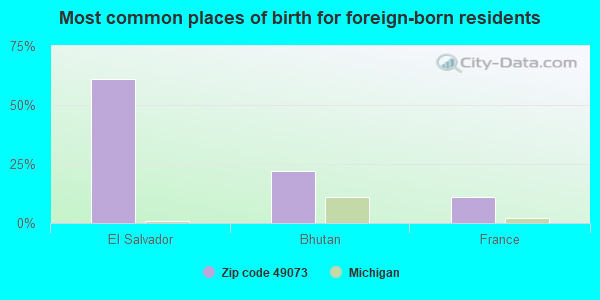
Foreign born population: 18 (0.4%) (78.7% of them are naturalized citizens)
This zip code:
0.4%
Whole state:
6.9%
61%El Salvador
22%Bhutan
11%France
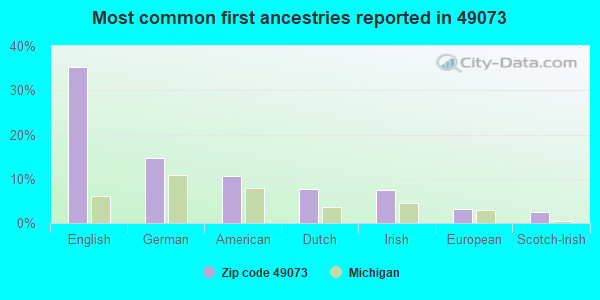
35%English
15%German
11%American
8%Dutch
8%Irish
3%European
3%Scotch-Irish
Year of entry for the foreign-born population
252010 or later
242000 to 2009
21990 to 1999
15Before 1990
Facilities with environmental interests located in this zip code:
FULLER STREET ELEMENTARY SCHOOL (251 FULLER STREET in NASHVILLE, MI)
(National Center for Education Statistics) - STATE ID-01339 Organizations: MAPLE VALLEY SCHOOLS (SCHOOL DISTRICT)
MI DEPT/STATE POLICE (6265 THORNAPPLE # 123 in NASHVILLE, MI)
(Resource Conservation and Recovery Act (tracking hazardous waste)) Alternative names: MI DEPT/STATE POLICE (E)
Housing units lacking complete plumbing facilities: 0.9% Housing units lacking complete kitchen facilities: 1.4%
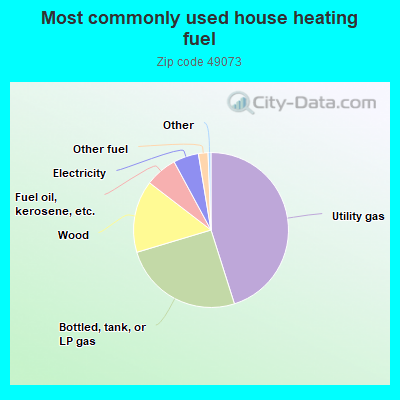
45.2%Utility gas
25.3%Bottled, tank, or LP gas
15.1%Wood
6.7%Fuel oil, kerosene, etc.
5.3%Electricity
2.0%Other fuel
Population in 1990: 5,517.
Place of birth for U.S.-born residents:
This state: 4,418
Northeast: 84
Midwest: 145
South: 249
West: 46
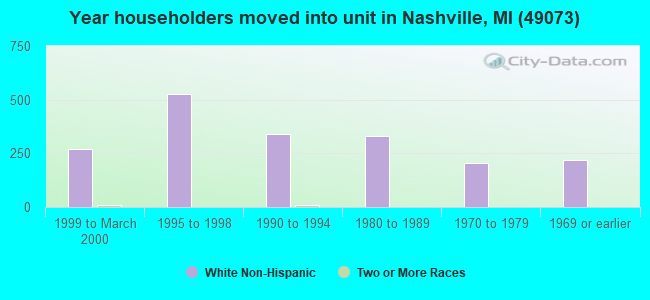
60% of the 49073 zip code residents lived in the same house 5 years ago. Out of people who lived in different houses, 44% lived in this county. Out of people who lived in different counties, 50% lived in Michigan.
89% of the 49073 zip code residents lived in the same house 1 year ago. Out of people who lived in different houses, 46% moved from this county. Out of people who lived in different houses, 40% moved from different county within same state. Out of people who lived in different houses, 13% moved from different state.
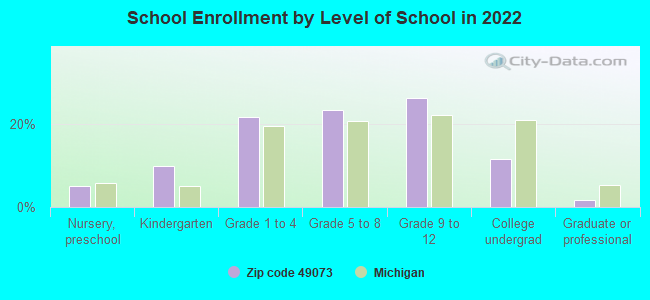
Private vs. public school enrollment:
Students in private schools in grades 1 to 8 (elementary and middle school): 96
Here:
22.7%
Michigan:
12.4%
Students in private schools in grades 9 to 12 (high school): 44
Here:
18.0%
Michigan:
9.8%
Students in private undergraduate colleges: 22
Here:
21.2%
Michigan:
14.9%
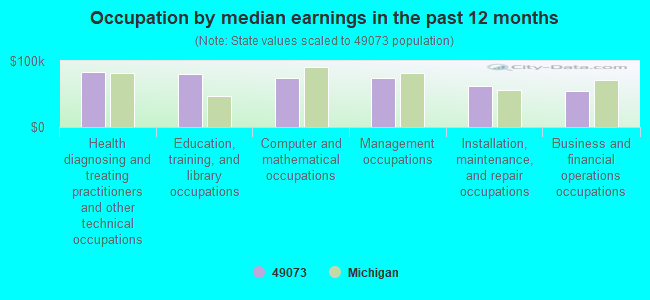
Occupation by median earnings in the past 12 months ($)
83,545Health diagnosing and treating practitioners and other technical occupations
80,062Education, training, and library occupations
74,581Computer and mathematical occupations
73,935Management occupations
61,423Installation, maintenance, and repair occupations
54,685Business and financial operations occupations
Companies with federal contracts located in this zip code:
THE FEIGHNER COMPANY (6620 E M-79 HIGHWAY in NASHVILLE, MI; small business) 10 employees, $1000 revenue
$10,778 with U.S. Coast Guard for Miscellaneous Ship and Marine Equipment. Signed on 2005-09-14. Completion date: 2005-10-14.
Top industries in this zip code by the number of employees in 2005:
Other Services (except Public Administration): Religious Organizations (5-9: 1, 1-4: 5)
Construction: Electrical Contractors (10-19: 1)
Wholesale Trade: Farm and Garden Machinery and Equipment Merchant Wholesalers (10-19: 1)
Wholesale Trade: Transportation Equipment and Supplies (except Motor Vehicle) Merchant Wholesalers (10-19: 1)
Other Services (except Public Administration): Commercial and Industrial Machinery and Equipment (except Automotive and Electronic) Repair and Maintenance (5-9: 1, 1-4: 1)
People in group quarters in 2010:
11 people in nursing facilities/skilled-nursing facilities
People in group quarters in 2000:
12 people in other group homes
Fatal accident statistics in 2014:
Fatal accident count: 3
Vehicles involved in fatal accidents: 4
Fatal accidents caused by drunken drivers: 1
Fatalities: 3
Persons involved in fatal accidents: 5
Pedestrians involved in fatal accidents: 1
Fatal accident statistics in 2012:
Fatal accident count: 1
Vehicles involved in fatal accidents: 1
Fatal accidents caused by drunken drivers: 0
Fatalities: 1
Persons involved in fatal accidents: 1
Pedestrians involved in fatal accidents: 0
Home Mortgage Disclosure Act Aggregated Statistics For Year 2009 (Based on 6 partial tracts)
A) FHA, FSA/RHS & VA Home Purchase Loans
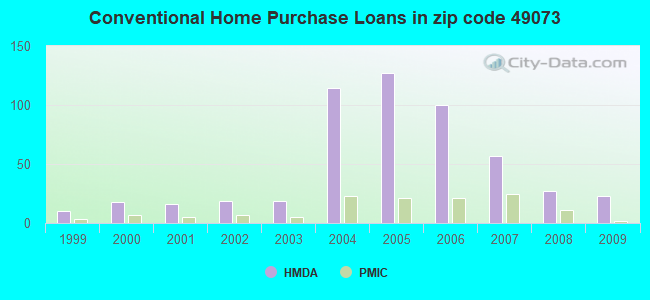
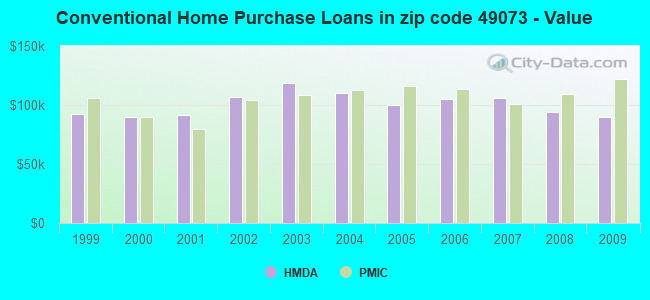
B) Conventional Home Purchase Loans
C) Refinancings
D) Home Improvement Loans
F) Non-occupant Loans on < 5 Family Dwellings (A B C & D)
G) Loans On Manufactured Home Dwelling (A B C & D)
Number
Average Value
Number
Average Value
Number
Average Value
Number
Average Value
Number
Average Value
Number
Average Value
LOANS ORIGINATED
22
$87,781
23
$90,225
134
$120,625
16
$25,438
8
$74,569
6
$70,823
APPLICATIONS APPROVED, NOT ACCEPTED
0
$0
2
$103,150
12
$133,833
2
$13,210
3
$125,883
2
$94,545
APPLICATIONS DENIED
9
$84,161
5
$100,938
73
$123,913
8
$22,175
3
$68,477
6
$49,155
APPLICATIONS WITHDRAWN
9
$84,474
2
$107,260
36
$124,656
1
$16,220
1
$30,740
0
$0
FILES CLOSED FOR INCOMPLETENESS
1
$30,060
1
$98,380
4
$126,142
1
$3,040
1
$131,770
0
$0
Aggregated Statistics For Year 2008 (Based on 6 partial tracts)
A) FHA, FSA/RHS & VA Home Purchase Loans
B) Conventional Home Purchase Loans
C) Refinancings
D) Home Improvement Loans
F) Non-occupant Loans on < 5 Family Dwellings (A B C & D)
G) Loans On Manufactured Home Dwelling (A B C & D)
Number
Average Value
Number
Average Value
Number
Average Value
Number
Average Value
Number
Average Value
Number
Average Value
LOANS ORIGINATED
30
$89,965
27
$94,056
116
$133,557
22
$63,832
9
$91,320
13
$228,372
APPLICATIONS APPROVED, NOT ACCEPTED
4
$70,698
4
$61,865
22
$121,776
1
$25,390
1
$30,110
3
$68,480
APPLICATIONS DENIED
6
$82,048
9
$74,971
94
$129,880
16
$36,106
6
$108,217
14
$80,997
APPLICATIONS WITHDRAWN
2
$67,215
6
$50,818
34
$123,957
4
$35,678
0
$0
4
$95,398
FILES CLOSED FOR INCOMPLETENESS
0
$0
3
$82,853
7
$138,517
1
$102,750
0
$0
0
$0
Aggregated Statistics For Year 2007 (Based on 6 partial tracts)
A) FHA, FSA/RHS & VA Home Purchase Loans
B) Conventional Home Purchase Loans
C) Refinancings
D) Home Improvement Loans
F) Non-occupant Loans on < 5 Family Dwellings (A B C & D)
G) Loans On Manufactured Home Dwelling (A B C & D)
Number
Average Value
Number
Average Value
Number
Average Value
Number
Average Value
Number
Average Value
Number
Average Value
LOANS ORIGINATED
20
$100,026
57
$105,714
164
$113,298
48
$37,001
19
$94,661
21
$80,500
APPLICATIONS APPROVED, NOT ACCEPTED
1
$53,290
13
$83,724
37
$109,638
8
$56,395
7
$119,080
9
$57,987
APPLICATIONS DENIED
8
$110,728
42
$108,529
160
$127,246
35
$47,577
14
$137,946
25
$82,490
APPLICATIONS WITHDRAWN
3
$139,650
8
$118,316
51
$129,250
4
$55,612
4
$73,672
4
$127,105
FILES CLOSED FOR INCOMPLETENESS
0
$0
6
$117,100
18
$110,254
2
$50,690
1
$57,970
0
$0
Aggregated Statistics For Year 2006 (Based on 6 partial tracts)
A) FHA, FSA/RHS & VA Home Purchase Loans
B) Conventional Home Purchase Loans
C) Refinancings
D) Home Improvement Loans
F) Non-occupant Loans on < 5 Family Dwellings (A B C & D)
G) Loans On Manufactured Home Dwelling (A B C & D)
Number
Average Value
Number
Average Value
Number
Average Value
Number
Average Value
Number
Average Value
Number
Average Value
LOANS ORIGINATED
11
$106,240
100
$104,930
211
$104,155
54
$43,466
21
$98,065
18
$75,501
APPLICATIONS APPROVED, NOT ACCEPTED
1
$187,880
18
$62,067
39
$109,134
4
$38,438
5
$66,094
3
$95,537
APPLICATIONS DENIED
4
$50,980
36
$93,640
180
$120,589
30
$59,410
7
$62,991
16
$89,857
APPLICATIONS WITHDRAWN
1
$108,210
20
$85,608
80
$112,556
9
$59,866
3
$49,817
4
$104,672
FILES CLOSED FOR INCOMPLETENESS
1
$79,930
2
$121,155
42
$166,779
1
$32,080
0
$0
0
$0
Aggregated Statistics For Year 2005 (Based on 6 partial tracts)
A) FHA, FSA/RHS & VA Home Purchase Loans
B) Conventional Home Purchase Loans
C) Refinancings
D) Home Improvement Loans
F) Non-occupant Loans on < 5 Family Dwellings (A B C & D)
G) Loans On Manufactured Home Dwelling (A B C & D)
Number
Average Value
Number
Average Value
Number
Average Value
Number
Average Value
Number
Average Value
Number
Average Value
LOANS ORIGINATED
14
$107,041
127
$99,915
283
$110,618
46
$36,738
30
$107,738
31
$80,575
APPLICATIONS APPROVED, NOT ACCEPTED
2
$120,220
16
$109,030
49
$118,725
8
$27,370
3
$113,803
5
$47,586
APPLICATIONS DENIED
3
$128,100
44
$94,659
220
$111,821
30
$55,766
9
$85,553
25
$80,505
APPLICATIONS WITHDRAWN
0
$0
26
$123,418
124
$118,942
11
$110,434
5
$125,048
12
$101,007
FILES CLOSED FOR INCOMPLETENESS
0
$0
7
$111,136
66
$123,311
2
$43,715
1
$157,490
2
$141,180
Aggregated Statistics For Year 2004 (Based on 6 partial tracts)
A) FHA, FSA/RHS & VA Home Purchase Loans
B) Conventional Home Purchase Loans
C) Refinancings
D) Home Improvement Loans
F) Non-occupant Loans on < 5 Family Dwellings (A B C & D)
G) Loans On Manufactured Home Dwelling (A B C & D)
Number
Average Value
Number
Average Value
Number
Average Value
Number
Average Value
Number
Average Value
Number
Average Value
LOANS ORIGINATED
15
$116,854
114
$109,906
315
$105,289
41
$52,193
22
$79,453
30
$79,213
APPLICATIONS APPROVED, NOT ACCEPTED
2
$142,920
16
$82,774
71
$103,388
2
$66,540
4
$115,348
12
$89,261
APPLICATIONS DENIED
2
$91,780
33
$75,360
188
$112,757
19
$41,249
10
$93,352
35
$73,583
APPLICATIONS WITHDRAWN
0
$0
11
$89,301
89
$108,929
2
$55,560
5
$84,028
8
$100,601
FILES CLOSED FOR INCOMPLETENESS
0
$0
4
$111,350
46
$110,397
2
$53,975
1
$179,410
6
$94,500
Aggregated Statistics For Year 2003 (Based on 2 partial tracts)
A) FHA, FSA/RHS & VA Home Purchase Loans
B) Conventional Home Purchase Loans
C) Refinancings
D) Home Improvement Loans
F) Non-occupant Loans on < 5 Family Dwellings (A B C & D)
Number
Average Value
Number
Average Value
Number
Average Value
Number
Average Value
Number
Average Value
LOANS ORIGINATED
3
$76,447
19
$119,003
88
$104,080
2
$51,780
2
$79,215
APPLICATIONS APPROVED, NOT ACCEPTED
0
$0
3
$85,920
15
$106,482
1
$23,070
1
$56,840
APPLICATIONS DENIED
0
$0
4
$98,982
44
$100,863
3
$40,240
2
$75,275
APPLICATIONS WITHDRAWN
0
$0
1
$171,940
19
$102,889
1
$15,760
1
$66,130
FILES CLOSED FOR INCOMPLETENESS
0
$0
1
$56,000
3
$135,633
0
$0
0
$0
Aggregated Statistics For Year 2002 (Based on 2 partial tracts)
A) FHA, FSA/RHS & VA Home Purchase Loans
B) Conventional Home Purchase Loans
C) Refinancings
D) Home Improvement Loans
F) Non-occupant Loans on < 5 Family Dwellings (A B C & D)
Number
Average Value
Number
Average Value
Number
Average Value
Number
Average Value
Number
Average Value
LOANS ORIGINATED
2
$96,100
19
$106,488
65
$100,122
3
$7,130
1
$106,930
APPLICATIONS APPROVED, NOT ACCEPTED
0
$0
2
$109,325
15
$99,241
1
$11,820
0
$0
APPLICATIONS DENIED
1
$40,240
5
$87,572
29
$93,406
3
$16,883
1
$32,080
APPLICATIONS WITHDRAWN
1
$45,310
1
$84,980
12
$104,071
0
$0
0
$0
FILES CLOSED FOR INCOMPLETENESS
0
$0
1
$51,500
9
$116,624
0
$0
0
$0
Aggregated Statistics For Year 2001 (Based on 2 partial tracts)
A) FHA, FSA/RHS & VA Home Purchase Loans
B) Conventional Home Purchase Loans
C) Refinancings
D) Home Improvement Loans
F) Non-occupant Loans on < 5 Family Dwellings (A B C & D)
Number
Average Value
Number
Average Value
Number
Average Value
Number
Average Value
Number
Average Value
LOANS ORIGINATED
7
$103,434
16
$91,701
53
$88,843
7
$15,597
2
$68,660
APPLICATIONS APPROVED, NOT ACCEPTED
0
$0
2
$48,680
12
$72,508
2
$25,750
1
$11,820
APPLICATIONS DENIED
1
$67,820
6
$100,507
25
$74,582
3
$13,977
1
$53,750
APPLICATIONS WITHDRAWN
0
$0
2
$59,655
15
$89,673
0
$0
0
$0
FILES CLOSED FOR INCOMPLETENESS
1
$45,590
1
$65,850
3
$103,460
0
$0
0
$0
Aggregated Statistics For Year 2000 (Based on 2 partial tracts)
A) FHA, FSA/RHS & VA Home Purchase Loans
B) Conventional Home Purchase Loans
C) Refinancings
D) Home Improvement Loans
F) Non-occupant Loans on < 5 Family Dwellings (A B C & D)
Number
Average Value
Number
Average Value
Number
Average Value
Number
Average Value
Number
Average Value
LOANS ORIGINATED
4
$79,355
18
$90,142
28
$76,119
6
$18,948
2
$58,110
APPLICATIONS APPROVED, NOT ACCEPTED
0
$0
1
$97,930
6
$75,228
2
$18,995
1
$42,770
APPLICATIONS DENIED
0
$0
10
$46,290
21
$77,425
6
$18,995
1
$68,660
APPLICATIONS WITHDRAWN
1
$72,600
2
$71,755
10
$66,213
1
$56,560
1
$21,670
FILES CLOSED FOR INCOMPLETENESS
0
$0
1
$70,350
3
$69,037
0
$0
0
$0
Aggregated Statistics For Year 1999 (Based on 1 partial tract)
A) FHA, FSA/RHS & VA Home Purchase Loans
B) Conventional Home Purchase Loans
C) Refinancings
D) Home Improvement Loans
F) Non-occupant Loans on < 5 Family Dwellings (A B C & D)
2002 - 2018 National Fire Incident Reporting System (NFIRS) incidents
According to the data from the years 2002 - 2018 the average number of fire incidents per year is 22. The highest number of fire incidents - 35 took place in 2003, and the least - 6 in 2015. The data has an increasing trend.
When looking into fire subcategories, the most incidents belonged to: Structure Fires (48.8%), and Outside Fires (35.7%).
Fire incident types reported to NFIRS in Zip Code 49073


 Nearest zip codes: 49096, 48897, 49021, 49050, 49058, 49017.


 According to the data from the years 2002 - 2018 the average number of fire incidents per year is 22. The highest number of fire incidents - 35 took place in 2003, and the least - 6 in 2015. The data has an increasing trend.
 When looking into fire subcategories, the most incidents belonged to: Structure Fires (48.8%), and Outside Fires (35.7%).