Estimated zip code population in 2022: 6,180 Zip code population in 2010: 6,276 Zip code population in 2000: 6,211
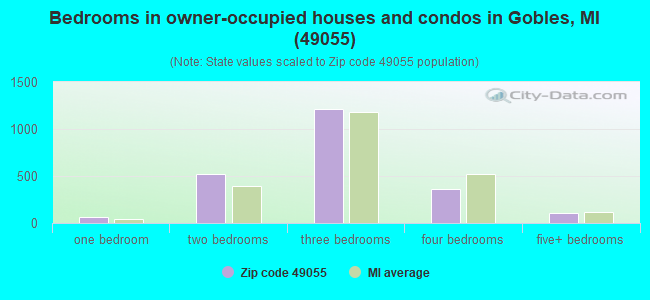
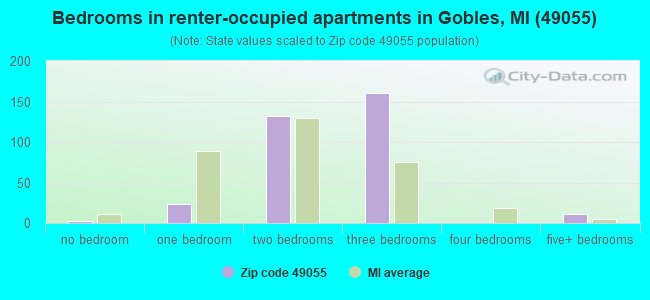
Houses and condos: 3,256 Renter-occupied apartments: 333
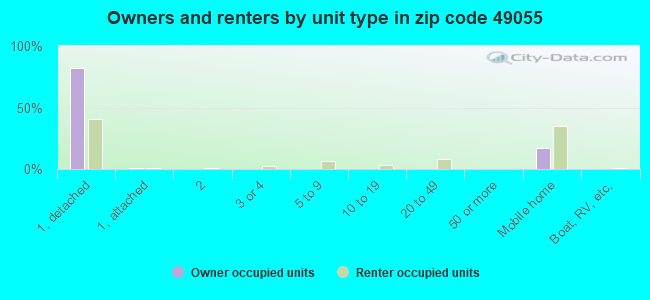
% of renters here:
13%
State:
27%
March 2022 cost of living index in zip code 49055: 81.4 (low, U.S. average is 100)
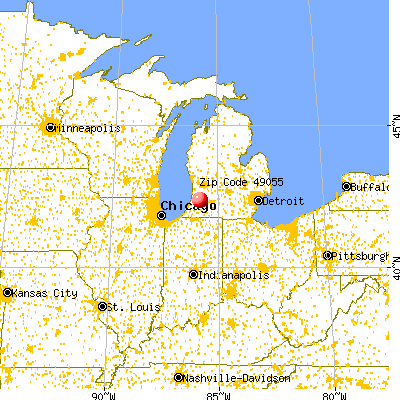
Land area: 58.8 sq. mi. Water area: 2.1 sq. mi.
Population density: 105 people per square mile
(very low).
OSM Map
General Map
Google Map
MSN Map
OSM Map
General Map
Google Map
MSN Map
OSM Map
General Map
Google Map
MSN Map
OSM Map
General Map
Google Map
MSN Map
Please wait while loading the map...
Real estate property taxes paid for housing units in 2022:
This zip code:
1.2% ($2,209)
Michigan:
1.2% ($2,746)
Median real estate property taxes paid for housing units with mortgages in 2022: $2,193 (1.2%) Median real estate property taxes paid for housing units with no mortgage in 2022: $2,237 (1.3%)
Business Search- 14 Million verified businesses
Males: 3,008
(48.7%)
Females: 3,172
(51.3%)
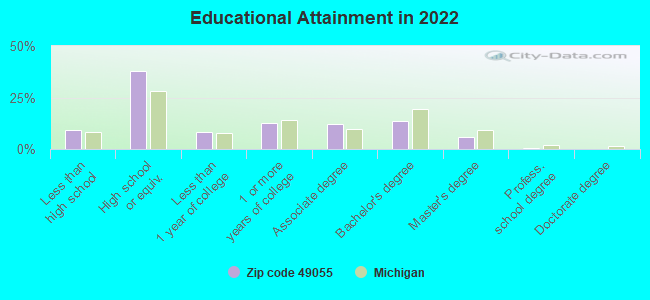
For population 25 years and over in 49055:
High school or higher: 90.2%
Bachelor's degree or higher: 19.7%
Graduate or professional degree: 6.3%
Unemployed: 3.8%
Mean travel time to work (commute): 26.6 minutes
For population 15 years and over in 49055:
Never married: 24.0%
Now married: 57.6%
Separated: 0.3%
Widowed: 6.6%
Divorced: 11.5%
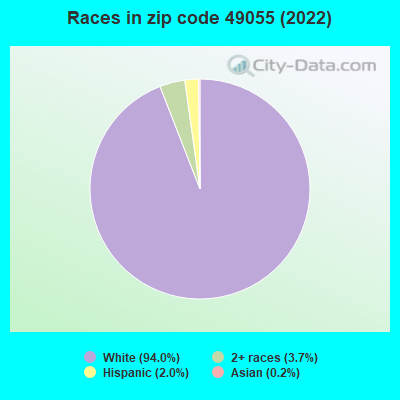
Zip code 49055 compared to state average:
Black race population percentage significantly below state average.
Hispanic race population percentage below state average.
Median age significantly above state average.
Foreign-born population percentage significantly below state average.
Renting percentage below state average.
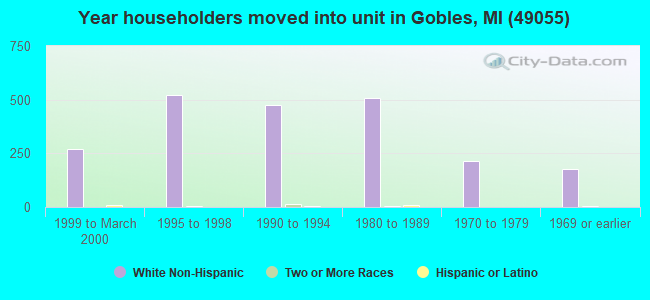
Length of stay since moving in significantly above state average.
Number of college students below state average.
Percentage of population with a bachelor's degree or higher below state average.
Averages for the 2020 tax year for zip code 49055, filed in 2021:
Average Adjusted Gross Income (AGI) in 2020: $56,890 (Individual Income Tax Returns)
Here:
$56,890
State:
$68,945
Salary/wage: $50,288 (reported on 77.9% of returns)
Here:
$50,288
State:
$57,142
(% of AGI for various income ranges: 1034.5% for AGIs below $25k, 3305.2% for AGIs $25k-50k, 5937.2% for AGIs $50k-75k, 8197.6% for AGIs $75k-100k, 17499.0% for AGIs $100k-200k, 57240.0% for AGIs over 200k)
Taxable interest for individuals: $1,202 (reported on 31.0% of returns)
This zip code:
$1,202
Michigan:
$1,630
(% of AGI for various income ranges: 17.1% for AGIs below $25k, 19.6% for AGIs $25k-50k, 55.8% for AGIs $50k-75k, 81.6% for AGIs $75k-100k, 147.0% for AGIs $100k-200k, 800.0% for AGIs over 200k)
Ordinary dividends: $3,027 (reported on 15.2% of returns)
Here:
$3,027
State:
$6,972
(% of AGI for various income ranges: 25.9% for AGIs below $25k, 23.4% for AGIs $25k-50k, 60.3% for AGIs $50k-75k, 125.6% for AGIs $75k-100k, 191.5% for AGIs $100k-200k, 580.0% for AGIs over 200k)
Net capital gain/loss in AGI: +$14,176 (reported on 13.1% of returns)
Here:
+$14,176
State:
+$20,064
(% of AGI for various income ranges: 11.2% for AGIs below $25k, 34.3% for AGIs $25k-50k, 85.3% for AGIs $50k-75k, 174.8% for AGIs $75k-100k, 681.0% for AGIs $100k-200k, 15075.0% for AGIs over 200k)
Profit/loss from business: +$11,372 (reported on 13.8% of returns)
Here:
+$11,372
State:
+$11,172
(% of AGI for various income ranges: 74.7% for AGIs below $25k, 110.5% for AGIs $25k-50k, 203.6% for AGIs $50k-75k, 194.0% for AGIs $75k-100k, 1109.5% for AGIs $100k-200k)
Taxable individual retirement arrangement distribution: $18,641 (reported on 11.7% of returns)
49055:
$18,641
Michigan:
$19,803
(% of AGI for various income ranges: 96.2% for AGIs below $25k, 165.4% for AGIs $25k-50k, 310.3% for AGIs $50k-75k, 444.8% for AGIs $75k-100k, 1274.0% for AGIs $100k-200k)
Total itemized deductions: $32,800 (reported on 3.8% of returns)
Here:
$32,800
State:
$34,117
(% of AGI for various income ranges: 89.8% for AGIs below $25k, 246.4% for AGIs $50k-75k, 1064.0% for AGIs $100k-200k)
Charity contributions: $9,838 (reported on 2.8% of returns)
Here:
$9,838
State:
$13,548
(% of AGI for various income ranges: 34.4% for AGIs $50k-75k, 331.5% for AGIs $100k-200k)
Taxes paid: $7,145 (reported on 3.8% of returns)
49055:
$7,145
State:
$7,972
(% of AGI for various income ranges: 10.0% for AGIs below $25k, 70.3% for AGIs $50k-75k, 233.5% for AGIs $100k-200k)
Earned income credit: $1,998 (reported on 14.8% of returns)
Here:
$1,998
State:
$2,251
(% of AGI for various income ranges: 73.8% for AGIs below $25k, 66.4% for AGIs $25k-50k)
Percentage of individuals using paid preparers for their 2020 taxes: 94.8%
Here:
95%
State:
93%
(% for various income ranges: 93.8% for AGIs below $25k, 94.4% for AGIs $25k-50k, 97.9% for AGIs $50k-75k, 93.9% for AGIs $75k-100k, 94.4% for AGIs $100k-200k, 100.0% for AGIs over 200k)
Averages for the 2012 tax year for zip code 49055, filed in 2013:
Average Adjusted Gross Income (AGI) in 2012: $44,736 (Individual Income Tax Returns)
Here:
$44,736
State:
$55,609
Salary/wage: $40,609 (reported on 81.1% of returns)
Here:
$40,609
State:
$46,782
(% of AGI for various income ranges: 68.0% for AGIs below $25k, 75.2% for AGIs $25k-50k, 78.5% for AGIs $50k-75k, 74.5% for AGIs $75k-100k, 75.0% for AGIs $100k-200k, 58.3% for AGIs over 200k)
Taxable interest for individuals: $1,034 (reported on 28.2% of returns)
This zip code:
$1,034
Michigan:
$1,491
(% of AGI for various income ranges: 1.2% for AGIs below $25k, 0.5% for AGIs $25k-50k, 0.7% for AGIs $50k-75k, 0.5% for AGIs $75k-100k, 0.8% for AGIs $100k-200k)
Ordinary dividends: $2,878 (reported on 14.3% of returns)
Here:
$2,878
State:
$6,225
(% of AGI for various income ranges: 1.4% for AGIs below $25k, 0.8% for AGIs $25k-50k, 0.8% for AGIs $50k-75k, 0.2% for AGIs $75k-100k, 1.8% for AGIs $100k-200k)
Net capital gain/loss in AGI: +$3,356 (reported on 12.1% of returns)
Here:
+$3,356
State:
+$9,326
(% of AGI for various income ranges: 0.1% for AGIs $25k-50k, 0.7% for AGIs $50k-75k, 2.2% for AGIs $75k-100k, 1.7% for AGIs $100k-200k)
Profit/loss from business: +$9,425 (reported on 14.3% of returns)
Here:
+$9,425
State:
+$11,523
(% of AGI for various income ranges: 7.0% for AGIs below $25k, 2.1% for AGIs $25k-50k, 2.2% for AGIs $50k-75k, 3.8% for AGIs $75k-100k, 2.8% for AGIs $100k-200k)
Taxable individual retirement arrangement distribution: $14,524 (reported on 12.1% of returns)
49055:
$14,524
Michigan:
$15,298
(% of AGI for various income ranges: 4.8% for AGIs below $25k, 3.5% for AGIs $25k-50k, 3.5% for AGIs $50k-75k, 4.2% for AGIs $75k-100k, 5.5% for AGIs $100k-200k)
Total itemized deductions: $17,975 (21% of AGI, reported on 24.6% of returns)
Here:
$17,975
State:
$21,628
Here:
21.2% of AGI
State:
18.4% of AGI
(% of AGI for various income ranges: 7.6% for AGIs below $25k, 7.9% for AGIs $25k-50k, 8.3% for AGIs $50k-75k, 11.5% for AGIs $75k-100k, 13.3% for AGIs $100k-200k, 9.6% for AGIs over 200k)
Charity contributions: $3,106 (reported on 17.9% of returns)
Here:
$3,106
State:
$4,225
(% of AGI for various income ranges: 0.7% for AGIs below $25k, 0.7% for AGIs $25k-50k, 1.1% for AGIs $50k-75k, 1.5% for AGIs $75k-100k, 2.1% for AGIs $100k-200k, 0.8% for AGIs over 200k)
Taxes paid: $6,077 (reported on 24.6% of returns)
49055:
$6,077
State:
$8,327
(% of AGI for various income ranges: 1.6% for AGIs below $25k, 1.9% for AGIs $25k-50k, 2.5% for AGIs $50k-75k, 3.9% for AGIs $75k-100k, 5.2% for AGIs $100k-200k, 5.3% for AGIs over 200k)
Earned income credit: $2,229 (reported on 18.2% of returns)
Here:
$2,229
State:
$2,306
(% of AGI for various income ranges: 6.1% for AGIs below $25k, 1.0% for AGIs $25k-50k)
Percentage of individuals using paid preparers for their 2012 taxes: 58.6%
Here:
59%
State:
57%
(% for various income ranges: 55.5% for AGIs below $25k, 61.8% for AGIs $25k-50k, 60.5% for AGIs $50k-75k, 57.7% for AGIs $75k-100k, 61.9% for AGIs $100k-200k, 66.7% for AGIs over 200k)
Averages for the 2004 tax year for zip code 49055, filed in 2005:
Average Adjusted Gross Income (AGI) in 2004: $38,586 (Individual Income Tax Returns)
Here:
$38,586
State:
$48,204
Salary/wage: $35,413 (reported on 84.4% of returns)
Here:
$35,413
State:
$42,791
(% of AGI for various income ranges: 109.9% for AGIs below $10k, 69.3% for AGIs $10k-25k, 82.4% for AGIs $25k-50k, 83.4% for AGIs $50k-75k, 85.5% for AGIs $75k-100k, 60.8% for AGIs over 100k)
Taxable interest for individuals: $1,312 (reported on 40.8% of returns)
This zip code:
$1,312
Michigan:
$1,725
(% of AGI for various income ranges: 6.7% for AGIs below $10k, 2.2% for AGIs $10k-25k, 1.3% for AGIs $25k-50k, 0.7% for AGIs $50k-75k, 0.5% for AGIs $75k-100k, 2.0% for AGIs over 100k)
Taxable dividends: $1,498 (reported on 18.9% of returns)
Here:
$1,498
State:
$3,420
(% of AGI for various income ranges: 3.3% for AGIs below $10k, 1.3% for AGIs $10k-25k, 0.4% for AGIs $25k-50k, 0.5% for AGIs $50k-75k, 0.3% for AGIs $75k-100k, 1.2% for AGIs over 100k)
Net capital gain/loss: +$6,177 (reported on 15.5% of returns)
Here:
+$6,177
State:
+$8,532
(% of AGI for various income ranges: -1.7% for AGIs below $10k, 1.2% for AGIs $10k-25k, 0.8% for AGIs $25k-50k, 0.8% for AGIs $50k-75k, 1.7% for AGIs $75k-100k, 7.7% for AGIs over 100k)
Profit/loss from business: +$7,988 (reported on 14.6% of returns)
Here:
+$7,988
State:
+$9,547
(% of AGI for various income ranges: -7.5% for AGIs below $10k, 6.3% for AGIs $10k-25k, 2.7% for AGIs $25k-50k, 3.1% for AGIs $50k-75k, 3.0% for AGIs $75k-100k, 2.7% for AGIs over 100k)
IRA payment deduction: $2,457 (reported on 1.7% of returns)
49055:
$2,457
Michigan:
$2,875
Total itemized deductions: $14,578 (22% of AGI, reported on 30.4% of returns)
Here:
$14,578
State:
$18,509
Here:
21.6% of AGI
State:
20.7% of AGI
(% of AGI for various income ranges: 15.5% for AGIs below $10k, 8.9% for AGIs $10k-25k, 11.1% for AGIs $25k-50k, 11.9% for AGIs $50k-75k, 13.2% for AGIs $75k-100k, 11.2% for AGIs over 100k)
Charity contributions deductions: $2,340 (3% of AGI, reported on 23.8% of returns)
Here:
$2,340
State:
$3,365
Here:
3.2% of AGI
State:
3.6% of AGI
(% of AGI for various income ranges: 0.8% for AGIs below $10k, 1.0% for AGIs $10k-25k, 0.9% for AGIs $25k-50k, 1.6% for AGIs $50k-75k, 1.6% for AGIs $75k-100k, 2.1% for AGIs over 100k)
Total tax: $5,149 (reported on 72.4% of returns)
49055:
$5,149
State:
$7,691
(% of AGI for various income ranges: 3.1% for AGIs below $10k, 3.9% for AGIs $10k-25k, 6.4% for AGIs $25k-50k, 8.3% for AGIs $50k-75k, 10.2% for AGIs $75k-100k, 17.8% for AGIs over 100k)
Earned income credit: $1,694 (reported on 15.0% of returns)
Here:
$1,694
State:
$1,737
Percentage of individuals using paid preparers for their 2004 taxes: 58.0%
Here:
58%
State:
60%
(% for various income ranges: 49.8% for AGIs below $10k, 58.4% for AGIs $10k-25k, 60.5% for AGIs $25k-50k, 61.0% for AGIs $50k-75k, 57.8% for AGIs $75k-100k, 69.1% for AGIs over 100k)
Household received Food Stamps/SNAP in the past 12 months: 499 Household did not receive Food Stamps/SNAP in the past 12 months: 2,104
Women who had a birth in the past 12 months: 40 (41 now married, 0 unmarried) Women who did not have a birth in the past 12 months: 1,206 (515 now married, 689 unmarried)
Housing units in zip code 49055 with a mortgage: 1,269 (136 second mortgage, 10 home equity loan, 93 both second mortgage and home equity loan) Houses without a mortgage: 21
Median monthly owner costs for units with a mortgage: $1,281 Median monthly owner costs for units without a mortgage: $473
Residents with income below the poverty level in 2022:
This zip code:
15.5%
Whole state:
13.4%
Residents with income below 50% of the poverty level in 2022:
This zip code:
11.2%
Whole state:
6.9%
Median number of rooms in houses and condos:
Here:
6.0
State:
6.5
Median number of rooms in apartments:
Here:
5.2
State:
4.3
Notable locations in this zip code not listed on our city pages
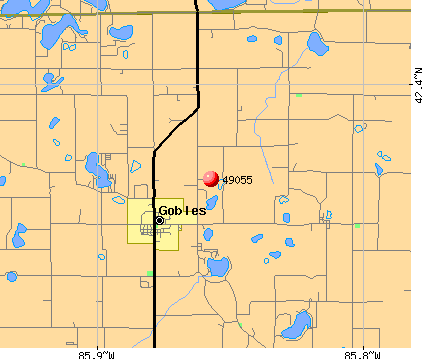
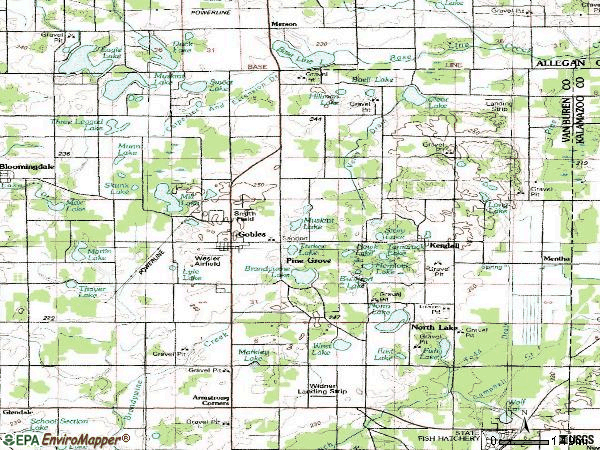
Notable locations in zip code 49055: Har-Lou Golf Course (A), Timber Ridge Ski Area (B), North Point Hall (C), Gobles - Pine Grove Fire Department (D), Gobles Police Department (E), Gobles Library (F), Coloma Emergency Medical Services Medical Transport Station 4 (G). Display/hide their locations on the map
Churches in zip code 49055 include: Covey Hill Church (A), Merson Church (B), Kendall United Methodist Church (C), Finley Faith Tabernacle Church (D), Calvary Baptist Church (E), Saint Judes Catholic Church (F), Kalhaven Community Church (G), United Methodist Church (H), Bethany Presbyterian Church (I). Display/hide their locations on the map
Lakes: Martin Lake (A), Markley Lake (B), Turkey Lake (C), Lyle Lake (D), Twin Lakes (E), Long Lake (F), West Lake (G), North Lake (H). Display/hide their locations on the map
In group quarters: 20 (-1 institutionalized population)
Size of family households: 1,114 2-persons, 423 3-persons, 227 4-persons, 92 5-persons, 48 6-persons, 24 7-or-more-persons
Size of nonfamily households: 579 1-person, 75 2-persons, 6 3-persons
549 married couples with children.
269 single-parent households (22 men, 247 women).
97.0% of residents of 49055 zip code speak English at home.
1.7% of residents speak Spanish at home (85% very well, 15% not well).
0.4% of residents speak other Indo-European language at home (78% very well, 15% well, 7% not well).
0.6% of residents speak Asian or Pacific Island language at home (88% very well, 12% not well).
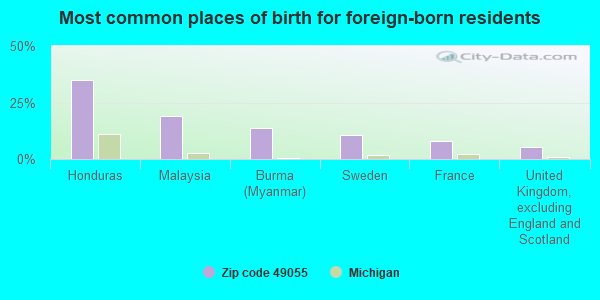
Foreign born population: 37 (0.6%) (60.7% of them are naturalized citizens)
This zip code:
0.6%
Whole state:
6.9%
35%Honduras
19%Malaysia
14%Burma (Myanmar)
11%Sweden
8%France
5%United Kingdom, excluding England and Scotland
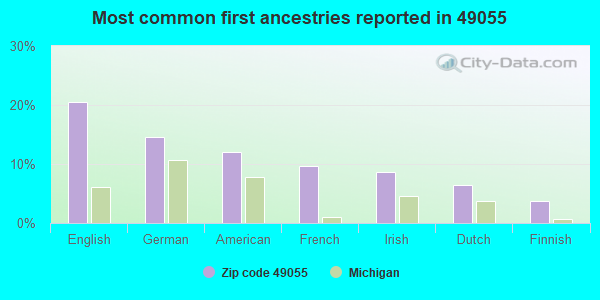
21%English
15%German
12%American
10%French
9%Irish
7%Dutch
4%Finnish
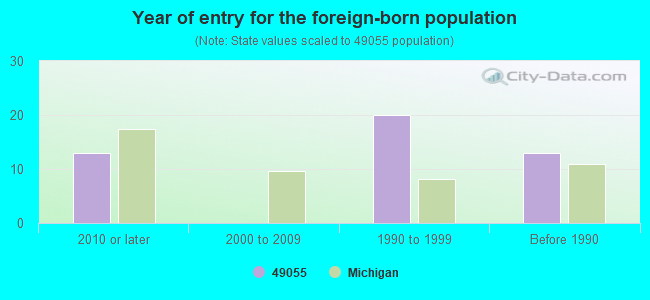
Year of entry for the foreign-born population
132010 or later
02000 to 2009
201990 to 1999
13Before 1990
Facilities with environmental interests located in this zip code:
GOBLES ELEMENTARY SCHOOL (409 N. STATE STREET in GOBLES, MI)
(National Center for Education Statistics) - STATE ID-01429 Organizations: GOBLES PUBLIC SCHOOL DISTRICT (SCHOOL DISTRICT)
GOBLES HIGH SCHOOL (409 N. STATE STREET in GOBLES, MI)
(National Center for Education Statistics) - STATE ID-01430 Organizations: GOBLES PUBLIC SCHOOL DISTRICT (SCHOOL DISTRICT)
BOOK A L (RT 2 in GOBLES, MI)
(Resource Conservation and Recovery Act (tracking hazardous waste))
FRONTIER PARTY STORE (101 S STATE ST in GOBLES, MI)
(Resource Conservation and Recovery Act (tracking hazardous waste)) Organizations: BOLTJES DAVID (CONTACT/OWNER)
ALLOY STEEL TREATING CO INC (22138 M-40 HIGHWAY in GOBLES, MI)
CRITERIA AND HAZARDOUS AIR POLLUTANT INVENTORY (Inventory of air pollution sources) TRI REPORTER (Tracking of toxic chemicals releasing facilities) Business SIC classification: METAL HEAT TREATING
GOBLES CITY DUMP (35TH ST in GOBLES, MI)
CRITERIA AND HAZARDOUS AIR POLLUTANT INVENTORY (Inventory of air pollution sources) Business SIC classification: REFUSE SYSTEMS Business NAICS classification: SOLID WASTE LANDFILL.
Housing units lacking complete plumbing facilities: 1.6% Housing units lacking complete kitchen facilities: 2.1%
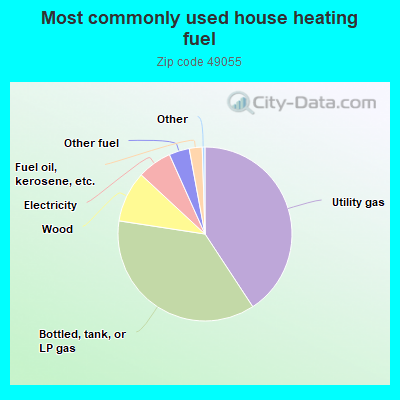
40.8%Utility gas
36.7%Bottled, tank, or LP gas
9.5%Wood
6.4%Electricity
3.8%Other fuel
2.4%Fuel oil, kerosene, etc.
Population in 1990: 4,476. Population change in the 1990s: +1,735 (+38.8%).
Place of birth for U.S.-born residents:
This state: 4,878
Northeast: 156
Midwest: 558
South: 225
West: 328
64% of the 49055 zip code residents lived in the same house 5 years ago. Out of people who lived in different houses, 47% lived in this county. Out of people who lived in different counties, 50% lived in Michigan.
89% of the 49055 zip code residents lived in the same house 1 year ago. Out of people who lived in different houses, 62% moved from this county. Out of people who lived in different houses, 32% moved from different county within same state. Out of people who lived in different houses, 3% moved from different state.
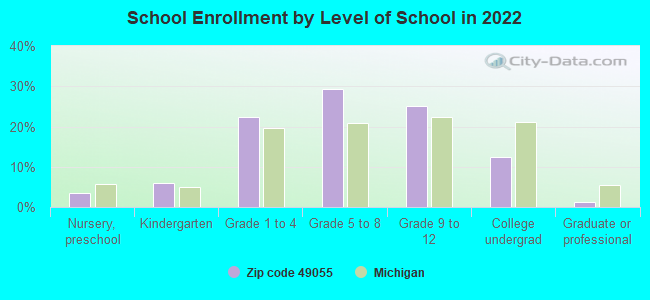
Private vs. public school enrollment:
Students in private schools in grades 1 to 8 (elementary and middle school): 95
Here:
15.0%
Michigan:
12.4%
Students in private schools in grades 9 to 12 (high school): 45
Here:
14.8%
Michigan:
9.8%
Students in private undergraduate colleges: 6
Here:
4.2%
Michigan:
14.9%
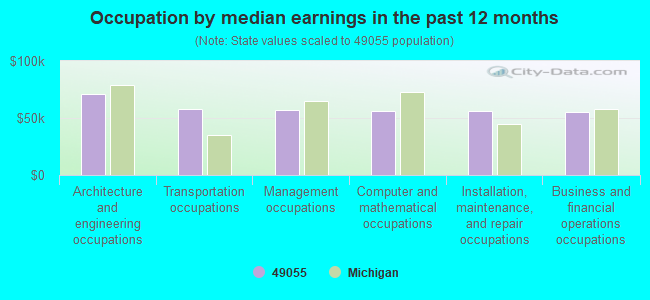
Occupation by median earnings in the past 12 months ($)
71,121Architecture and engineering occupations
57,974Transportation occupations
57,428Management occupations
56,500Computer and mathematical occupations
56,047Installation, maintenance, and repair occupations
54,889Business and financial operations occupations
Top industries in this zip code by the number of employees in 2005:
Arts, Entertainment, and Recreation: Skiing Facilities (250-499 employees: 1 establishment)
Accommodation and Food Services: Full-Service Restaurants (20-49: 1, 10-19: 2)
Accommodation and Food Services: Snack and Nonalcoholic Beverage Bars (20-49: 1)
Construction: New Single-Family Housing Construction (except Operative Builders) (10-19: 1, 1-4: 3)
Construction: Plumbing, Heating, and Air-Conditioning Contractors (5-9: 2, 1-4: 1)
People in group quarters in 2010:
21 people in group homes intended for adults
People in group quarters in 2000:
61 people in agriculture workers' dormitories on farms
7 people in other noninstitutional group quarters
2 people in other group homes
Fatal accident statistics in 2012:
Fatal accident count: 1
Vehicles involved in fatal accidents: 1
Fatal accidents caused by drunken drivers: 0
Fatalities: 1
Persons involved in fatal accidents: 1
Pedestrians involved in fatal accidents: 0
Fatal accident statistics in 2011:
Fatal accident count: 3
Vehicles involved in fatal accidents: 4
Fatal accidents caused by drunken drivers: 3
Fatalities: 3
Persons involved in fatal accidents: 7
Pedestrians involved in fatal accidents: 0
Home Mortgage Disclosure Act Aggregated Statistics For Year 2009 (Based on 4 partial tracts)
A) FHA, FSA/RHS & VA Home Purchase Loans
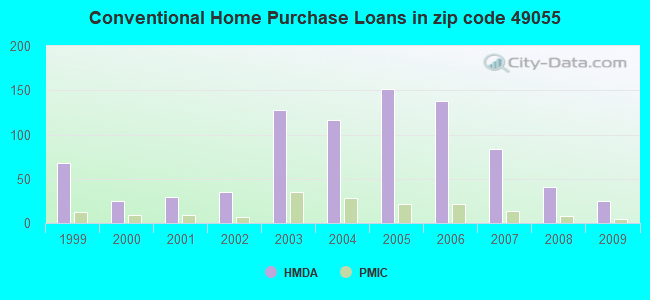
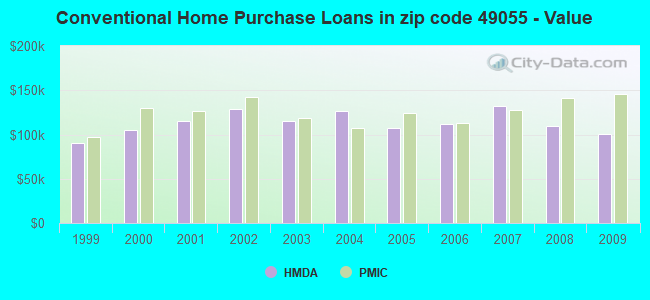
B) Conventional Home Purchase Loans
C) Refinancings
D) Home Improvement Loans
F) Non-occupant Loans on < 5 Family Dwellings (A B C & D)
G) Loans On Manufactured Home Dwelling (A B C & D)
Number
Average Value
Number
Average Value
Number
Average Value
Number
Average Value
Number
Average Value
Number
Average Value
LOANS ORIGINATED
38
$114,718
25
$100,660
215
$134,346
12
$57,556
17
$155,705
24
$91,495
APPLICATIONS APPROVED, NOT ACCEPTED
3
$107,697
2
$80,720
21
$150,641
2
$9,025
1
$314,220
2
$76,270
APPLICATIONS DENIED
6
$85,858
6
$56,808
103
$125,107
16
$34,475
9
$137,259
17
$72,693
APPLICATIONS WITHDRAWN
6
$82,253
1
$168,060
52
$145,792
3
$61,647
5
$203,418
2
$54,320
FILES CLOSED FOR INCOMPLETENESS
1
$110,510
0
$0
8
$113,612
0
$0
0
$0
1
$54,740
Aggregated Statistics For Year 2008 (Based on 4 partial tracts)
A) FHA, FSA/RHS & VA Home Purchase Loans
B) Conventional Home Purchase Loans
C) Refinancings
D) Home Improvement Loans
F) Non-occupant Loans on < 5 Family Dwellings (A B C & D)
G) Loans On Manufactured Home Dwelling (A B C & D)
Number
Average Value
Number
Average Value
Number
Average Value
Number
Average Value
Number
Average Value
Number
Average Value
LOANS ORIGINATED
28
$101,499
41
$109,834
127
$142,742
29
$56,903
10
$209,437
20
$69,442
APPLICATIONS APPROVED, NOT ACCEPTED
2
$83,135
5
$58,046
22
$114,435
6
$84,963
0
$0
2
$86,590
APPLICATIONS DENIED
15
$85,401
21
$115,389
94
$109,319
20
$52,934
2
$113,955
20
$76,473
APPLICATIONS WITHDRAWN
4
$107,602
6
$86,067
35
$117,269
3
$124,590
1
$60,370
4
$90,590
FILES CLOSED FOR INCOMPLETENESS
1
$115,300
4
$150,140
10
$134,455
0
$0
0
$0
0
$0
Aggregated Statistics For Year 2007 (Based on 4 partial tracts)
A) FHA, FSA/RHS & VA Home Purchase Loans
B) Conventional Home Purchase Loans
C) Refinancings
D) Home Improvement Loans
F) Non-occupant Loans on < 5 Family Dwellings (A B C & D)
G) Loans On Manufactured Home Dwelling (A B C & D)
Number
Average Value
Number
Average Value
Number
Average Value
Number
Average Value
Number
Average Value
Number
Average Value
LOANS ORIGINATED
12
$136,621
84
$132,541
194
$111,725
34
$56,651
30
$109,256
38
$84,331
APPLICATIONS APPROVED, NOT ACCEPTED
1
$57,040
8
$142,790
59
$127,826
8
$101,218
2
$100,700
5
$87,680
APPLICATIONS DENIED
2
$90,095
25
$77,328
162
$122,215
49
$47,407
12
$81,190
29
$90,071
APPLICATIONS WITHDRAWN
3
$87,850
12
$98,977
56
$147,022
17
$68,897
6
$87,902
8
$48,146
FILES CLOSED FOR INCOMPLETENESS
0
$0
2
$53,250
13
$184,470
1
$124,170
3
$43,500
1
$56,790
Aggregated Statistics For Year 2006 (Based on 4 partial tracts)
A) FHA, FSA/RHS & VA Home Purchase Loans
B) Conventional Home Purchase Loans
C) Refinancings
D) Home Improvement Loans
F) Non-occupant Loans on < 5 Family Dwellings (A B C & D)
G) Loans On Manufactured Home Dwelling (A B C & D)
Number
Average Value
Number
Average Value
Number
Average Value
Number
Average Value
Number
Average Value
Number
Average Value
LOANS ORIGINATED
24
$92,172
138
$112,328
228
$104,060
58
$35,556
37
$123,178
43
$65,797
APPLICATIONS APPROVED, NOT ACCEPTED
0
$0
25
$94,935
49
$97,216
6
$23,315
2
$133,860
9
$69,970
APPLICATIONS DENIED
3
$85,983
38
$90,059
235
$103,541
33
$56,773
10
$106,328
40
$79,890
APPLICATIONS WITHDRAWN
2
$99,000
13
$107,205
85
$106,175
10
$64,823
7
$109,916
14
$91,582
FILES CLOSED FOR INCOMPLETENESS
1
$41,810
1
$139,920
26
$138,493
0
$0
0
$0
2
$37,405
Aggregated Statistics For Year 2005 (Based on 4 partial tracts)
A) FHA, FSA/RHS & VA Home Purchase Loans
B) Conventional Home Purchase Loans
C) Refinancings
D) Home Improvement Loans
E) Loans on Dwellings For 5+ Families
F) Non-occupant Loans on < 5 Family Dwellings (A B C & D)
G) Loans On Manufactured Home Dwelling (A B C & D)
Number
Average Value
Number
Average Value
Number
Average Value
Number
Average Value
Number
Average Value
Number
Average Value
Number
Average Value
LOANS ORIGINATED
25
$104,917
151
$107,309
272
$113,417
43
$68,715
0
$0
29
$130,674
37
$68,399
APPLICATIONS APPROVED, NOT ACCEPTED
2
$62,100
25
$113,457
61
$98,967
10
$107,524
0
$0
9
$132,077
16
$82,252
APPLICATIONS DENIED
5
$105,414
43
$88,750
272
$108,011
32
$48,801
1
$136,840
7
$95,866
40
$95,075
APPLICATIONS WITHDRAWN
6
$99,253
29
$84,268
135
$121,634
19
$100,145
0
$0
12
$66,501
16
$102,638
FILES CLOSED FOR INCOMPLETENESS
0
$0
6
$90,687
48
$109,788
4
$113,732
0
$0
2
$71,800
5
$103,568
Aggregated Statistics For Year 2004 (Based on 4 partial tracts)
A) FHA, FSA/RHS & VA Home Purchase Loans
B) Conventional Home Purchase Loans
C) Refinancings
D) Home Improvement Loans
F) Non-occupant Loans on < 5 Family Dwellings (A B C & D)
G) Loans On Manufactured Home Dwelling (A B C & D)
Number
Average Value
Number
Average Value
Number
Average Value
Number
Average Value
Number
Average Value
Number
Average Value
LOANS ORIGINATED
31
$100,227
116
$126,651
321
$109,216
42
$45,490
29
$136,151
52
$72,441
APPLICATIONS APPROVED, NOT ACCEPTED
7
$100,859
18
$97,704
66
$102,367
4
$57,325
3
$80,233
17
$82,834
APPLICATIONS DENIED
3
$64,933
24
$92,218
266
$109,625
29
$56,008
16
$96,806
54
$88,941
APPLICATIONS WITHDRAWN
4
$81,195
17
$106,665
95
$104,067
10
$25,738
3
$145,920
15
$88,114
FILES CLOSED FOR INCOMPLETENESS
0
$0
2
$138,010
49
$105,350
2
$14,240
1
$82,360
6
$112,880
Aggregated Statistics For Year 2003 (Based on 4 partial tracts)
A) FHA, FSA/RHS & VA Home Purchase Loans
B) Conventional Home Purchase Loans
C) Refinancings
D) Home Improvement Loans
F) Non-occupant Loans on < 5 Family Dwellings (A B C & D)
Number
Average Value
Number
Average Value
Number
Average Value
Number
Average Value
Number
Average Value
LOANS ORIGINATED
29
$107,261
128
$115,447
628
$107,140
29
$28,241
43
$120,870
APPLICATIONS APPROVED, NOT ACCEPTED
1
$90,040
10
$101,824
108
$105,589
4
$18,338
2
$56,900
APPLICATIONS DENIED
1
$127,970
28
$71,017
242
$100,729
41
$34,012
9
$104,471
APPLICATIONS WITHDRAWN
5
$115,898
14
$103,406
132
$95,785
0
$0
4
$92,585
FILES CLOSED FOR INCOMPLETENESS
0
$0
5
$95,352
26
$113,535
1
$38,010
2
$62,155
Aggregated Statistics For Year 2002 (Based on 2 partial tracts)
A) FHA, FSA/RHS & VA Home Purchase Loans
B) Conventional Home Purchase Loans
C) Refinancings
D) Home Improvement Loans
F) Non-occupant Loans on < 5 Family Dwellings (A B C & D)
Number
Average Value
Number
Average Value
Number
Average Value
Number
Average Value
Number
Average Value
LOANS ORIGINATED
4
$123,040
35
$129,318
102
$113,974
7
$34,314
6
$105,048
APPLICATIONS APPROVED, NOT ACCEPTED
0
$0
2
$137,365
14
$114,964
1
$71,620
1
$50,650
APPLICATIONS DENIED
0
$0
3
$95,243
29
$97,028
3
$31,803
1
$69,070
APPLICATIONS WITHDRAWN
0
$0
1
$144,020
14
$102,137
1
$29,670
0
$0
FILES CLOSED FOR INCOMPLETENESS
0
$0
1
$73,160
5
$128,820
0
$0
0
$0
Aggregated Statistics For Year 2001 (Based on 2 partial tracts)
A) FHA, FSA/RHS & VA Home Purchase Loans
B) Conventional Home Purchase Loans
C) Refinancings
D) Home Improvement Loans
F) Non-occupant Loans on < 5 Family Dwellings (A B C & D)
Number
Average Value
Number
Average Value
Number
Average Value
Number
Average Value
Number
Average Value
LOANS ORIGINATED
3
$114,343
29
$115,110
81
$99,876
11
$17,115
2
$79,555
APPLICATIONS APPROVED, NOT ACCEPTED
0
$0
3
$121,590
9
$93,538
2
$44,125
0
$0
APPLICATIONS DENIED
0
$0
5
$62,876
26
$84,985
5
$33,050
1
$69,580
APPLICATIONS WITHDRAWN
0
$0
2
$54,355
16
$98,467
1
$3,580
1
$57,550
FILES CLOSED FOR INCOMPLETENESS
0
$0
0
$0
5
$91,064
0
$0
0
$0
Aggregated Statistics For Year 2000 (Based on 2 partial tracts)
A) FHA, FSA/RHS & VA Home Purchase Loans
B) Conventional Home Purchase Loans
C) Refinancings
D) Home Improvement Loans
F) Non-occupant Loans on < 5 Family Dwellings (A B C & D)
Number
Average Value
Number
Average Value
Number
Average Value
Number
Average Value
Number
Average Value
LOANS ORIGINATED
2
$78,530
25
$105,584
29
$74,747
10
$25,733
2
$82,625
APPLICATIONS APPROVED, NOT ACCEPTED
0
$0
4
$78,850
8
$59,729
2
$37,220
0
$0
APPLICATIONS DENIED
0
$0
7
$64,790
20
$64,526
8
$30,696
1
$37,600
APPLICATIONS WITHDRAWN
0
$0
2
$50,905
6
$62,032
1
$34,280
0
$0
FILES CLOSED FOR INCOMPLETENESS
0
$0
1
$85,690
2
$80,575
0
$0
0
$0
Aggregated Statistics For Year 1999 (Based on 2 partial tracts)
A) FHA, FSA/RHS & VA Home Purchase Loans
B) Conventional Home Purchase Loans
C) Refinancings
D) Home Improvement Loans
F) Non-occupant Loans on < 5 Family Dwellings (A B C & D)
Detailed PMIC statistics for the following Tracts:0101.00
, 0109.00
2002 - 2018 National Fire Incident Reporting System (NFIRS) incidents
According to the data from the years 2002 - 2018 the average number of fire incidents per year is 18. The highest number of fire incidents - 32 took place in 2010, and the least - 5 in 2013. The data has an increasing trend.
When looking into fire subcategories, the most incidents belonged to: Structure Fires (46.3%), and Outside Fires (38.2%).
Fire incident types reported to NFIRS in Zip Code 49055


 Nearest zip codes: 49026, 49079, 49078, 49071, 49010, 49009.


 According to the data from the years 2002 - 2018 the average number of fire incidents per year is 18. The highest number of fire incidents - 32 took place in 2010, and the least - 5 in 2013. The data has an increasing trend.
 When looking into fire subcategories, the most incidents belonged to: Structure Fires (46.3%), and Outside Fires (38.2%).