Estimated zip code population in 2022: 2,169 Zip code population in 2010: 2,451 Zip code population in 2000: 2,230
Houses and condos: 894 Renter-occupied apartments: 72
% of renters here:
8%
State:
27%
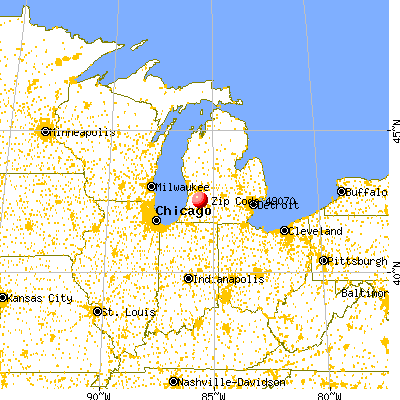
March 2022 cost of living index in zip code 49070: 80.5 (low, U.S. average is 100)
Land area: 26.4 sq. mi. Water area: 0.6 sq. mi.
Population density: 82 people per square mile
(very low).
OSM Map
General Map
Google Map
MSN Map
OSM Map
General Map
Google Map
MSN Map
OSM Map
General Map
Google Map
MSN Map
OSM Map
General Map
Google Map
MSN Map
Please wait while loading the map...
Real estate property taxes paid for housing units in 2022:
This zip code:
1.3% ($2,549)
Michigan:
1.2% ($2,746)
Median real estate property taxes paid for housing units with mortgages in 2022: $2,309 (1.2%) Median real estate property taxes paid for housing units with no mortgage in 2022: $2,925 (1.5%)
Business Search- 14 Million verified businesses
Males: 1,119
(51.6%)
Females: 1,050
(48.4%)
For population 25 years and over in 49070:
High school or higher: 93.1%
Bachelor's degree or higher: 14.0%
Graduate or professional degree: 3.7%
Unemployed: 3.5%
Mean travel time to work (commute): 25.8 minutes
For population 15 years and over in 49070:
Never married: 27.1%
Now married: 55.7%
Separated: 0.7%
Widowed: 1.9%
Divorced: 14.6%
Zip code 49070 compared to state average:
Black race population percentage significantly below state average.
Hispanic race population percentage below state average.
Foreign-born population percentage significantly below state average.
Renting percentage significantly below state average.
Length of stay since moving in significantly above state average.
Number of college students significantly below state average.
Percentage of population with a bachelor's degree or higher significantly below state average.
Estimated median house/condo value in 2022: $191,370
49070:
$191,370
Michigan:
$224,400
According to our research of Michigan and other state lists, there were 9 registered sex offenders living in 49070 zip code as of May 28, 2024. The ratio of all residents to sex offenders in zip code 49070 is 271 to 1. The ratio of registered sex offenders to all residents in this zip code is near the state average.
Median resident age:
This zip code:
40.8 years
Michigan median age:
40.3 years
Average household size:
This zip code:
2.5 people
Michigan:
2.4 people
Averages for the 2020 tax year for zip code 49070, filed in 2021:
Average Adjusted Gross Income (AGI) in 2020: $56,460 (Individual Income Tax Returns)
Here:
$56,460
State:
$68,945
Salary/wage: $48,462 (reported on 80.6% of returns)
Here:
$48,462
State:
$57,142
(% of AGI for various income ranges: 1044.1% for AGIs below $25k, 3401.3% for AGIs $25k-50k, 6015.9% for AGIs $50k-75k, 10048.9% for AGIs $75k-100k, 16672.7% for AGIs $100k-200k)
Taxable interest for individuals: $597 (reported on 31.5% of returns)
This zip code:
$597
Michigan:
$1,630
(% of AGI for various income ranges: 16.9% for AGIs below $25k, 10.9% for AGIs $25k-50k, 27.1% for AGIs $50k-75k, 42.2% for AGIs $75k-100k, 68.2% for AGIs $100k-200k)
Ordinary dividends: $3,059 (reported on 13.7% of returns)
Here:
$3,059
State:
$6,972
(% of AGI for various income ranges: 9.7% for AGIs below $25k, 17.0% for AGIs $25k-50k, 55.9% for AGIs $50k-75k, 35.6% for AGIs $75k-100k, 296.4% for AGIs $100k-200k)
Net capital gain/loss in AGI: +$10,893 (reported on 12.1% of returns)
Here:
+$10,893
State:
+$20,064
(% of AGI for various income ranges: 5.2% for AGIs below $25k, 45.2% for AGIs $25k-50k, 104.7% for AGIs $50k-75k, 84.4% for AGIs $75k-100k, 1146.4% for AGIs $100k-200k)
Profit/loss from business: +$10,882 (reported on 13.7% of returns)
Here:
+$10,882
State:
+$11,172
(% of AGI for various income ranges: 130.7% for AGIs below $25k, 73.0% for AGIs $25k-50k, 231.2% for AGIs $50k-75k, 387.8% for AGIs $75k-100k, 510.0% for AGIs $100k-200k)
Taxable individual retirement arrangement distribution: $15,669 (reported on 10.5% of returns)
49070:
$15,669
Michigan:
$19,803
(% of AGI for various income ranges: 69.7% for AGIs below $25k, 175.2% for AGIs $25k-50k, 511.8% for AGIs $50k-75k, 510.9% for AGIs $100k-200k)
Total itemized deductions: $45,900 (reported on 1.6% of returns)
Here:
$45,900
State:
$34,117
(% of AGI for various income ranges: 540.0% for AGIs $50k-75k)
Taxes paid: $9,150 (reported on 1.6% of returns)
49070:
$9,150
State:
$7,972
(% of AGI for various income ranges: 203.3% for AGIs $75k-100k)
Earned income credit: $2,262 (reported on 12.9% of returns)
Here:
$2,262
State:
$2,251
(% of AGI for various income ranges: 74.1% for AGIs below $25k, 63.9% for AGIs $25k-50k)
Percentage of individuals using paid preparers for their 2020 taxes: 94.4%
Here:
94%
State:
93%
(% for various income ranges: 92.9% for AGIs below $25k, 93.1% for AGIs $25k-50k, 95.5% for AGIs $50k-75k, 100.0% for AGIs $75k-100k, 93.8% for AGIs $100k-200k, 100.0% for AGIs over 200k)
Averages for the 2012 tax year for zip code 49070, filed in 2013:
Average Adjusted Gross Income (AGI) in 2012: $44,478 (Individual Income Tax Returns)
Here:
$44,478
State:
$55,609
Salary/wage: $39,424 (reported on 85.6% of returns)
Here:
$39,424
State:
$46,782
(% of AGI for various income ranges: 69.2% for AGIs below $25k, 80.7% for AGIs $25k-50k, 77.1% for AGIs $50k-75k, 80.6% for AGIs $75k-100k, 68.2% for AGIs $100k-200k)
Taxable interest for individuals: $897 (reported on 30.6% of returns)
This zip code:
$897
Michigan:
$1,491
(% of AGI for various income ranges: 0.9% for AGIs below $25k, 0.7% for AGIs $25k-50k, 0.9% for AGIs $50k-75k, 0.2% for AGIs $75k-100k, 0.4% for AGIs $100k-200k)
Ordinary dividends: $1,459 (reported on 15.3% of returns)
Here:
$1,459
State:
$6,225
(% of AGI for various income ranges: 0.8% for AGIs below $25k, 0.8% for AGIs $25k-50k, 0.6% for AGIs $50k-75k, 0.1% for AGIs $75k-100k, 0.3% for AGIs $100k-200k)
Net capital gain/loss in AGI: +$815 (reported on 11.7% of returns)
Here:
+$815
State:
+$9,326
(% of AGI for various income ranges: 0.3% for AGIs $25k-50k, 0.4% for AGIs $50k-75k, 0.3% for AGIs $100k-200k)
Profit/loss from business: +$7,393 (reported on 13.5% of returns)
Here:
+$7,393
State:
+$11,523
(% of AGI for various income ranges: 5.7% for AGIs below $25k, 2.4% for AGIs $25k-50k, 3.5% for AGIs $50k-75k, 1.5% for AGIs $75k-100k)
Taxable individual retirement arrangement distribution: $10,446 (reported on 11.7% of returns)
49070:
$10,446
Michigan:
$15,298
(% of AGI for various income ranges: 4.5% for AGIs below $25k, 2.1% for AGIs $25k-50k, 3.7% for AGIs $50k-75k, 4.7% for AGIs $75k-100k)
Total itemized deductions: $16,582 (21% of AGI, reported on 25.2% of returns)
Here:
$16,582
State:
$21,628
Here:
21.1% of AGI
State:
18.4% of AGI
(% of AGI for various income ranges: 9.7% for AGIs $25k-50k, 7.7% for AGIs $50k-75k, 12.9% for AGIs $75k-100k, 11.9% for AGIs $100k-200k)
Charity contributions: $4,186 (reported on 18.9% of returns)
Here:
$4,186
State:
$4,225
(% of AGI for various income ranges: 0.7% for AGIs $25k-50k, 1.4% for AGIs $50k-75k, 2.5% for AGIs $75k-100k, 3.5% for AGIs $100k-200k)
Taxes paid: $5,346 (reported on 25.2% of returns)
49070:
$5,346
State:
$8,327
(% of AGI for various income ranges: 2.4% for AGIs $25k-50k, 2.3% for AGIs $50k-75k, 4.2% for AGIs $75k-100k, 4.7% for AGIs $100k-200k)
Earned income credit: $2,021 (reported on 17.1% of returns)
Here:
$2,021
State:
$2,306
(% of AGI for various income ranges: 5.4% for AGIs below $25k, 1.2% for AGIs $25k-50k)
Percentage of individuals using paid preparers for their 2012 taxes: 64.9%
Here:
65%
State:
57%
(% for various income ranges: 62.5% for AGIs below $25k, 68.8% for AGIs $25k-50k, 70.0% for AGIs $50k-75k, 54.5% for AGIs $75k-100k, 62.5% for AGIs $100k-200k)
Averages for the 2004 tax year for zip code 49070, filed in 2005:
Average Adjusted Gross Income (AGI) in 2004: $37,507 (Individual Income Tax Returns)
Here:
$37,507
State:
$48,204
Salary/wage: $35,170 (reported on 87.6% of returns)
Here:
$35,170
State:
$42,791
(% of AGI for various income ranges: 103.0% for AGIs below $10k, 74.3% for AGIs $10k-25k, 82.1% for AGIs $25k-50k, 86.1% for AGIs $50k-75k, 84.0% for AGIs $75k-100k, 74.3% for AGIs over 100k)
Taxable interest for individuals: $1,016 (reported on 38.3% of returns)
This zip code:
$1,016
Michigan:
$1,725
(% of AGI for various income ranges: 6.3% for AGIs below $10k, 1.8% for AGIs $10k-25k, 1.4% for AGIs $25k-50k, 0.3% for AGIs $50k-75k, 0.5% for AGIs $75k-100k, 1.2% for AGIs over 100k)
Taxable dividends: $1,118 (reported on 18.7% of returns)
Here:
$1,118
State:
$3,420
(% of AGI for various income ranges: 3.4% for AGIs below $10k, 1.2% for AGIs $10k-25k, 0.4% for AGIs $25k-50k, 0.1% for AGIs $50k-75k, 0.2% for AGIs $75k-100k, 1.3% for AGIs over 100k)
Net capital gain/loss: +$4,649 (reported on 16.3% of returns)
Here:
+$4,649
State:
+$8,532
(% of AGI for various income ranges: 0.6% for AGIs below $10k, 0.7% for AGIs $10k-25k, 2.1% for AGIs $25k-50k, 0.6% for AGIs $50k-75k, 4.2% for AGIs $75k-100k, 3.3% for AGIs over 100k)
Profit/loss from business: +$5,065 (reported on 16.2% of returns)
Here:
+$5,065
State:
+$9,547
(% of AGI for various income ranges: 11.4% for AGIs below $10k, 6.9% for AGIs $10k-25k, 2.1% for AGIs $25k-50k, 2.6% for AGIs $50k-75k, -0.3% for AGIs $75k-100k)
IRA payment deduction: $3,073 (reported on 3.6% of returns)
49070:
$3,073
Michigan:
$2,875
Total itemized deductions: $14,592 (23% of AGI, reported on 30.2% of returns)
Here:
$14,592
State:
$18,509
Here:
22.7% of AGI
State:
20.7% of AGI
(% of AGI for various income ranges: 7.6% for AGIs $10k-25k, 9.8% for AGIs $25k-50k, 12.1% for AGIs $50k-75k, 14.6% for AGIs $75k-100k, 16.0% for AGIs over 100k)
Charity contributions deductions: $3,074 (5% of AGI, reported on 24.8% of returns)
Here:
$3,074
State:
$3,365
Here:
4.6% of AGI
State:
3.6% of AGI
(% of AGI for various income ranges: 0.7% for AGIs $10k-25k, 0.9% for AGIs $25k-50k, 1.8% for AGIs $50k-75k, 2.5% for AGIs $75k-100k, 5.4% for AGIs over 100k)
Total tax: $4,132 (reported on 75.2% of returns)
49070:
$4,132
State:
$7,691
(% of AGI for various income ranges: 3.4% for AGIs below $10k, 4.7% for AGIs $10k-25k, 6.2% for AGIs $25k-50k, 8.1% for AGIs $50k-75k, 10.0% for AGIs $75k-100k, 13.8% for AGIs over 100k)
Earned income credit: $1,768 (reported on 12.5% of returns)
Here:
$1,768
State:
$1,737
Percentage of individuals using paid preparers for their 2004 taxes: 60.5%
Here:
61%
State:
60%
(% for various income ranges: 50.2% for AGIs below $10k, 62.0% for AGIs $10k-25k, 64.5% for AGIs $25k-50k, 61.2% for AGIs $50k-75k, 63.6% for AGIs $75k-100k, 68.8% for AGIs over 100k)
Household received Food Stamps/SNAP in the past 12 months: 94 Household did not receive Food Stamps/SNAP in the past 12 months: 767
Women who had a birth in the past 12 months: 35 (26 now married, 9 unmarried) Women who did not have a birth in the past 12 months: 419 (180 now married, 239 unmarried)
Housing units in zip code 49070 with a mortgage: 409 (19 second mortgage, 19 both second mortgage and home equity loan) Median monthly owner costs for units with a mortgage: $1,262 Median monthly owner costs for units without a mortgage: $626
Residents with income below the poverty level in 2022:
This zip code:
12.1%
Whole state:
13.4%
Residents with income below 50% of the poverty level in 2022:
This zip code:
3.9%
Whole state:
6.9%
Median number of rooms in houses and condos:
Here:
6.5
State:
6.5
Median number of rooms in apartments:
Here:
4.6
State:
4.3
Notable locations in this zip code not listed on our city pages
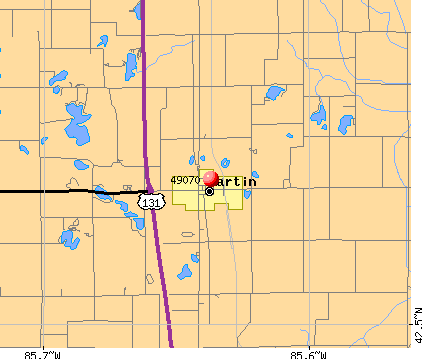
Notable locations in zip code 49070: Martin US 131 Raceway (A), Martin Station (B), Martin Fire Department (C), Wayland Area Ambulance Service (D), Martin Township Library (E). Display/hide their locations on the map
Churches in zip code 49070 include: East Martin Christian Reformed Church (A), River of Life Church (B), Martin Reformed Church (C), Martin United Methodist Church (D). Display/hide their locations on the map
Size of family households: 326 2-persons, 120 3-persons, 104 4-persons, 39 5-persons, 21 6-persons, 13 7-or-more-persons
Size of nonfamily households: 155 1-person, 81 2-persons
370 married couples with children.
105 single-parent households (53 men, 52 women).
96.4% of residents of 49070 zip code speak English at home.
3.6% of residents speak Spanish at home (21% very well, 3% well, 65% not well, 11% not at all).
0.2% of residents speak Asian or Pacific Island language at home (100% well).
Foreign born population: 52 (2.4%) (37.0% of them are naturalized citizens)
This zip code:
2.4%
Whole state:
6.9%
51%El Salvador
21%Honduras
6%Indonesia
33%Dutch
11%English
11%American
11%Scandinavian
6%German
4%Irish
4%European
Year of entry for the foreign-born population
272010 or later
12000 to 2009
91990 to 1999
19Before 1990
Facilities with environmental interests located in this zip code:
MI DEPT/STATE POLICE (1544 10TH ST in MARTIN, MI)
(Resource Conservation and Recovery Act (tracking hazardous waste)) Alternative names: MI DEPT/STATE POLICE (E)
Housing units lacking complete kitchen facilities: 1.5%
54.4%Utility gas
15.6%Bottled, tank, or LP gas
10.3%Fuel oil, kerosene, etc.
7.0%Other fuel
6.2%Electricity
6.2%Wood
0.6%No fuel used
Population in 1990: 2,366.
Place of birth for U.S.-born residents:
This state: 1,911
Northeast: 9
Midwest: 90
South: 71
West: 25
64% of the 49070 zip code residents lived in the same house 5 years ago. Out of people who lived in different houses, 71% lived in this county. Out of people who lived in different counties, 50% lived in Michigan.
96% of the 49070 zip code residents lived in the same house 1 year ago. Out of people who lived in different houses, 51% moved from this county. Out of people who lived in different houses, 35% moved from different county within same state. Out of people who lived in different houses, 8% moved from different state. Out of people who lived in different houses, 8% moved from abroad.
Private vs. public school enrollment:
Students in private schools in grades 1 to 8 (elementary and middle school): 25
Here:
12.7%
Michigan:
12.4%
Students in private schools in grades 9 to 12 (high school): 25
Here:
16.3%
Michigan:
9.8%
Students in private undergraduate colleges: 2
Here:
10.2%
Michigan:
14.9%
Occupation by median earnings in the past 12 months ($)
76,185Management occupations
73,801Business and financial operations occupations
72,501Architecture and engineering occupations
65,796Transportation occupations
64,464Installation, maintenance, and repair occupations
63,434Health diagnosing and treating practitioners and other technical occupations
Top industries in this zip code by the number of employees in 2005:
Other Services (except Public Administration): Religious Organizations (5-9 employees: 2 establishments, 1-4 employees: 2 establishments)
Educational Services: Elementary and Secondary Schools (5-9: 2)
Construction: Poured Concrete Foundation and Structure Contractors (5-9: 1)
Wholesale Trade: Petroleum Bulk Stations and Terminals (5-9: 1)
Finance and Insurance: Commercial Banking (5-9: 1)
Fatal accident statistics in 2013:
Fatal accident count: 1
Vehicles involved in fatal accidents: 2
Fatal accidents caused by drunken drivers: 0
Fatalities: 1
Persons involved in fatal accidents: 3
Pedestrians involved in fatal accidents: 0
Fatal accident statistics in 2012:
Fatal accident count: 1
Vehicles involved in fatal accidents: 2
Fatal accidents caused by drunken drivers: 0
Fatalities: 1
Persons involved in fatal accidents: 2
Pedestrians involved in fatal accidents: 0
Home Mortgage Disclosure Act Aggregated Statistics For Year 2003 (Based on 4 partial tracts)
A) FHA, FSA/RHS & VA Home Purchase Loans
B) Conventional Home Purchase Loans
C) Refinancings
D) Home Improvement Loans
F) Non-occupant Loans on < 5 Family Dwellings (A B C & D)
Number
Average Value
Number
Average Value
Number
Average Value
Number
Average Value
Number
Average Value
LOANS ORIGINATED
6
$120,063
44
$93,432
188
$97,119
7
$36,526
12
$105,792
APPLICATIONS APPROVED, NOT ACCEPTED
3
$116,643
3
$76,940
28
$102,079
2
$25,275
0
$0
APPLICATIONS DENIED
1
$152,330
14
$65,966
85
$89,754
4
$23,165
8
$84,206
APPLICATIONS WITHDRAWN
0
$0
4
$125,695
34
$111,604
4
$41,750
1
$64,380
FILES CLOSED FOR INCOMPLETENESS
0
$0
1
$75,550
10
$92,578
1
$7,650
1
$95,610
Aggregated Statistics For Year 2002 (Based on 4 partial tracts)
A) FHA, FSA/RHS & VA Home Purchase Loans
B) Conventional Home Purchase Loans
C) Refinancings
D) Home Improvement Loans
F) Non-occupant Loans on < 5 Family Dwellings (A B C & D)
Number
Average Value
Number
Average Value
Number
Average Value
Number
Average Value
Number
Average Value
LOANS ORIGINATED
4
$118,878
36
$119,405
127
$97,283
16
$19,142
6
$87,295
APPLICATIONS APPROVED, NOT ACCEPTED
1
$62,250
9
$77,893
20
$96,948
2
$8,285
1
$102,140
APPLICATIONS DENIED
1
$74,240
16
$60,624
45
$85,600
6
$11,655
3
$24,527
APPLICATIONS WITHDRAWN
0
$0
4
$105,490
19
$83,480
0
$0
0
$0
FILES CLOSED FOR INCOMPLETENESS
0
$0
1
$119,190
13
$109,608
0
$0
1
$52,270
Aggregated Statistics For Year 2001 (Based on 4 partial tracts)
A) FHA, FSA/RHS & VA Home Purchase Loans
B) Conventional Home Purchase Loans
C) Refinancings
D) Home Improvement Loans
F) Non-occupant Loans on < 5 Family Dwellings (A B C & D)
Number
Average Value
Number
Average Value
Number
Average Value
Number
Average Value
Number
Average Value
LOANS ORIGINATED
8
$90,380
39
$73,694
126
$86,297
23
$18,987
6
$70,660
APPLICATIONS APPROVED, NOT ACCEPTED
0
$0
10
$59,155
24
$97,697
7
$22,386
3
$44,943
APPLICATIONS DENIED
1
$149,870
41
$47,582
60
$70,958
14
$21,820
1
$96,040
APPLICATIONS WITHDRAWN
0
$0
4
$97,522
17
$83,465
0
$0
1
$60,580
FILES CLOSED FOR INCOMPLETENESS
0
$0
1
$76,490
9
$98,852
0
$0
1
$76,490
Aggregated Statistics For Year 2000 (Based on 4 partial tracts)
A) FHA, FSA/RHS & VA Home Purchase Loans
B) Conventional Home Purchase Loans
C) Refinancings
D) Home Improvement Loans
F) Non-occupant Loans on < 5 Family Dwellings (A B C & D)
Number
Average Value
Number
Average Value
Number
Average Value
Number
Average Value
Number
Average Value
LOANS ORIGINATED
5
$83,848
32
$79,860
51
$75,684
26
$24,354
6
$47,915
APPLICATIONS APPROVED, NOT ACCEPTED
1
$61,340
12
$61,142
13
$77,655
10
$21,210
1
$62,950
APPLICATIONS DENIED
1
$117,100
44
$50,598
39
$72,555
11
$14,033
0
$0
APPLICATIONS WITHDRAWN
1
$117,320
5
$67,404
14
$89,174
1
$57,400
1
$34,340
FILES CLOSED FOR INCOMPLETENESS
0
$0
1
$94,340
7
$72,459
0
$0
0
$0
Aggregated Statistics For Year 1999 (Based on 2 partial tracts)
A) FHA, FSA/RHS & VA Home Purchase Loans
B) Conventional Home Purchase Loans
C) Refinancings
D) Home Improvement Loans
F) Non-occupant Loans on < 5 Family Dwellings (A B C & D)
Detailed PMIC statistics for the following Tracts:0313.00
, 0319.00
2002 - 2018 National Fire Incident Reporting System (NFIRS) incidents
According to the data from the years 2002 - 2018 the average number of fire incidents per year is 17. The highest number of fire incidents - 27 took place in 2005, and the least - 6 in 2008. The data has an increasing trend.
When looking into fire subcategories, the most incidents belonged to: Structure Fires (44.5%), and Outside Fires (26.4%).
Fire incident types reported to NFIRS in Zip Code 49070


 Nearest zip codes: 49344, 49080, 49078, 49348, 49328, 49004.


 According to the data from the years 2002 - 2018 the average number of fire incidents per year is 17. The highest number of fire incidents - 27 took place in 2005, and the least - 6 in 2008. The data has an increasing trend.
 When looking into fire subcategories, the most incidents belonged to: Structure Fires (44.5%), and Outside Fires (26.4%).