Estimated zip code population in 2022: 2,228 Zip code population in 2010: 2,283 Zip code population in 2000: 2,155
Houses and condos: 1,021 Renter-occupied apartments: 59
% of renters here:
7%
State:
27%
March 2022 cost of living index in zip code 49339: 81.9 (low, U.S. average is 100)
Land area: 29.3 sq. mi. Water area: 1.5 sq. mi.
Population density: 76 people per square mile
(very low).
OSM Map
General Map
Google Map
MSN Map
OSM Map
General Map
Google Map
MSN Map
OSM Map
General Map
Google Map
MSN Map
OSM Map
General Map
Google Map
MSN Map
Please wait while loading the map...
Real estate property taxes paid for housing units in 2022:
This zip code:
0.9% ($2,088)
Michigan:
1.2% ($2,746)
Median real estate property taxes paid for housing units with mortgages in 2022: $2,404 (1.6%) Median real estate property taxes paid for housing units with no mortgage in 2022: $1,588 (1.7%)
Business Search- 14 Million verified businesses
Males: 1,155
(51.9%)
Females: 1,073
(48.1%)
For population 25 years and over in 49339:
High school or higher: 90.3%
Bachelor's degree or higher: 20.4%
Graduate or professional degree: 4.4%
Unemployed: 1.8%
Mean travel time to work (commute): 39.9 minutes
For population 15 years and over in 49339:
Never married: 21.2%
Now married: 66.9%
Separated: 0.0%
Widowed: 4.1%
Divorced: 7.9%
Zip code 49339 compared to state average:
Unemployed percentage below state average.
Black race population percentage significantly below state average.
Hispanic race population percentage significantly below state average.
Foreign-born population percentage significantly below state average.
Renting percentage significantly below state average.
Length of stay since moving in significantly above state average.
House age below state average.
Percentage of population with a bachelor's degree or higher below state average.
Averages for the 2020 tax year for zip code 49339, filed in 2021:
Average Adjusted Gross Income (AGI) in 2020: $65,709 (Individual Income Tax Returns)
Here:
$65,709
State:
$68,945
Salary/wage: $58,628 (reported on 79.0% of returns)
Here:
$58,628
State:
$57,142
(% of AGI for various income ranges: 921.2% for AGIs below $25k, 3550.4% for AGIs $25k-50k, 5994.3% for AGIs $50k-75k, 8714.0% for AGIs $75k-100k, 13264.2% for AGIs $100k-200k)
Taxable interest for individuals: $1,388 (reported on 34.5% of returns)
This zip code:
$1,388
Michigan:
$1,630
(% of AGI for various income ranges: 33.3% for AGIs below $25k, 16.1% for AGIs $25k-50k, 50.0% for AGIs $50k-75k, 18.0% for AGIs $75k-100k, 110.0% for AGIs $100k-200k)
Ordinary dividends: $4,516 (reported on 16.0% of returns)
Here:
$4,516
State:
$6,972
(% of AGI for various income ranges: 11.7% for AGIs below $25k, 40.4% for AGIs $25k-50k, 32.1% for AGIs $50k-75k, 193.3% for AGIs $100k-200k)
Net capital gain/loss in AGI: +$15,719 (reported on 13.4% of returns)
Here:
+$15,719
State:
+$20,064
(% of AGI for various income ranges: 1.7% for AGIs below $25k, 47.0% for AGIs $25k-50k, 220.0% for AGIs $50k-75k, 715.8% for AGIs $100k-200k)
Profit/loss from business: +$11,729 (reported on 14.3% of returns)
Here:
+$11,729
State:
+$11,172
(% of AGI for various income ranges: 121.7% for AGIs below $25k, 120.4% for AGIs $25k-50k, 47.9% for AGIs $50k-75k, 1131.7% for AGIs $100k-200k)
Taxable individual retirement arrangement distribution: $22,746 (reported on 10.9% of returns)
49339:
$22,746
Michigan:
$19,803
(% of AGI for various income ranges: 207.9% for AGIs below $25k, 475.0% for AGIs $50k-75k, 1494.2% for AGIs $100k-200k)
Total itemized deductions: $29,200 (reported on 4.2% of returns)
Here:
$29,200
State:
$34,117
(% of AGI for various income ranges: 208.7% for AGIs $25k-50k, 816.7% for AGIs $100k-200k)
Charity contributions: $8,250 (reported on 3.4% of returns)
Here:
$8,250
State:
$13,548
(% of AGI for various income ranges: 275.0% for AGIs $100k-200k)
Taxes paid: $7,860 (reported on 4.2% of returns)
49339:
$7,860
State:
$7,972
(% of AGI for various income ranges: 61.7% for AGIs $25k-50k, 209.2% for AGIs $100k-200k)
Earned income credit: $2,293 (reported on 12.6% of returns)
Here:
$2,293
State:
$2,251
(% of AGI for various income ranges: 79.2% for AGIs below $25k, 67.0% for AGIs $25k-50k)
Percentage of individuals using paid preparers for their 2020 taxes: 92.4%
Here:
92%
State:
93%
(% for various income ranges: 91.7% for AGIs below $25k, 93.1% for AGIs $25k-50k, 94.7% for AGIs $50k-75k, 92.3% for AGIs $75k-100k, 88.2% for AGIs $100k-200k, 100.0% for AGIs over 200k)
Averages for the 2012 tax year for zip code 49339, filed in 2013:
Average Adjusted Gross Income (AGI) in 2012: $58,519 (Individual Income Tax Returns)
Here:
$58,519
State:
$55,609
Salary/wage: $45,652 (reported on 83.5% of returns)
Here:
$45,652
State:
$46,782
(% of AGI for various income ranges: 69.7% for AGIs below $25k, 85.6% for AGIs $25k-50k, 82.1% for AGIs $50k-75k, 84.5% for AGIs $75k-100k, 43.7% for AGIs $100k-200k)
Taxable interest for individuals: $1,173 (reported on 32.0% of returns)
This zip code:
$1,173
Michigan:
$1,491
(% of AGI for various income ranges: 2.7% for AGIs below $25k, 0.5% for AGIs $25k-50k, 0.6% for AGIs $50k-75k, 0.3% for AGIs $75k-100k, 0.5% for AGIs $100k-200k)
Ordinary dividends: $2,677 (reported on 12.6% of returns)
Here:
$2,677
State:
$6,225
(% of AGI for various income ranges: 1.4% for AGIs below $25k, 0.2% for AGIs $25k-50k, 0.3% for AGIs $50k-75k, 0.9% for AGIs $100k-200k)
Net capital gain/loss in AGI: +$3,844 (reported on 8.7% of returns)
Here:
+$3,844
State:
+$9,326
(% of AGI for various income ranges: 0.2% for AGIs $50k-75k, 1.2% for AGIs $100k-200k)
Profit/loss from business: +$3,373 (reported on 14.6% of returns)
Here:
+$3,373
State:
+$11,523
(% of AGI for various income ranges: 4.6% for AGIs below $25k, 0.5% for AGIs $25k-50k, 1.8% for AGIs $50k-75k, 0.6% for AGIs $75k-100k)
Taxable individual retirement arrangement distribution: $13,820 (reported on 9.7% of returns)
49339:
$13,820
Michigan:
$15,298
(% of AGI for various income ranges: 4.4% for AGIs below $25k, 5.7% for AGIs $25k-50k, 7.6% for AGIs $75k-100k)
Total itemized deductions: $21,830 (16% of AGI, reported on 26.2% of returns)
Here:
$21,830
State:
$21,628
Here:
16.4% of AGI
State:
18.4% of AGI
(% of AGI for various income ranges: 8.4% for AGIs below $25k, 8.2% for AGIs $25k-50k, 8.5% for AGIs $50k-75k, 11.1% for AGIs $75k-100k, 10.6% for AGIs $100k-200k)
Charity contributions: $3,448 (reported on 20.4% of returns)
Here:
$3,448
State:
$4,225
(% of AGI for various income ranges: 1.2% for AGIs below $25k, 0.7% for AGIs $25k-50k, 1.1% for AGIs $50k-75k, 1.5% for AGIs $75k-100k, 1.3% for AGIs $100k-200k)
Taxes paid: $9,230 (reported on 26.2% of returns)
49339:
$9,230
State:
$8,327
(% of AGI for various income ranges: 1.7% for AGIs below $25k, 2.0% for AGIs $25k-50k, 2.5% for AGIs $50k-75k, 3.9% for AGIs $75k-100k, 6.0% for AGIs $100k-200k)
Earned income credit: $2,481 (reported on 15.5% of returns)
Here:
$2,481
State:
$2,306
(% of AGI for various income ranges: 6.4% for AGIs below $25k, 1.3% for AGIs $25k-50k)
Percentage of individuals using paid preparers for their 2012 taxes: 55.3%
Here:
55%
State:
57%
(% for various income ranges: 50.0% for AGIs below $25k, 54.2% for AGIs $25k-50k, 52.6% for AGIs $50k-75k, 63.6% for AGIs $75k-100k, 77.8% for AGIs $100k-200k)
Averages for the 2004 tax year for zip code 49339, filed in 2005:
Average Adjusted Gross Income (AGI) in 2004: $43,046 (Individual Income Tax Returns)
Here:
$43,046
State:
$48,204
Salary/wage: $39,831 (reported on 87.3% of returns)
Here:
$39,831
State:
$42,791
(% of AGI for various income ranges: 113.6% for AGIs below $10k, 72.8% for AGIs $10k-25k, 86.6% for AGIs $25k-50k, 86.4% for AGIs $50k-75k, 90.7% for AGIs $75k-100k, 58.7% for AGIs over 100k)
Taxable interest for individuals: $835 (reported on 42.1% of returns)
This zip code:
$835
Michigan:
$1,725
(% of AGI for various income ranges: 7.3% for AGIs below $10k, 3.2% for AGIs $10k-25k, 0.8% for AGIs $25k-50k, 0.3% for AGIs $50k-75k, 0.2% for AGIs $75k-100k, 0.8% for AGIs over 100k)
Taxable dividends: $1,673 (reported on 16.5% of returns)
Here:
$1,673
State:
$3,420
(% of AGI for various income ranges: 1.3% for AGIs $10k-25k, 0.3% for AGIs $25k-50k, 0.3% for AGIs $50k-75k, 0.0% for AGIs $75k-100k, 1.7% for AGIs over 100k)
Net capital gain/loss: +$4,123 (reported on 12.0% of returns)
Here:
+$4,123
State:
+$8,532
(% of AGI for various income ranges: -0.2% for AGIs $10k-25k, 0.4% for AGIs $25k-50k, 1.4% for AGIs $50k-75k, 0.2% for AGIs $75k-100k, 3.0% for AGIs over 100k)
Profit/loss from business: +$5,316 (reported on 16.4% of returns)
Here:
+$5,316
State:
+$9,547
(% of AGI for various income ranges: 9.3% for AGIs below $10k, 4.8% for AGIs $10k-25k, 2.0% for AGIs $25k-50k, 0.0% for AGIs $50k-75k, -0.1% for AGIs $75k-100k, 5.2% for AGIs over 100k)
Total itemized deductions: $15,683 (22% of AGI, reported on 36.9% of returns)
Here:
$15,683
State:
$18,509
Here:
22.3% of AGI
State:
20.7% of AGI
(% of AGI for various income ranges: 9.9% for AGIs $10k-25k, 12.6% for AGIs $25k-50k, 14.0% for AGIs $50k-75k, 14.8% for AGIs $75k-100k, 14.8% for AGIs over 100k)
Charity contributions deductions: $2,188 (3% of AGI, reported on 28.6% of returns)
Here:
$2,188
State:
$3,365
Here:
2.9% of AGI
State:
3.6% of AGI
(% of AGI for various income ranges: 1.0% for AGIs $10k-25k, 1.1% for AGIs $25k-50k, 1.2% for AGIs $50k-75k, 1.2% for AGIs $75k-100k, 2.7% for AGIs over 100k)
Total tax: $5,355 (reported on 76.6% of returns)
49339:
$5,355
State:
$7,691
(% of AGI for various income ranges: 4.3% for AGIs below $10k, 4.1% for AGIs $10k-25k, 6.0% for AGIs $25k-50k, 7.8% for AGIs $50k-75k, 10.0% for AGIs $75k-100k, 18.3% for AGIs over 100k)
Earned income credit: $1,650 (reported on 12.3% of returns)
Here:
$1,650
State:
$1,737
Percentage of individuals using paid preparers for their 2004 taxes: 61.4%
Here:
61%
State:
60%
(% for various income ranges: 48.1% for AGIs below $10k, 61.9% for AGIs $10k-25k, 63.0% for AGIs $25k-50k, 65.0% for AGIs $50k-75k, 63.7% for AGIs $75k-100k, 75.0% for AGIs over 100k)
Household received Food Stamps/SNAP in the past 12 months: 51 Household did not receive Food Stamps/SNAP in the past 12 months: 739
Women who had a birth in the past 12 months: 14 (8 now married, 5 unmarried) Women who did not have a birth in the past 12 months: 409 (233 now married, 174 unmarried)
Housing units in zip code 49339 with a mortgage: 489 (28 second mortgage, 9 both second mortgage and home equity loan) Houses without a mortgage: 5
Median monthly owner costs for units with a mortgage: $1,323 Median monthly owner costs for units without a mortgage: $463
Residents with income below the poverty level in 2022:
This zip code:
6.1%
Whole state:
13.4%
Residents with income below 50% of the poverty level in 2022:
This zip code:
3.9%
Whole state:
6.9%
Median number of rooms in houses and condos:
Here:
6.6
State:
6.5
Median number of rooms in apartments:
Here:
3.4
State:
4.3
Notable locations in this zip code not listed on our city pages
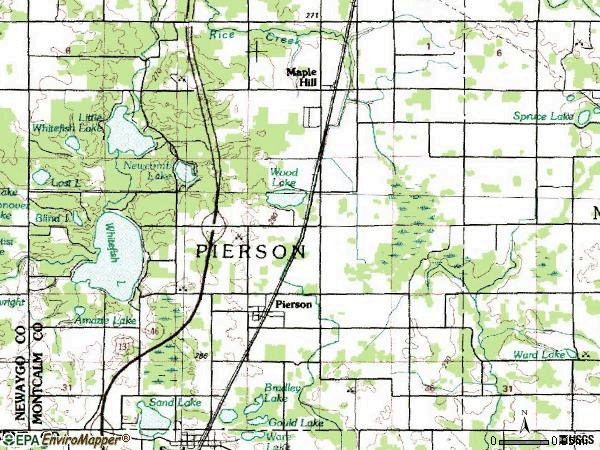
Lakes: Lost Lake (A), Little Whitefish Lake (B), Little Bass Lake (C), Whitefish Lake (D), Wood Lake (E), Waltman Lake (F), Newcomb Lake (G), Sealey Lake (H). Display/hide their locations on the map
Size of family households: 322 2-persons, 128 3-persons, 29 4-persons, 68 5-persons, 108 6-persons, 3 7-or-more-persons
Size of nonfamily households: 78 1-person, 54 2-persons
437 married couples with children.
34 single-parent households (15 men, 19 women).
96.7% of residents of 49339 zip code speak English at home.
1.1% of residents speak Spanish at home (100% very well).
1.7% of residents speak other Indo-European language at home (100% very well).
Foreign born population: 0 (0.0%)
:
0.0%
Whole state:
6.9%
38%German
18%Dutch
11%English
9%Irish
8%American
5%Polish
2%Scottish
Year of entry for the foreign-born population
02010 or later
02000 to 2009
01990 to 1999
3Before 1990
Facilities with environmental interests located in this zip code:
MI DEPT/STATE POLICE (WOOD LAKE RD & HENKEL RD in PIERSON, MI)
(Resource Conservation and Recovery Act (tracking hazardous waste)) Alternative names: MI DEPT/STATE POLICE (E)
CENTRAL SANITARY LANDFILL INC (21545 W CANNONSVILLE ROAD in PIERSON, MI)
Conditionally Exempt Small Quantity Generators, less than 100 kg/month of hazardous waste (Resource Conservation and Recovery Act (tracking hazardous waste))
CENTRAL SANITARY LANDFILL (2545 AMY SCHOOL ROAD in PIERSON, MI)
AIR MAJOR (AIRS/AFS) Business SIC classification: REFUSE SYSTEMS Alternative names: CENTRAL LANDFILL
CENTRAL SANITARY LF (21545 CANNONSVILLE RD in PIERSON, MI)
CRITERIA AND HAZARDOUS AIR POLLUTANT INVENTORY (Inventory of air pollution sources) Business SIC classification: REFUSE SYSTEMS Business NAICS classification: SOLID WASTE LANDFILL.
Housing units lacking complete plumbing facilities: 4.7% Housing units lacking complete kitchen facilities: 0.4%
38.5%Bottled, tank, or LP gas
36.0%Utility gas
20.4%Wood
4.9%Electricity
Population in 1990: 2,177.
Place of birth for U.S.-born residents:
This state: 2,011
Midwest: 115
South: 58
West: 35
63% of the 49339 zip code residents lived in the same house 5 years ago. Out of people who lived in different houses, 17% lived in this county. Out of people who lived in different counties, 50% lived in Michigan.
97% of the 49339 zip code residents lived in the same house 1 year ago. Out of people who lived in different houses, 87% moved from this county. Out of people who lived in different houses, 15% moved from different county within same state.
Private vs. public school enrollment:
Students in private schools in grades 1 to 8 (elementary and middle school): 6
Here:
2.7%
Michigan:
12.4%
Students in private schools in grades 9 to 12 (high school): 16
Here:
14.8%
Michigan:
9.8%
Students in private undergraduate colleges: 2
Here:
2.7%
Michigan:
14.9%
Occupation by median earnings in the past 12 months ($)
154,921Business and financial operations occupations
60,514Management occupations
58,846Sales and related occupations
48,551Installation, maintenance, and repair occupations
42,693Production occupations
34,319Construction and extraction occupations
Top industries in this zip code by the number of employees in 2005:
Administrative and Support and Waste Management and Remediation Services: Solid Waste Collection (50-99 employees: 1 establishment)
Other Services (except Public Administration): Commercial and Industrial Machinery and Equipment (except Automotive and Electronic) Repair and Maintenance (10-19: 1)
Administrative and Support and Waste Management and Remediation Services: Solid Waste Landfill (5-9: 1)
Construction: Electrical Contractors (5-9: 1)
Other Services (except Public Administration): Religious Organizations (1-4: 2)
Arts, Entertainment, and Recreation: Golf Courses and Country Clubs (1-4: 1)
Construction: Site Preparation Contractors (1-4: 1)
Construction: Commercial and Institutional Building Construction (1-4: 1)
Fatal accident statistics in 2012:
Fatal accident count: 1
Vehicles involved in fatal accidents: 1
Fatal accidents caused by drunken drivers: 1
Fatalities: 1
Persons involved in fatal accidents: 1
Pedestrians involved in fatal accidents: 1
Most common first names in zip code 49339 among deceased individuals
Name
Count
Lived (average)
Mary
11
74.3 years
John
9
74.0 years
Donald
8
75.4 years
Helen
8
69.1 years
Robert
8
63.4 years
Richard
6
69.8 years
Charles
5
77.4 years
Frank
5
82.8 years
William
5
68.8 years
Raymond
5
78.8 years
Most common last names in zip code 49339 among deceased individuals
Last name
Count
Lived (average)
Johnson
7
81.0 years
Parker
5
59.4 years
Carpenter
4
67.0 years
Paepke
4
75.0 years
Hubbard
3
76.4 years
Bucholtz
3
64.0 years
Croff
3
78.7 years
Hoskins
3
78.4 years
Olson
3
84.0 years
Brown
3
82.4 years
Discuss Pierson, Michigan (MI) on our hugely popular Michigan forum.


 Nearest zip codes: 49343, 49329, 49319, 49322, 49347, 49336.