Estimated zip code population in 2022: 1,668 Zip code population in 2010: 1,622 Zip code population in 2000: 1,675
Houses and condos: 2,320 Renter-occupied apartments: 78
% of renters here:
10%
State:
27%
March 2022 cost of living index in zip code 49436: 81.7 (low, U.S. average is 100)
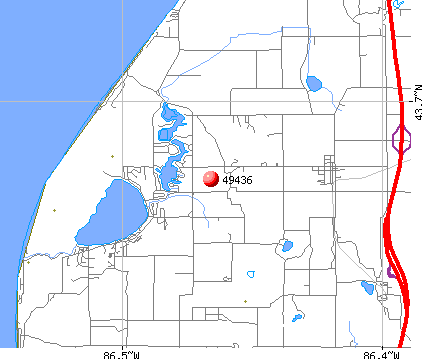
Land area: 31.3 sq. mi. Water area: 7.3 sq. mi.
Population density: 53 people per square mile
(very low).
OSM Map
General Map
Google Map
MSN Map
OSM Map
General Map
Google Map
MSN Map
OSM Map
General Map
Google Map
MSN Map
OSM Map
General Map
Google Map
MSN Map
Please wait while loading the map...
Real estate property taxes paid for housing units in 2022:
This zip code:
1.0% ($2,259)
Michigan:
1.2% ($2,746)
Median real estate property taxes paid for housing units with mortgages in 2022: $2,276 (1.0%) Median real estate property taxes paid for housing units with no mortgage in 2022: $2,254 (1.0%)
Business Search- 14 Million verified businesses
Males: 893
(53.6%)
Females: 774
(46.4%)
For population 25 years and over in 49436:
High school or higher: 92.8%
Bachelor's degree or higher: 21.9%
Graduate or professional degree: 5.6%
Unemployed: 10.1%
Mean travel time to work (commute): 25.5 minutes
For population 15 years and over in 49436:
Never married: 24.2%
Now married: 57.7%
Separated: 1.1%
Widowed: 9.4%
Divorced: 7.6%
Zip code 49436 compared to state average:
Unemployed percentage above state average.
Black race population percentage significantly below state average.
Hispanic race population percentage significantly above state average.
Median age significantly above state average.
Foreign-born population percentage significantly below state average.
Renting percentage significantly below state average.
Length of stay since moving in above state average.
Averages for the 2020 tax year for zip code 49436, filed in 2021:
Average Adjusted Gross Income (AGI) in 2020: $61,990 (Individual Income Tax Returns)
Here:
$61,990
State:
$68,945
Salary/wage: $48,331 (reported on 68.5% of returns)
Here:
$48,331
State:
$57,142
(% of AGI for various income ranges: 1249.1% for AGIs below $25k, 2562.9% for AGIs $25k-50k, 5030.0% for AGIs $50k-75k, 7552.0% for AGIs $75k-100k, 11924.0% for AGIs $100k-200k)
Taxable interest for individuals: $1,881 (reported on 36.0% of returns)
This zip code:
$1,881
Michigan:
$1,630
(% of AGI for various income ranges: 10.9% for AGIs below $25k, 20.7% for AGIs $25k-50k, 98.9% for AGIs $50k-75k, 60.0% for AGIs $75k-100k, 416.0% for AGIs $100k-200k)
Ordinary dividends: $5,139 (reported on 20.2% of returns)
Here:
$5,139
State:
$6,972
(% of AGI for various income ranges: 23.6% for AGIs below $25k, 39.3% for AGIs $25k-50k, 106.7% for AGIs $50k-75k, 206.0% for AGIs $75k-100k, 1238.0% for AGIs $100k-200k)
Net capital gain/loss in AGI: +$12,539 (reported on 20.2% of returns)
Here:
+$12,539
State:
+$20,064
(% of AGI for various income ranges: 8.2% for AGIs below $25k, 71.4% for AGIs $25k-50k, 144.4% for AGIs $50k-75k, 586.0% for AGIs $75k-100k, 3432.0% for AGIs $100k-200k)
Profit/loss from business: +$10,440 (reported on 11.2% of returns)
Here:
+$10,440
State:
+$11,172
(% of AGI for various income ranges: 76.8% for AGIs below $25k, 341.4% for AGIs $25k-50k, 794.0% for AGIs $75k-100k)
Taxable individual retirement arrangement distribution: $22,594 (reported on 18.0% of returns)
49436:
$22,594
Michigan:
$19,803
(% of AGI for various income ranges: 98.2% for AGIs below $25k, 315.7% for AGIs $25k-50k, 530.0% for AGIs $50k-75k, 682.0% for AGIs $75k-100k, 4278.0% for AGIs $100k-200k)
Total itemized deductions: $45,425 (reported on 4.5% of returns)
Here:
$45,425
State:
$34,117
(% of AGI for various income ranges: 258.2% for AGIs below $25k, 2498.0% for AGIs $100k-200k)
Charity contributions: $12,533 (reported on 3.4% of returns)
Here:
$12,533
State:
$13,548
(% of AGI for various income ranges: 417.8% for AGIs $50k-75k)
Taxes paid: $7,120 (reported on 5.6% of returns)
49436:
$7,120
State:
$7,972
(% of AGI for various income ranges: 108.6% for AGIs $25k-50k, 408.0% for AGIs $100k-200k)
Earned income credit: $2,142 (reported on 13.5% of returns)
Here:
$2,142
State:
$2,251
(% of AGI for various income ranges: 74.1% for AGIs below $25k, 67.1% for AGIs $25k-50k)
Percentage of individuals using paid preparers for their 2020 taxes: 96.6%
Here:
97%
State:
93%
(% for various income ranges: 97.1% for AGIs below $25k, 94.7% for AGIs $25k-50k, 92.9% for AGIs $50k-75k, 100.0% for AGIs $75k-100k, 100.0% for AGIs $100k-200k, 100.0% for AGIs over 200k)
Averages for the 2012 tax year for zip code 49436, filed in 2013:
Average Adjusted Gross Income (AGI) in 2012: $45,910 (Individual Income Tax Returns)
Here:
$45,910
State:
$55,609
Salary/wage: $29,574 (reported on 75.3% of returns)
Here:
$29,574
State:
$46,782
(% of AGI for various income ranges: 64.5% for AGIs below $25k, 60.1% for AGIs $25k-50k, 42.2% for AGIs $50k-75k, 52.7% for AGIs $75k-100k, 38.0% for AGIs $100k-200k)
Taxable interest for individuals: $1,889 (reported on 36.4% of returns)
This zip code:
$1,889
Michigan:
$1,491
(% of AGI for various income ranges: 1.3% for AGIs below $25k, 0.7% for AGIs $25k-50k, 1.9% for AGIs $50k-75k, 0.3% for AGIs $75k-100k, 2.4% for AGIs $100k-200k)
Ordinary dividends: $5,111 (reported on 23.4% of returns)
Here:
$5,111
State:
$6,225
(% of AGI for various income ranges: 1.3% for AGIs below $25k, 0.9% for AGIs $25k-50k, 2.2% for AGIs $50k-75k, 1.1% for AGIs $75k-100k, 5.0% for AGIs $100k-200k)
Net capital gain/loss in AGI: +$1,217 (reported on 15.6% of returns)
Here:
+$1,217
State:
+$9,326
(% of AGI for various income ranges: 1.4% for AGIs $100k-200k)
Profit/loss from business: +$4,562 (reported on 16.9% of returns)
Here:
+$4,562
State:
+$11,523
(% of AGI for various income ranges: 6.2% for AGIs below $25k, 2.5% for AGIs $25k-50k, 2.9% for AGIs $75k-100k)
Taxable individual retirement arrangement distribution: $13,833 (reported on 19.5% of returns)
49436:
$13,833
Michigan:
$15,298
(% of AGI for various income ranges: 5.6% for AGIs below $25k, 4.8% for AGIs $25k-50k, 8.4% for AGIs $50k-75k, 6.6% for AGIs $75k-100k, 4.8% for AGIs $100k-200k)
Total itemized deductions: $22,390 (25% of AGI, reported on 27.3% of returns)
Here:
$22,390
State:
$21,628
Here:
25.1% of AGI
State:
18.4% of AGI
(% of AGI for various income ranges: 13.2% for AGIs $25k-50k, 14.3% for AGIs $50k-75k, 15.9% for AGIs $75k-100k, 16.1% for AGIs $100k-200k)
Charity contributions: $4,912 (reported on 22.1% of returns)
Here:
$4,912
State:
$4,225
(% of AGI for various income ranges: 1.8% for AGIs $25k-50k, 2.4% for AGIs $50k-75k, 2.7% for AGIs $75k-100k, 3.3% for AGIs $100k-200k)
Taxes paid: $7,324 (reported on 27.3% of returns)
49436:
$7,324
State:
$8,327
(% of AGI for various income ranges: 1.7% for AGIs below $25k, 2.3% for AGIs $25k-50k, 4.2% for AGIs $50k-75k, 5.0% for AGIs $75k-100k, 6.1% for AGIs $100k-200k)
Earned income credit: $1,987 (reported on 19.5% of returns)
Here:
$1,987
State:
$2,306
(% of AGI for various income ranges: 5.3% for AGIs below $25k, 1.2% for AGIs $25k-50k)
Percentage of individuals using paid preparers for their 2012 taxes: 57.1%
Here:
57%
State:
57%
(% for various income ranges: 50.0% for AGIs below $25k, 61.1% for AGIs $25k-50k, 63.6% for AGIs $50k-75k, 57.1% for AGIs $75k-100k, 71.4% for AGIs $100k-200k)
Averages for the 2004 tax year for zip code 49436, filed in 2005:
Average Adjusted Gross Income (AGI) in 2004: $37,596 (Individual Income Tax Returns)
Here:
$37,596
State:
$48,204
Salary/wage: $25,749 (reported on 79.2% of returns)
Here:
$25,749
State:
$42,791
(% of AGI for various income ranges: 110.7% for AGIs below $10k, 65.5% for AGIs $10k-25k, 65.0% for AGIs $25k-50k, 61.2% for AGIs $50k-75k, 49.9% for AGIs $75k-100k, 32.5% for AGIs over 100k)
Taxable interest for individuals: $1,953 (reported on 46.8% of returns)
This zip code:
$1,953
Michigan:
$1,725
(% of AGI for various income ranges: 7.5% for AGIs below $10k, 3.2% for AGIs $10k-25k, 1.5% for AGIs $25k-50k, 1.1% for AGIs $50k-75k, 2.5% for AGIs $75k-100k, 3.6% for AGIs over 100k)
Taxable dividends: $2,596 (reported on 25.1% of returns)
Here:
$2,596
State:
$3,420
(% of AGI for various income ranges: 4.0% for AGIs below $10k, 1.8% for AGIs $10k-25k, 0.7% for AGIs $25k-50k, 1.2% for AGIs $50k-75k, 2.0% for AGIs $75k-100k, 2.7% for AGIs over 100k)
Net capital gain/loss: +$9,342 (reported on 19.7% of returns)
Here:
+$9,342
State:
+$8,532
(% of AGI for various income ranges: 4.9% for AGIs below $10k, 0.2% for AGIs $10k-25k, -0.0% for AGIs $25k-50k, 2.2% for AGIs $50k-75k, 4.1% for AGIs $75k-100k, 13.5% for AGIs over 100k)
Profit/loss from business: +$2,193 (reported on 15.5% of returns)
Here:
+$2,193
State:
+$9,547
(% of AGI for various income ranges: 1.9% for AGIs below $10k, -1.3% for AGIs $10k-25k, 1.1% for AGIs $25k-50k, 2.5% for AGIs $50k-75k, 1.3% for AGIs $75k-100k)
Profit/loss from farming: +$6,500 (reported on 1.3% of returns)
Here:
+$6,500
State:
-$4,492
IRA payment deduction: $2,353 (reported on 2.2% of returns)
49436:
$2,353
Michigan:
$2,875
Total itemized deductions: $17,271 (23% of AGI, reported on 26.9% of returns)
Here:
$17,271
State:
$18,509
Here:
23.1% of AGI
State:
20.7% of AGI
(% of AGI for various income ranges: 19.9% for AGIs below $10k, 11.7% for AGIs $10k-25k, 11.0% for AGIs $25k-50k, 11.7% for AGIs $50k-75k, 15.2% for AGIs $75k-100k, 12.2% for AGIs over 100k)
Charity contributions deductions: $3,886 (5% of AGI, reported on 22.7% of returns)
Here:
$3,886
State:
$3,365
Here:
4.9% of AGI
State:
3.6% of AGI
(% of AGI for various income ranges: 1.9% for AGIs $10k-25k, 1.5% for AGIs $25k-50k, 2.1% for AGIs $50k-75k, 1.9% for AGIs $75k-100k, 3.8% for AGIs over 100k)
Total tax: $5,234 (reported on 68.8% of returns)
49436:
$5,234
State:
$7,691
(% of AGI for various income ranges: 3.7% for AGIs below $10k, 2.8% for AGIs $10k-25k, 6.2% for AGIs $25k-50k, 8.7% for AGIs $50k-75k, 10.3% for AGIs $75k-100k, 16.0% for AGIs over 100k)
Earned income credit: $1,632 (reported on 17.7% of returns)
Here:
$1,632
State:
$1,737
Percentage of individuals using paid preparers for their 2004 taxes: 56.1%
Here:
56%
State:
60%
(% for various income ranges: 44.9% for AGIs below $10k, 52.3% for AGIs $10k-25k, 59.4% for AGIs $25k-50k, 66.7% for AGIs $50k-75k, 60.0% for AGIs $75k-100k, 82.9% for AGIs over 100k)
Household received Food Stamps/SNAP in the past 12 months: 85 Household did not receive Food Stamps/SNAP in the past 12 months: 696
Women who had a birth in the past 12 months: 22 (0 now married, 21 unmarried) Women who did not have a birth in the past 12 months: 178 (95 now married, 82 unmarried)
Housing units in zip code 49436 with a mortgage: 379 (36 second mortgage, 33 both second mortgage and home equity loan) Houses without a mortgage: 10
Median monthly owner costs for units with a mortgage: $1,367 Median monthly owner costs for units without a mortgage: $482
Residents with income below the poverty level in 2022:
This zip code:
8.1%
Whole state:
13.4%
Residents with income below 50% of the poverty level in 2022:
This zip code:
5.7%
Whole state:
6.9%
Median number of rooms in houses and condos:
Here:
5.8
State:
6.5
Median number of rooms in apartments:
Here:
5.7
State:
4.3
Notable locations in this zip code not listed on our city pages
Notable locations in zip code 49436: Golden Sands Golf Course (A), Silver Lake Resort and Campground (B), Silver Creek RV Resort (C), Yogi's Bears Jellystone Park (D), Hideway Campground (E), Sandy Shores Campground (F), Silver City II Campground (G), Silver Lake State Park Campground (H), Oceana County Historical Park and Museum (I), Little Point Sable Lighthouse (J). Display/hide their locations on the map
Churches in zip code 49436 include: Mears Methodist Church (A), Cornerstone Community Church (B), West Golden Church (C), West Golden Wesleyan Church (D), Mission Covenant Church (E). Display/hide their locations on the map
Parks in zip code 49436 include: Silver Lake State Park (1), Cedar Point Park (2), Golden Township Park (3), Charles Mears Silver Lake Boarding House Historical Marker (4). Display/hide their locations on the map
In group quarters: 4 (-1 institutionalized population)
Size of family households: 398 2-persons, 45 3-persons, 59 4-persons, 27 5-persons, 5 6-persons, 4 7-or-more-persons
Size of nonfamily households: 226 1-person, 20 2-persons
139 married couples with children.
64 single-parent households (37 men, 27 women).
89.1% of residents of 49436 zip code speak English at home.
10.9% of residents speak Spanish at home (78% very well, 13% well, 7% not well, 1% not at all).
0.6% of residents speak other Indo-European language at home (78% very well, 22% well).
Foreign born population: 48 (2.9%) (54.3% of them are naturalized citizens)
This zip code:
2.9%
Whole state:
6.9%
71%Honduras
16%Haiti
4%Bolivia
2%El Salvador
20%American
14%Dutch
13%Irish
11%German
5%English
3%Norwegian
3%Yugoslavian
Year of entry for the foreign-born population
62010 or later
242000 to 2009
111990 to 1999
11Before 1990
Facilities with environmental interests located in this zip code:
GOLDEN EARLY CHILDHOOD CENTER (5601 W. FOX ROAD in MEARS, MI)
(National Center for Education Statistics) - STATE ID-01436 Organizations: HART PUBLIC SCHOOL DISTRICT (SCHOOL DISTRICT)
MEARS TRUCK & TRACTOR INC (7282 W FOX ROAD in MEARS, MI)
Conditionally Exempt Small Quantity Generators, less than 100 kg/month of hazardous waste (Resource Conservation and Recovery Act (tracking hazardous waste)) Organizations: GARY BEGGS (CONTACT/OPERATOR)
MI DEPT/NATURAL RESOURCES (NW CORNER OF 4TH AND 56TH ST in MEARS, MI)
Conditionally Exempt Small Quantity Generators, less than 100 kg/month of hazardous waste (Resource Conservation and Recovery Act (tracking hazardous waste)) - notification Organizations: PURDY KEN (CONTACT/OWNER)
Alternative names: MIDNR VILLAGE OF MEARS SITE
Housing units lacking complete plumbing facilities: 1.7% Housing units lacking complete kitchen facilities: 0.8%
52.4%Bottled, tank, or LP gas
18.7%Utility gas
12.8%Electricity
8.1%Fuel oil, kerosene, etc.
3.8%Wood
3.4%Other fuel
1.2%No fuel used
Population in 1990: 1,302. Population change in the 1990s: +373 (+28.6%).
Place of birth for U.S.-born residents:
This state: 1,273
Northeast: 4
Midwest: 255
South: 57
West: 19
67% of the 49436 zip code residents lived in the same house 5 years ago. Out of people who lived in different houses, 49% lived in this county. Out of people who lived in different counties, 50% lived in Michigan.
94% of the 49436 zip code residents lived in the same house 1 year ago. Out of people who lived in different houses, 45% moved from this county. Out of people who lived in different houses, 48% moved from different county within same state. Out of people who lived in different houses, 8% moved from different state.
Private vs. public school enrollment:
Students in private schools in grades 1 to 8 (elementary and middle school):
Here:
0.0%
Michigan:
12.4%
Students in private schools in grades 9 to 12 (high school):
Here:
0.0%
Michigan:
9.8%
Students in private undergraduate colleges:
Here:
0.0%
Michigan:
14.9%
Occupation by median earnings in the past 12 months ($)
79,639Health diagnosing and treating practitioners and other technical occupations
56,970Healthcare support occupations
56,044Arts, design, entertainment, sports, and media occupations
48,699Installation, maintenance, and repair occupations
35,944Community and social service occupations
33,643Construction and extraction occupations
Top industries in this zip code by the number of employees in 2005:


+$6,500
-$4,492
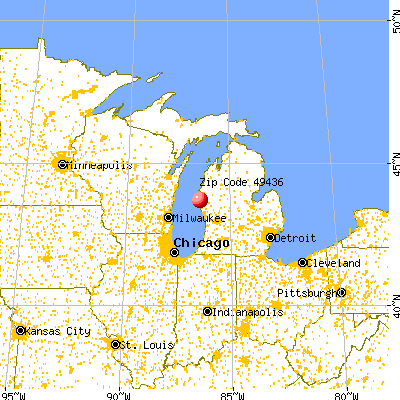
 Nearest zip codes: 49455, 49449, 49446, 49420, 49437, 49452.


