Estimated zip code population in 2022: 5,136 Zip code population in 2010: 5,034 Zip code population in 2000: 5,210
Houses and condos: 2,703 Renter-occupied apartments: 372
% of renters here:
19%
State:
27%
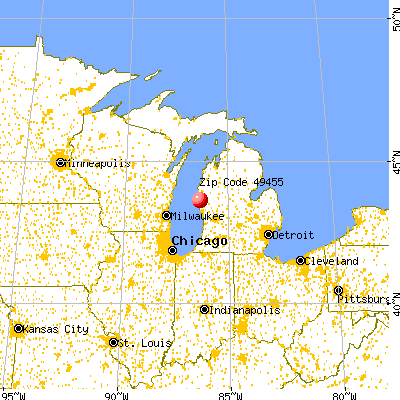
March 2022 cost of living index in zip code 49455: 80.1 (low, U.S. average is 100)
Land area: 81.1 sq. mi. Water area: 8.2 sq. mi.
Population density: 63 people per square mile
(very low).
OSM Map
General Map
Google Map
MSN Map
OSM Map
General Map
Google Map
MSN Map
OSM Map
General Map
Google Map
MSN Map
OSM Map
General Map
Google Map
MSN Map
Please wait while loading the map...
Real estate property taxes paid for housing units in 2022:
This zip code:
1.2% ($1,678)
Michigan:
1.2% ($2,746)
Median real estate property taxes paid for housing units with mortgages in 2022: $1,826 (1.4%) Median real estate property taxes paid for housing units with no mortgage in 2022: $1,402 (0.9%)
Business Search- 14 Million verified businesses
Males: 2,595
(50.5%)
Females: 2,541
(49.5%)
For population 25 years and over in 49455:
High school or higher: 86.8%
Bachelor's degree or higher: 20.5%
Graduate or professional degree: 7.7%
Unemployed: 2.6%
Mean travel time to work (commute): 20.3 minutes
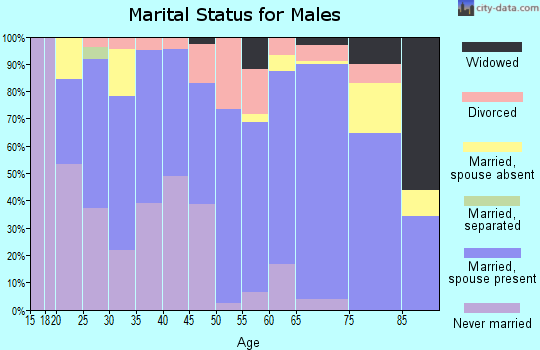
For population 15 years and over in 49455:
Never married: 28.6%
Now married: 51.2%
Separated: 0.2%
Widowed: 5.3%
Divorced: 14.7%
Zip code 49455 compared to state average:
Median house value below state average.
Unemployed percentage below state average.
Black race population percentage significantly below state average.
Hispanic race population percentage significantly above state average.
Length of stay since moving in significantly above state average.
Percentage of population with a bachelor's degree or higher below state average.
Averages for the 2020 tax year for zip code 49455, filed in 2021:
Average Adjusted Gross Income (AGI) in 2020: $50,881 (Individual Income Tax Returns)
Here:
$50,881
State:
$68,945
Salary/wage: $38,848 (reported on 81.1% of returns)
Here:
$38,848
State:
$57,142
(% of AGI for various income ranges: 1113.6% for AGIs below $25k, 3607.9% for AGIs $25k-50k, 6470.0% for AGIs $50k-75k, 9170.0% for AGIs $75k-100k, 14045.8% for AGIs $100k-200k)
Taxable interest for individuals: $1,775 (reported on 22.5% of returns)
This zip code:
$1,775
Michigan:
$1,630
(% of AGI for various income ranges: 17.7% for AGIs below $25k, 33.1% for AGIs $25k-50k, 43.5% for AGIs $50k-75k, 34.3% for AGIs $75k-100k, 170.0% for AGIs $100k-200k)
Ordinary dividends: $5,362 (reported on 13.1% of returns)
Here:
$5,362
State:
$6,972
(% of AGI for various income ranges: 14.6% for AGIs below $25k, 39.8% for AGIs $25k-50k, 76.5% for AGIs $50k-75k, 59.3% for AGIs $75k-100k, 182.5% for AGIs $100k-200k)
Net capital gain/loss in AGI: +$18,755 (reported on 11.9% of returns)
Here:
+$18,755
State:
+$20,064
(% of AGI for various income ranges: 24.9% for AGIs below $25k, 13.8% for AGIs $25k-50k, 48.5% for AGIs $50k-75k, 114.3% for AGIs $75k-100k, 1301.7% for AGIs $100k-200k)
Profit/loss from business: +$9,117 (reported on 11.9% of returns)
Here:
+$9,117
State:
+$11,172
(% of AGI for various income ranges: 103.3% for AGIs below $25k, 55.0% for AGIs $25k-50k, 101.9% for AGIs $50k-75k, 277.1% for AGIs $75k-100k, 895.8% for AGIs $100k-200k)
Taxable individual retirement arrangement distribution: $18,388 (reported on 10.2% of returns)
49455:
$18,388
Michigan:
$19,803
(% of AGI for various income ranges: 73.4% for AGIs below $25k, 107.7% for AGIs $25k-50k, 386.2% for AGIs $50k-75k, 2154.2% for AGIs $100k-200k)
Total itemized deductions: $35,400 (reported on 2.9% of returns)
Here:
$35,400
State:
$34,117
(% of AGI for various income ranges: 124.8% for AGIs $25k-50k, 1524.2% for AGIs $100k-200k)
Charity contributions: $20,220 (reported on 2.0% of returns)
Here:
$20,220
State:
$13,548
(% of AGI for various income ranges: 842.5% for AGIs $100k-200k)
Taxes paid: $7,043 (reported on 2.9% of returns)
49455:
$7,043
State:
$7,972
(% of AGI for various income ranges: 29.4% for AGIs $25k-50k, 283.3% for AGIs $100k-200k)
Earned income credit: $2,357 (reported on 17.2% of returns)
Here:
$2,357
State:
$2,251
(% of AGI for various income ranges: 92.0% for AGIs below $25k, 82.5% for AGIs $25k-50k)
Percentage of individuals using paid preparers for their 2020 taxes: 93.9%
Here:
94%
State:
93%
(% for various income ranges: 92.4% for AGIs below $25k, 94.1% for AGIs $25k-50k, 94.7% for AGIs $50k-75k, 95.2% for AGIs $75k-100k, 95.2% for AGIs $100k-200k, 100.0% for AGIs over 200k)
Averages for the 2012 tax year for zip code 49455, filed in 2013:
Average Adjusted Gross Income (AGI) in 2012: $41,481 (Individual Income Tax Returns)
Here:
$41,481
State:
$55,609
Salary/wage: $32,618 (reported on 81.5% of returns)
Here:
$32,618
State:
$46,782
(% of AGI for various income ranges: 69.2% for AGIs below $25k, 78.9% for AGIs $25k-50k, 74.0% for AGIs $50k-75k, 75.2% for AGIs $75k-100k, 54.7% for AGIs $100k-200k, 31.2% for AGIs over 200k)
Taxable interest for individuals: $1,637 (reported on 27.3% of returns)
This zip code:
$1,637
Michigan:
$1,491
(% of AGI for various income ranges: 1.6% for AGIs below $25k, 0.6% for AGIs $25k-50k, 0.6% for AGIs $50k-75k, 1.0% for AGIs $75k-100k, 1.9% for AGIs $100k-200k, 1.1% for AGIs over 200k)
Ordinary dividends: $3,260 (reported on 15.4% of returns)
Here:
$3,260
State:
$6,225
(% of AGI for various income ranges: 1.6% for AGIs below $25k, 0.6% for AGIs $25k-50k, 0.6% for AGIs $50k-75k, 1.3% for AGIs $75k-100k, 3.7% for AGIs $100k-200k)
Net capital gain/loss in AGI: +$4,514 (reported on 12.8% of returns)
Here:
+$4,514
State:
+$9,326
(% of AGI for various income ranges: 0.3% for AGIs below $25k, 0.3% for AGIs $25k-50k, 1.0% for AGIs $50k-75k, 0.3% for AGIs $75k-100k, 4.4% for AGIs $100k-200k, 2.2% for AGIs over 200k)
Profit/loss from business: +$7,283 (reported on 12.8% of returns)
Here:
+$7,283
State:
+$11,523
(% of AGI for various income ranges: 5.2% for AGIs below $25k, 1.8% for AGIs $25k-50k, 2.2% for AGIs $50k-75k, 1.4% for AGIs $75k-100k, 3.2% for AGIs $100k-200k)
Taxable individual retirement arrangement distribution: $12,648 (reported on 11.9% of returns)
49455:
$12,648
Michigan:
$15,298
(% of AGI for various income ranges: 4.1% for AGIs below $25k, 3.0% for AGIs $25k-50k, 2.8% for AGIs $50k-75k, 4.4% for AGIs $75k-100k, 8.2% for AGIs $100k-200k)
Total itemized deductions: $20,238 (20% of AGI, reported on 18.5% of returns)
Here:
$20,238
State:
$21,628
Here:
20.4% of AGI
State:
18.4% of AGI
(% of AGI for various income ranges: 6.5% for AGIs below $25k, 6.5% for AGIs $25k-50k, 7.3% for AGIs $50k-75k, 11.1% for AGIs $75k-100k, 13.1% for AGIs $100k-200k, 10.8% for AGIs over 200k)
Charity contributions: $5,684 (reported on 14.1% of returns)
Here:
$5,684
State:
$4,225
(% of AGI for various income ranges: 0.7% for AGIs below $25k, 1.1% for AGIs $25k-50k, 1.0% for AGIs $50k-75k, 2.2% for AGIs $75k-100k, 2.5% for AGIs $100k-200k, 4.2% for AGIs over 200k)
Taxes paid: $7,240 (reported on 18.5% of returns)
49455:
$7,240
State:
$8,327
(% of AGI for various income ranges: 1.3% for AGIs below $25k, 1.7% for AGIs $25k-50k, 2.3% for AGIs $50k-75k, 3.6% for AGIs $75k-100k, 5.4% for AGIs $100k-200k, 5.5% for AGIs over 200k)
Earned income credit: $2,350 (reported on 22.0% of returns)
Here:
$2,350
State:
$2,306
(% of AGI for various income ranges: 6.3% for AGIs below $25k, 1.6% for AGIs $25k-50k)
Percentage of individuals using paid preparers for their 2012 taxes: 63.9%
Here:
64%
State:
57%
(% for various income ranges: 59.6% for AGIs below $25k, 62.5% for AGIs $25k-50k, 71.4% for AGIs $50k-75k, 71.4% for AGIs $75k-100k, 75.0% for AGIs $100k-200k, 100.0% for AGIs over 200k)
Averages for the 2004 tax year for zip code 49455, filed in 2005:
Average Adjusted Gross Income (AGI) in 2004: $36,432 (Individual Income Tax Returns)
Here:
$36,432
State:
$48,204
Salary/wage: $31,213 (reported on 83.9% of returns)
Here:
$31,213
State:
$42,791
(% of AGI for various income ranges: 99.4% for AGIs below $10k, 74.2% for AGIs $10k-25k, 79.5% for AGIs $25k-50k, 80.0% for AGIs $50k-75k, 74.7% for AGIs $75k-100k, 51.2% for AGIs over 100k)
Taxable interest for individuals: $2,380 (reported on 41.3% of returns)
This zip code:
$2,380
Michigan:
$1,725
(% of AGI for various income ranges: 5.1% for AGIs below $10k, 2.5% for AGIs $10k-25k, 1.5% for AGIs $25k-50k, 2.5% for AGIs $50k-75k, 1.8% for AGIs $75k-100k, 4.5% for AGIs over 100k)
Taxable dividends: $3,253 (reported on 19.0% of returns)
Here:
$3,253
State:
$3,420
(% of AGI for various income ranges: 4.2% for AGIs below $10k, 1.2% for AGIs $10k-25k, 1.5% for AGIs $25k-50k, 0.8% for AGIs $50k-75k, 1.6% for AGIs $75k-100k, 2.8% for AGIs over 100k)
Net capital gain/loss: +$11,207 (reported on 15.3% of returns)
Here:
+$11,207
State:
+$8,532
(% of AGI for various income ranges: -2.5% for AGIs below $10k, 0.6% for AGIs $10k-25k, 0.4% for AGIs $25k-50k, 1.7% for AGIs $50k-75k, 3.3% for AGIs $75k-100k, 15.5% for AGIs over 100k)
Profit/loss from business: +$5,785 (reported on 15.3% of returns)
Here:
+$5,785
State:
+$9,547
(% of AGI for various income ranges: 3.9% for AGIs below $10k, 4.0% for AGIs $10k-25k, 2.6% for AGIs $25k-50k, 2.3% for AGIs $50k-75k, 3.1% for AGIs $75k-100k, 1.1% for AGIs over 100k)
IRA payment deduction: $2,864 (reported on 3.0% of returns)
49455:
$2,864
Michigan:
$2,875
Total itemized deductions: $16,809 (22% of AGI, reported on 21.5% of returns)
Here:
$16,809
State:
$18,509
Here:
21.9% of AGI
State:
20.7% of AGI
(% of AGI for various income ranges: 4.8% for AGIs below $10k, 6.4% for AGIs $10k-25k, 10.0% for AGIs $25k-50k, 8.9% for AGIs $50k-75k, 11.7% for AGIs $75k-100k, 12.1% for AGIs over 100k)
Charity contributions deductions: $3,651 (4% of AGI, reported on 17.0% of returns)
Here:
$3,651
State:
$3,365
Here:
4.4% of AGI
State:
3.6% of AGI
(% of AGI for various income ranges: 0.9% for AGIs $10k-25k, 1.2% for AGIs $25k-50k, 1.2% for AGIs $50k-75k, 2.2% for AGIs $75k-100k, 3.0% for AGIs over 100k)
Total tax: $5,194 (reported on 65.9% of returns)
49455:
$5,194
State:
$7,691
(% of AGI for various income ranges: 2.1% for AGIs below $10k, 3.1% for AGIs $10k-25k, 5.7% for AGIs $25k-50k, 8.2% for AGIs $50k-75k, 10.5% for AGIs $75k-100k, 17.6% for AGIs over 100k)
Earned income credit: $1,818 (reported on 17.8% of returns)
Here:
$1,818
State:
$1,737
Percentage of individuals using paid preparers for their 2004 taxes: 60.8%
Here:
61%
State:
60%
(% for various income ranges: 48.6% for AGIs below $10k, 62.9% for AGIs $10k-25k, 62.1% for AGIs $25k-50k, 66.4% for AGIs $50k-75k, 69.0% for AGIs $75k-100k, 79.6% for AGIs over 100k)
Household received Food Stamps/SNAP in the past 12 months: 238 Household did not receive Food Stamps/SNAP in the past 12 months: 1,691
Women who had a birth in the past 12 months: 73 (51 now married, 21 unmarried) Women who did not have a birth in the past 12 months: 1,005 (413 now married, 591 unmarried)
Housing units in zip code 49455 with a mortgage: 783 (49 second mortgage, 37 both second mortgage and home equity loan) Houses without a mortgage: 20
Median monthly owner costs for units with a mortgage: $1,041 Median monthly owner costs for units without a mortgage: $445
Residents with income below the poverty level in 2022:
This zip code:
11.0%
Whole state:
13.4%
Residents with income below 50% of the poverty level in 2022:
This zip code:
5.9%
Whole state:
6.9%
Median number of rooms in houses and condos:
Here:
6.2
State:
6.5
Median number of rooms in apartments:
Here:
4.1
State:
4.3
Notable locations in this zip code not listed on our city pages
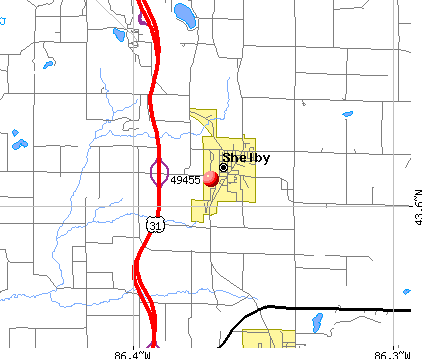
Notable locations in zip code 49455: Hart Rest Area (A), Benona Shores Golf Course (B), Oceana Country Club (C), Shelby Benona Fire Department (D), Oceana County Emergency Ambulance Services Station 2 (E), Ferry Township Fire Department (F), Shelby Public Library (G), Shelby Village Hall (H). Display/hide their locations on the map
Churches in zip code 49455 include: Ferry United Methodist Church (A), Shelby Wesleyan Church (B), Ferry Wesleyan Church (C), Shelby Assembly of God Church (D), Seventh Day Adventist Church (E), United Methodist Church (F), Congregational Church (G), New Hope Community Church (H), Spanish Pentecostal Church (I). Display/hide their locations on the map
Cemeteries: Saint Stephen's Lutheran Cemetery (1), Mennonite Cemetery (2), North Ferry Cemetery (3), Mount Hope Cemetery (4), Stony Lake Cemetery (5), Ferry Cemetery (6), Gardner Cemetery (7). Display/hide their locations on the map
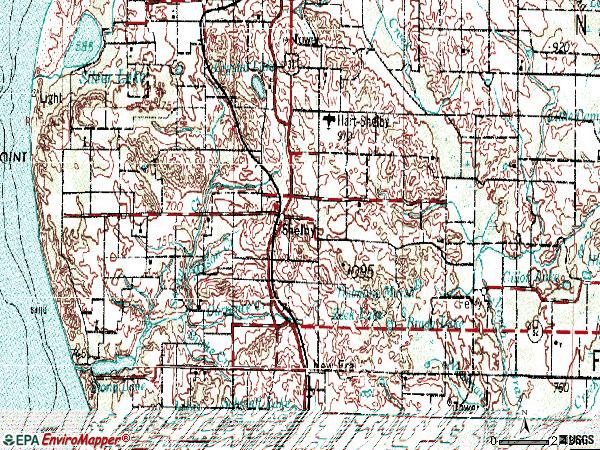
Lakes and swamps: Bragg Lake (A), Landin Lake (B), Helldiver Lake (C), Marshville Pond (D), Moody Lake (E), Bear Lake (F), Potters Marsh (G), Saddleback Lake (H). Display/hide their locations on the map
Creeks: Burke Creek (A), Bender Creek (B), Dorrance Creek (C), Mason Creek (D), Piper Creek (E), Cargill Creek (F), Robinson Creek (G), Stony Creek (H). Display/hide their locations on the map
In group quarters: 101 (-1 institutionalized population)
Size of family households: 623 2-persons, 242 3-persons, 277 4-persons, 135 5-persons, 45 6-persons, 29 7-or-more-persons
Size of nonfamily households: 535 1-person, 30 2-persons, 3 3-persons
675 married couples with children.
424 single-parent households (166 men, 258 women).
77.5% of residents of 49455 zip code speak English at home.
22.5% of residents speak Spanish at home (67% very well, 21% well, 4% not well, 8% not at all).
0.7% of residents speak other Indo-European language at home (72% very well, 16% well, 12% not well).
Foreign born population: 439 (8.5%) (25.4% of them are naturalized citizens)
This zip code:
8.5%
Whole state:
6.9%
84%Honduras
2%Malaysia
2%Chile
1%El Salvador
1%Costa Rica
1%Bosnia and Herzegovina
1%Moldova
12%German
10%American
4%English
4%Dutch
3%Polish
2%European
2%Irish
Year of entry for the foreign-born population
1072010 or later
1092000 to 2009
1881990 to 1999
40Before 1990
Major facilities with environmental interests located in this zip code:
BENONA ELEMENTARY SCHOOL (2692 S. 40TH AVENUE in SHELBY, MI)
(National Center for Education Statistics) - STATE ID-00280 Organizations: SHELBY PUBLIC SCHOOLS (SCHOOL DISTRICT)
FERRY ELEMENTARY SCHOOL (3301 S. GREEN STREET in SHELBY, MI)
(National Center for Education Statistics) - STATE ID-05095 Organizations: SHELBY PUBLIC SCHOOLS (SCHOOL DISTRICT)
G & H LDFL (INTERSECTION RYAN RD & 23-MILE RD in SHELBY, MI)
(Integrated Compliance Information System) - ICIS-05-1997-0132, FORMAL ENFORCEMENT ACTION Business SIC classification: REFUSE SYSTEMS
AMERICAN YOUTH FOUNDATION (8845 W. GARFIELD RD. in SHELBY, MI)
(Resource Conservation and Recovery Act (tracking hazardous waste))
MI DEPT/TRANSPORTATION BRIDGE B03-50013 (M-53 OVER MID BR CLINTON RIV in SHELBY, MI)
(Resource Conservation and Recovery Act (tracking hazardous waste)) Organizations: MICH DEPT OF TRANSPORTATION (CONTACT/OPERATOR)
Alternative names: MIDOT BRIDGE M-53 OVER MID BR CLINTON RI
CHEEVER'S INC (37 W. THIRD ST in SHELBY, MI)
COMPLIANCE ACTIVITY (Tracking inspections of insecticide, fungicide, and rodenticide, and toxic substances) Business SIC classification: PESTICIDES AND AGRICULTURAL CHEMICALS
BEYERS US 31 SUNOCO SERV STA (4260 W SHELBY RD in SHELBY, MI)
(Resource Conservation and Recovery Act (tracking hazardous waste))
MI DEPT/ENVIRONMENTAL QUALITY (2220 E MAIN STREET in SHELBY, MI)
(Resource Conservation and Recovery Act (tracking hazardous waste)) Alternative names: MI DEPT/NATURAL RESOURCES
MI DEPT/NATURAL RESOURCES (260 SOUTH STATE ST in SHELBY, MI)
(Resource Conservation and Recovery Act (tracking hazardous waste)) Alternative names: MI DEPT/NATURAL RESOURCES RED
MI DEPT/TRANSPORTATION BRIDGE (US-31 NB & SB OVER CSXRR & LOG in SHELBY, MI)
Conditionally Exempt Small Quantity Generators, less than 100 kg/month of hazardous waste (Resource Conservation and Recovery Act (tracking hazardous waste)) Organizations: MICH DEPT OF TRANSPORTATION (CONTACT/OPERATOR)
Housing units lacking complete plumbing facilities: 1.5% Housing units lacking complete kitchen facilities: 0.9%
42.4%Utility gas
26.9%Bottled, tank, or LP gas
11.5%Wood
10.9%Electricity
3.1%Other fuel
3.0%Fuel oil, kerosene, etc.
1.8%Solar energy
Population in 1990: 4,420. Population change in the 1990s: +790 (+17.9%).
Place of birth for U.S.-born residents:
This state: 3,853
Northeast: 67
Midwest: 285
South: 361
West: 105
64% of the 49455 zip code residents lived in the same house 5 years ago. Out of people who lived in different houses, 56% lived in this county. Out of people who lived in different counties, 50% lived in Michigan.
90% of the 49455 zip code residents lived in the same house 1 year ago. Out of people who lived in different houses, 43% moved from this county. Out of people who lived in different houses, 36% moved from different county within same state. Out of people who lived in different houses, 21% moved from different state.
Private vs. public school enrollment:
Students in private schools in grades 1 to 8 (elementary and middle school): 45
Here:
8.5%
Michigan:
12.4%
Students in private schools in grades 9 to 12 (high school): 18
Here:
6.6%
Michigan:
9.8%
Students in private undergraduate colleges: 23
Here:
14.3%
Michigan:
14.9%
Occupation by median earnings in the past 12 months ($)
124,421Arts, design, entertainment, sports, and media occupations
107,325Computer and mathematical occupations
91,360Architecture and engineering occupations
81,299Law enforcement workers including supervisors
53,384Management occupations
51,418Business and financial operations occupations
Top industries in this zip code by the number of employees in 2005:
Wholesale Trade: Other Grocery and Related Products Merchant Wholesalers (50-99 employees: 1 establishment)
Health Care and Social Assistance: General Medical and Surgical Hospitals (50-99: 1)
Wholesale Trade: Fresh Fruit and Vegetable Merchant Wholesalers (50-99: 1)
Finance and Insurance: Commercial Banking (20-49: 1)
People in group quarters in 2010:
23 people in group homes intended for adults
3 people in workers' group living quarters and job corps centers
People in group quarters in 2000:
57 people in agriculture workers' dormitories on farms
12 people in unknown juvenile institutions
5 people in wards in general hospitals for patients who have no usual home elsewhere
2 people in other group homes
Fatal accident statistics in 2012:
Fatal accident count: 1
Vehicles involved in fatal accidents: 1
Fatal accidents caused by drunken drivers: 0
Fatalities: 1
Persons involved in fatal accidents: 1
Pedestrians involved in fatal accidents: 0
2002 - 2018 National Fire Incident Reporting System (NFIRS) incidents
According to the data from the years 2002 - 2018 the average number of fire incidents per year is 28. The highest number of reported fire incidents - 54 took place in 2012, and the least - 7 in 2008. The data has a rising trend.
When looking into fire subcategories, the most incidents belonged to: Structure Fires (47.3%), and Outside Fires (30.3%).
Fire incident types reported to NFIRS in Zip Code 49455


 Nearest zip codes: 49446, 49436, 49420, 49437, 49452, 49449.


 According to the data from the years 2002 - 2018 the average number of fire incidents per year is 28. The highest number of reported fire incidents - 54 took place in 2012, and the least - 7 in 2008. The data has a rising trend.
 When looking into fire subcategories, the most incidents belonged to: Structure Fires (47.3%), and Outside Fires (30.3%).