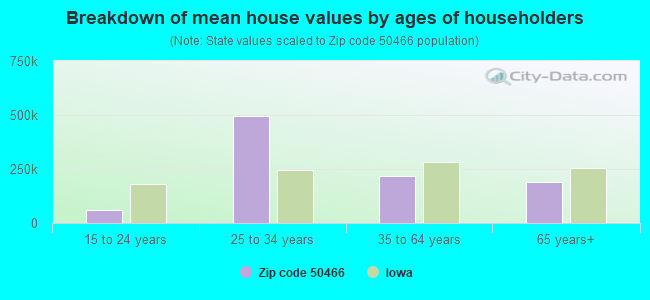
Estimated zip code population in 2022: 2,049 Zip code population in 2010: 1,828 Zip code population in 2000: 1,916
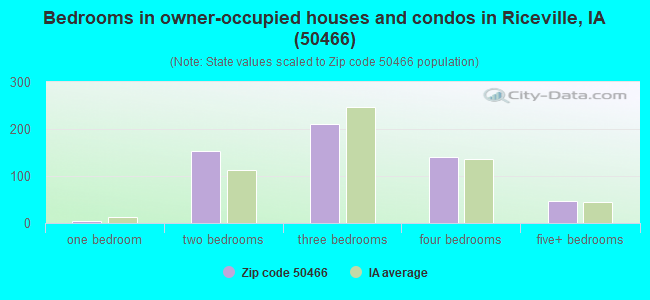
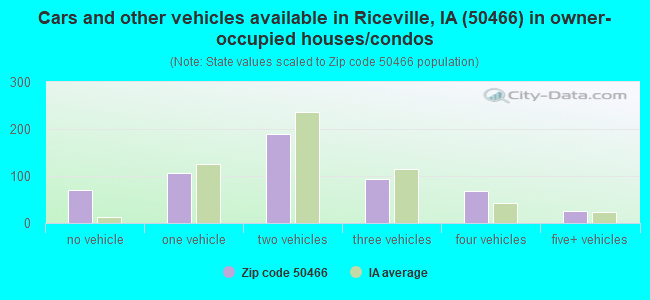
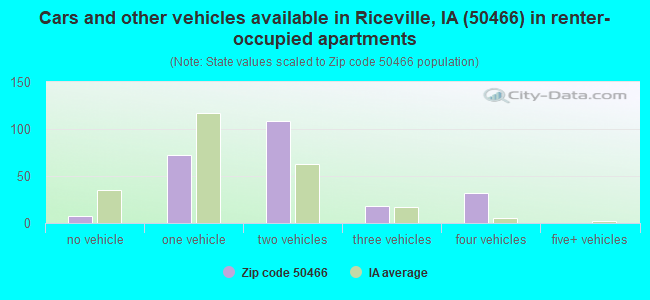
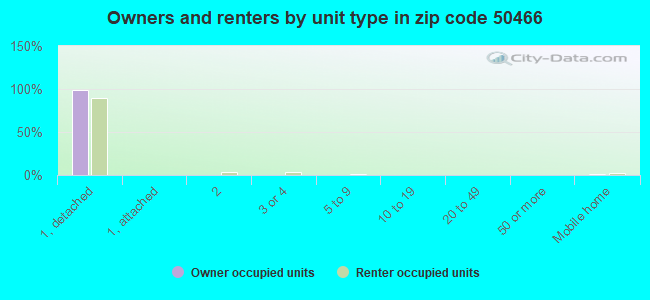
Houses and condos: 911 Renter-occupied apartments: 242
% of renters here:
30%
State:
28%
March 2022 cost of living index in zip code 50466: 82.5 (low, U.S. average is 100)
Land area: 136.7 sq. mi. Water area: 0.1 sq. mi.
Population density: 15 people per square mile
(very low).
OSM Map
General Map
Google Map
MSN Map
OSM Map
General Map
Google Map
MSN Map
OSM Map
General Map
Google Map
MSN Map
OSM Map
General Map
Google Map
MSN Map
Please wait while loading the map...
Real estate property taxes paid for housing units in 2022:
This zip code:
1.1% ($1,616)
Iowa:
1.4% ($2,724)
Median real estate property taxes paid for housing units with mortgages in 2022: $1,629 (1.0%) Median real estate property taxes paid for housing units with no mortgage in 2022: $1,620 (1.1%)
Business Search- 14 Million verified businesses
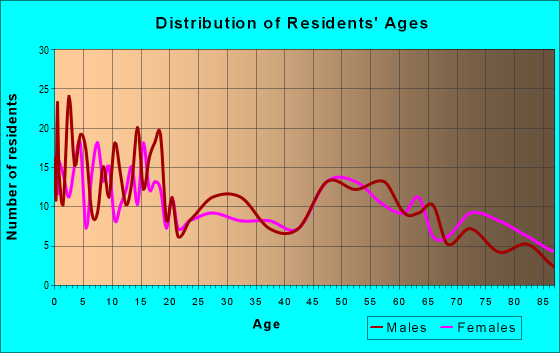
Males: 1,114
(54.4%)
Females: 935
(45.6%)
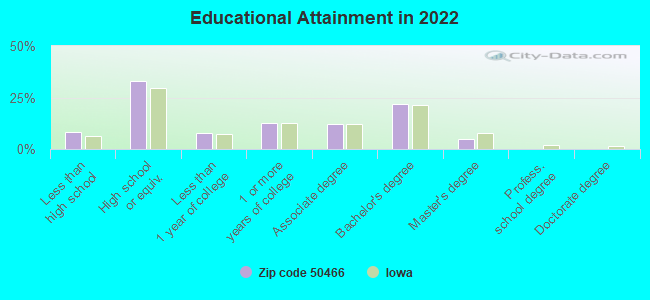
For population 25 years and over in 50466:
High school or higher: 90.6%
Bachelor's degree or higher: 26.2%
Graduate or professional degree: 4.7%
Unemployed: 1.5%
Mean travel time to work (commute): 27.5 minutes
For population 15 years and over in 50466:
Never married: 28.6%
Now married: 60.2%
Separated: 0.7%
Widowed: 5.7%
Divorced: 4.9%
Zip code 50466 compared to state average:
Unemployed percentage below state average.
Black race population percentage significantly below state average.
Foreign-born population percentage below state average.
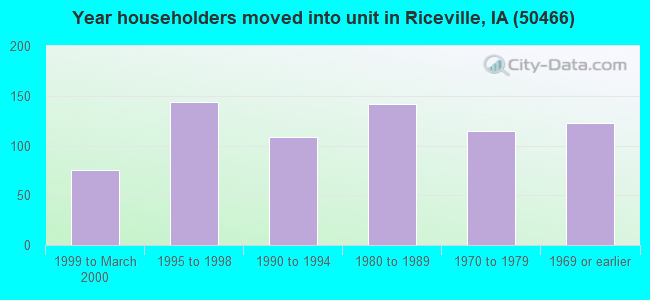
Length of stay since moving in above state average.
House age above state average.
Number of college students significantly below state average.
Averages for the 2020 tax year for zip code 50466, filed in 2021:
Average Adjusted Gross Income (AGI) in 2020: $54,642 (Individual Income Tax Returns)
Here:
$54,642
State:
$71,087
Salary/wage: $41,997 (reported on 75.3% of returns)
Here:
$41,997
State:
$57,361
(% of AGI for various income ranges: 1399.2% for AGIs below $25k, 3871.7% for AGIs $25k-50k, 7241.2% for AGIs $50k-75k, 11130.0% for AGIs $75k-100k, 16462.5% for AGIs $100k-200k)
Taxable interest for individuals: $1,846 (reported on 45.7% of returns)
This zip code:
$1,846
Iowa:
$1,633
(% of AGI for various income ranges: 85.4% for AGIs below $25k, 51.1% for AGIs $25k-50k, 227.5% for AGIs $50k-75k, 267.5% for AGIs $75k-100k, 477.5% for AGIs $100k-200k)
Ordinary dividends: $1,783 (reported on 22.2% of returns)
Here:
$1,783
State:
$5,432
(% of AGI for various income ranges: 21.5% for AGIs below $25k, 35.6% for AGIs $25k-50k, 138.8% for AGIs $50k-75k, 45.0% for AGIs $75k-100k, 250.0% for AGIs $100k-200k)
Net capital gain/loss in AGI: +$5,872 (reported on 22.2% of returns)
Here:
+$5,872
State:
+$15,243
(% of AGI for various income ranges: 31.5% for AGIs below $25k, 90.6% for AGIs $25k-50k, 245.0% for AGIs $50k-75k, 307.5% for AGIs $75k-100k, 1335.0% for AGIs $100k-200k)
Profit/loss from business: +$9,407 (reported on 17.3% of returns)
Here:
+$9,407
State:
+$11,763
(% of AGI for various income ranges: 230.8% for AGIs below $25k, 228.9% for AGIs $25k-50k, 537.5% for AGIs $50k-75k, 437.5% for AGIs $100k-200k)
Taxable individual retirement arrangement distribution: $15,611 (reported on 11.1% of returns)
50466:
$15,611
Iowa:
$17,324
(% of AGI for various income ranges: 90.0% for AGIs below $25k, 68.9% for AGIs $25k-50k, 526.2% for AGIs $50k-75k, 1857.5% for AGIs $100k-200k)
Total itemized deductions: $25,533 (reported on 3.7% of returns)
Here:
$25,533
State:
$33,775
(% of AGI for various income ranges: 425.6% for AGIs $25k-50k)
Taxes paid: $3,100 (reported on 3.7% of returns)
50466:
$3,100
State:
$7,704
(% of AGI for various income ranges: 51.7% for AGIs $25k-50k)
Earned income credit: $2,080 (reported on 12.3% of returns)
Here:
$2,080
State:
$2,195
(% of AGI for various income ranges: 76.2% for AGIs below $25k, 60.6% for AGIs $25k-50k)
Percentage of individuals using paid preparers for their 2020 taxes: 85.2%
Here:
85%
State:
95%
(% for various income ranges: 78.3% for AGIs below $25k, 84.6% for AGIs $25k-50k, 92.9% for AGIs $50k-75k, 87.5% for AGIs $75k-100k, 90.0% for AGIs $100k-200k)
Averages for the 2012 tax year for zip code 50466, filed in 2013:
Average Adjusted Gross Income (AGI) in 2012: $49,286 (Individual Income Tax Returns)
Here:
$49,286
State:
$58,860
Salary/wage: $35,034 (reported on 73.7% of returns)
Here:
$35,034
State:
$46,659
(% of AGI for various income ranges: 71.0% for AGIs below $25k, 73.0% for AGIs $25k-50k, 64.5% for AGIs $50k-75k, 48.5% for AGIs $75k-100k, 27.8% for AGIs $100k-200k)
Taxable interest for individuals: $1,534 (reported on 50.0% of returns)
This zip code:
$1,534
Iowa:
$1,537
(% of AGI for various income ranges: 2.3% for AGIs below $25k, 2.1% for AGIs $25k-50k, 1.6% for AGIs $50k-75k, 1.5% for AGIs $75k-100k, 1.0% for AGIs $100k-200k)
Ordinary dividends: $1,582 (reported on 22.4% of returns)
Here:
$1,582
State:
$4,542
(% of AGI for various income ranges: 1.0% for AGIs below $25k, 0.9% for AGIs $25k-50k, 1.7% for AGIs $50k-75k, 0.2% for AGIs $100k-200k)
Net capital gain/loss in AGI: +$8,587 (reported on 19.7% of returns)
Here:
+$8,587
State:
+$11,802
(% of AGI for various income ranges: 0.5% for AGIs $25k-50k, 2.6% for AGIs $50k-75k, 8.1% for AGIs $100k-200k)
Profit/loss from business: +$5,294 (reported on 22.4% of returns)
Here:
+$5,294
State:
+$10,509
(% of AGI for various income ranges: 9.8% for AGIs below $25k, 3.3% for AGIs $25k-50k, 2.7% for AGIs $50k-75k, 2.0% for AGIs $75k-100k)
Taxable individual retirement arrangement distribution: $6,790 (reported on 13.2% of returns)
50466:
$6,790
Iowa:
$11,773
(% of AGI for various income ranges: 3.1% for AGIs below $25k, 1.6% for AGIs $25k-50k, 5.5% for AGIs $50k-75k)
Total itemized deductions: $20,293 (23% of AGI, reported on 19.7% of returns)
Here:
$20,293
State:
$21,278
Here:
22.9% of AGI
State:
18.9% of AGI
(% of AGI for various income ranges: 11.9% for AGIs $25k-50k, 13.6% for AGIs $50k-75k, 7.3% for AGIs $100k-200k)
Charity contributions: $4,077 (reported on 17.1% of returns)
Here:
$4,077
State:
$4,044
(% of AGI for various income ranges: 1.8% for AGIs $25k-50k, 2.8% for AGIs $50k-75k, 1.2% for AGIs $100k-200k)
Taxes paid: $6,047 (reported on 19.7% of returns)
50466:
$6,047
State:
$8,846
(% of AGI for various income ranges: 1.9% for AGIs $25k-50k, 3.2% for AGIs $50k-75k, 3.8% for AGIs $100k-200k)
Earned income credit: $2,022 (reported on 11.8% of returns)
Here:
$2,022
State:
$2,098
(% of AGI for various income ranges: 3.3% for AGIs below $25k, 1.0% for AGIs $25k-50k)
Percentage of individuals using paid preparers for their 2012 taxes: 78.9%
Here:
79%
State:
65%
(% for various income ranges: 69.2% for AGIs below $25k, 83.3% for AGIs $25k-50k, 84.6% for AGIs $50k-75k, 83.3% for AGIs $75k-100k, 85.7% for AGIs $100k-200k)
Averages for the 2004 tax year for zip code 50466, filed in 2005:
Average Adjusted Gross Income (AGI) in 2004: $33,345 (Individual Income Tax Returns)
Here:
$33,345
State:
$43,875
Salary/wage: $27,456 (reported on 77.5% of returns)
Here:
$27,456
State:
$38,265
(% of AGI for various income ranges: 149.2% for AGIs below $10k, 60.6% for AGIs $10k-25k, 72.0% for AGIs $25k-50k, 70.4% for AGIs $50k-75k, 74.6% for AGIs $75k-100k, 25.2% for AGIs over 100k)
Taxable interest for individuals: $1,927 (reported on 56.4% of returns)
This zip code:
$1,927
Iowa:
$1,768
(% of AGI for various income ranges: 20.7% for AGIs below $10k, 7.7% for AGIs $10k-25k, 2.8% for AGIs $25k-50k, 2.2% for AGIs $50k-75k, 0.7% for AGIs $75k-100k, 1.3% for AGIs over 100k)
Taxable dividends: $1,314 (reported on 26.6% of returns)
Here:
$1,314
State:
$2,510
(% of AGI for various income ranges: 5.7% for AGIs below $10k, 1.5% for AGIs $10k-25k, 0.5% for AGIs $25k-50k, 0.9% for AGIs $50k-75k, 0.1% for AGIs $75k-100k, 2.0% for AGIs over 100k)
Net capital gain/loss: +$4,187 (reported on 22.7% of returns)
Here:
+$4,187
State:
+$6,139
(% of AGI for various income ranges: -0.8% for AGIs below $10k, 2.1% for AGIs $10k-25k, 0.7% for AGIs $25k-50k, 4.4% for AGIs $50k-75k, 6.7% for AGIs over 100k)
Profit/loss from business: +$4,866 (reported on 18.4% of returns)
Here:
+$4,866
State:
+$8,574
(% of AGI for various income ranges: 4.6% for AGIs below $10k, 8.1% for AGIs $10k-25k, 4.1% for AGIs $25k-50k, 0.3% for AGIs $50k-75k)
Profit/loss from farming: +$3,855 (reported on 20.8% of returns)
Here:
+$3,855
State:
-$74
(% of AGI for various income ranges: -30.4% for AGIs below $10k, 6.5% for AGIs $10k-25k, 3.0% for AGIs $25k-50k, 3.2% for AGIs $50k-75k)
IRA payment deduction: $2,846 (reported on 3.6% of returns)
50466:
$2,846
Iowa:
$2,970
Total itemized deductions: $13,146 (25% of AGI, reported on 18.8% of returns)
Here:
$13,146
State:
$16,976
Here:
24.8% of AGI
State:
20.8% of AGI
(% of AGI for various income ranges: 12.3% for AGIs $10k-25k, 5.5% for AGIs $25k-50k, 7.7% for AGIs $50k-75k, 8.1% for AGIs $75k-100k, 6.1% for AGIs over 100k)
Charity contributions deductions: $1,952 (4% of AGI, reported on 14.4% of returns)
Here:
$1,952
State:
$3,089
Here:
3.9% of AGI
State:
3.6% of AGI
(% of AGI for various income ranges: 1.5% for AGIs $10k-25k, 0.5% for AGIs $25k-50k, 1.0% for AGIs $50k-75k, 2.2% for AGIs $75k-100k)
Total tax: $4,145 (reported on 75.3% of returns)
50466:
$4,145
State:
$6,177
(% of AGI for various income ranges: 8.4% for AGIs below $10k, 4.4% for AGIs $10k-25k, 7.4% for AGIs $25k-50k, 8.1% for AGIs $50k-75k, 9.1% for AGIs $75k-100k, 20.6% for AGIs over 100k)
Earned income credit: $1,520 (reported on 13.4% of returns)
Here:
$1,520
State:
$1,540
Percentage of individuals using paid preparers for their 2004 taxes: 83.2%
Here:
83%
State:
70%
(% for various income ranges: 77.4% for AGIs below $10k, 78.4% for AGIs $10k-25k, 86.9% for AGIs $25k-50k, 94.0% for AGIs $50k-75k, 77.3% for AGIs $75k-100k, 78.9% for AGIs over 100k)
Household received Food Stamps/SNAP in the past 12 months: 58 Household did not receive Food Stamps/SNAP in the past 12 months: 738
Women who had a birth in the past 12 months: 17 (16 now married, 0 unmarried) Women who did not have a birth in the past 12 months: 326 (190 now married, 135 unmarried)
Housing units in zip code 50466 with a mortgage: 211 (18 second mortgage, 12 both second mortgage and home equity loan) Houses without a mortgage: 9
Median monthly owner costs for units with a mortgage: $1,279 Median monthly owner costs for units without a mortgage: $621
Residents with income below the poverty level in 2022:
This zip code:
10.1%
Whole state:
11.0%
Residents with income below 50% of the poverty level in 2022:
This zip code:
4.7%
Whole state:
5.5%
Median number of rooms in houses and condos:
Here:
6.6
State:
6.8
Median number of rooms in apartments:
Here:
7.1
State:
4.2
Notable locations in this zip code not listed on our city pages
Notable locations in zip code 50466: Nelson (A), White Tail Ridge Farms (B), Fisher Ranch (C), Valley Road Farms (D), Myers Farm (E), Jamestown Highway Rest Area (F), Farmers Feed and Grain Company Elevator (G), Riceville Country Club (H), Riceville Community Center (I), Riceville Fire Department (J), Riceville City Hall (K), Riceville Library (L), Riceville Ambulance Service Incorporated (M). Display/hide their locations on the map
Cemeteries: Reckner Cemetery (1), Jenkins Township Cemetery (2), Calvary Cemetery (3), Saint Peters Cemetery (4), Wayne Cemetery (5). Display/hide their locations on the map
Parks in zip code 50466 include: Brownville Wildlife Area (1), Lake Hendricks Park (2), Wittenbreer Marsh (3), Cowan Wildlife Area (4), Kleckner Wildlife Area (5). Display/hide their locations on the map
In group quarters: 48 (-1 institutionalized population)
Size of family households: 271 2-persons, 73 3-persons, 37 4-persons, 39 5-persons, 39 6-persons, 40 7-or-more-persons
Size of nonfamily households: 254 1-person, 44 2-persons
488 married couples with children.
106 single-parent households (34 men, 72 women).
83.0% of residents of 50466 zip code speak English at home.
5.3% of residents speak Spanish at home (51% very well, 22% well, 26% not well, 1% not at all).
11.2% of residents speak other Indo-European language at home (97% very well, 3% well).
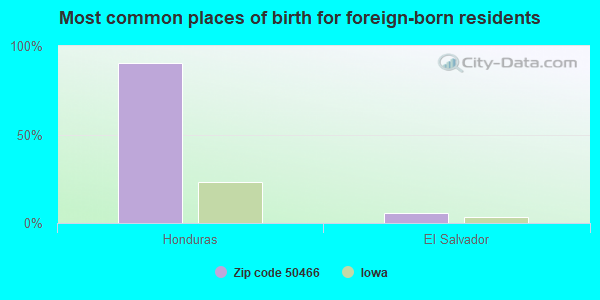
Foreign born population: 55 (2.7%) (21.7% of them are naturalized citizens)
This zip code:
2.7%
Whole state:
6.0%
91%Honduras
6%El Salvador
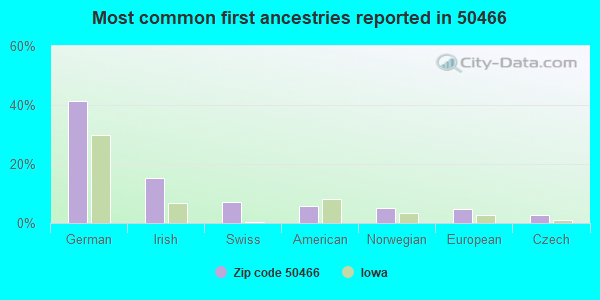
41%German
15%Irish
7%Swiss
6%American
5%Norwegian
5%European
3%Czech
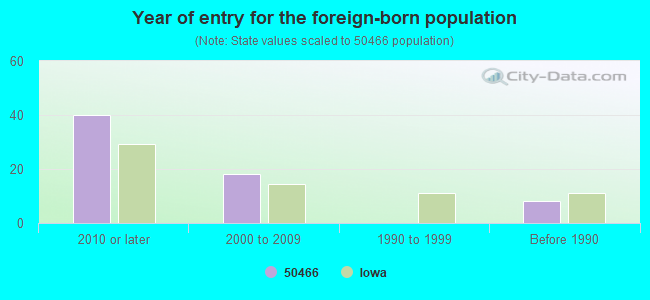
Year of entry for the foreign-born population
402010 or later
182000 to 2009
01990 to 1999
8Before 1990
Facilities with environmental interests located in this zip code:
RICEVILLE ELEMENTARY SCHOOL (912 WOODLAND AVE in RICEVILLE, IA)
(National Center for Education Statistics) - STATE ID-455508 418 Organizations: RICEVILLE COMM SCHOOL DISTRICT (SCHOOL DISTRICT)
RICEVILLE HIGH SCHOOL (912 WOODLAND AVE in RICEVILLE, IA)
(National Center for Education Statistics) - STATE ID-455508 109 Organizations: RICEVILLE COMM SCHOOL DISTRICT (SCHOOL DISTRICT)
BRUENING ROCK PRODUCTS INCORPORATED (11295 JADE AVENUE in RICEVILLE, IA)
National Pollutant Discharge Elimination System NON-MAJOR (Tracking pollutant discharge elimination systems) - permit Business SIC classification: CRUSHED AND BROKEN LIMESTONE Organizations: BRUENING ROCK PRODUCTS, INC. (CONTACT/OWNER)
Alternative names: BRUENING ROCK PROD INC (NELSON, NELSON QUARRY
BRUENING ROCK PRODUCTS INCORPORATED LEROY QUARRY (4318 10TH STREET in RICEVILLE, IA)
National Pollutant Discharge Elimination System NON-MAJOR (Tracking pollutant discharge elimination systems) - permit Business SIC classification: CRUSHED AND BROKEN LIMESTONE Organizations: BRUENING ROCK PRODUCTS, INC. (CONTACT/OWNER)
Alternative names: BRUENING ROCK PROD INC (LEROY
DYNES QUARRY (2825 410TH in RICEVILLE, IA)
National Pollutant Discharge Elimination System NON-MAJOR (Tracking pollutant discharge elimination systems) - permit Business SIC classification: CRUSHED AND BROKEN LIMESTONE Organizations: L. R. FALK CONSTRUCTION CO. (CONTACT/OWNER)
Alternative names: L R FALK CONSTRUCTION CO
ALLIED CONSTRUCTION CO INC (4061 ADDISON in RICEVILLE, IA)
AIR MINOR (AIRS/AFS) Business SIC classification: READY-MIXED CONCRETE
RICEVILLE SEWER TREATMENT PLANT C/O CITY HALL (123 WEST MAIN STREET in RICEVILLE, IA)
National Pollutant Discharge Elimination System NON-MAJOR (Tracking pollutant discharge elimination systems) - permit Business SIC classification: SEWERAGE SYSTEMS Organizations: RICEVILLE CITY OF (CONTACT/OWNER)
Alternative names: RICEVILLE CITY OF STP
STOECKER FARMS (LINKENMEYER) (13678 BELL AVE in RICEVILLE, IA)
AIR MINOR (AIRS/AFS) Business SIC classification: HOGS; REFUSE SYSTEMS
RICEVILLE CSD (912 WOODLAND AVE in RICEVILLE, IA)
COMPLIANCE ACTIVITY (Tracking inspections of insecticide, fungicide, and rodenticide, and toxic substances)
Housing units lacking complete plumbing facilities: 4.0% Housing units lacking complete kitchen facilities: 5.1%
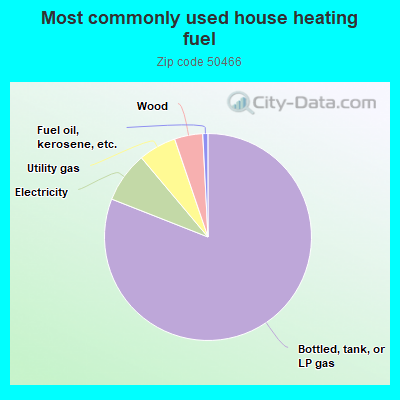
80.9%Bottled, tank, or LP gas
7.9%Electricity
5.9%Utility gas
4.4%Wood
0.8%Fuel oil, kerosene, etc.
Population in 1990: 1,546. Population change in the 1990s: +370 (+23.9%).
Place of birth for U.S.-born residents:
This state: 1,432
Northeast: 67
Midwest: 411
South: 33
West: 32
71% of the 50466 zip code residents lived in the same house 5 years ago. Out of people who lived in different houses, 38% lived in this county. Out of people who lived in different counties, 50% lived in Iowa.
87% of the 50466 zip code residents lived in the same house 1 year ago. Out of people who lived in different houses, 39% moved from this county. Out of people who lived in different houses, 39% moved from different county within same state. Out of people who lived in different houses, 19% moved from different state. Out of people who lived in different houses, 2% moved from abroad.
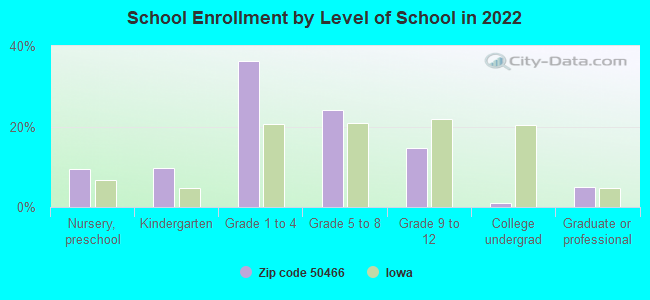
Private vs. public school enrollment:
Students in private schools in grades 1 to 8 (elementary and middle school): 87
Here:
27.8%
Iowa:
10.6%
Students in private schools in grades 9 to 12 (high school):
Here:
0.0%
Iowa:
7.9%
Students in private undergraduate colleges: 3
Here:
66.2%
Iowa:
23.9%
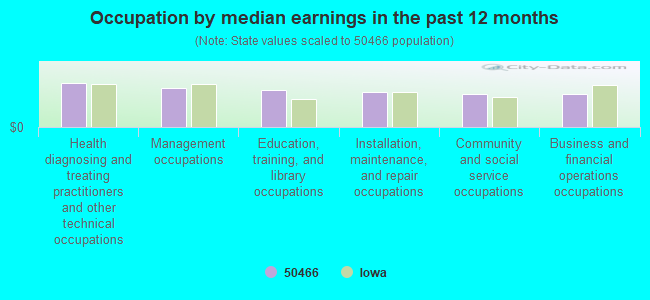
Occupation by median earnings in the past 12 months ($)
66,096Health diagnosing and treating practitioners and other technical occupations
58,231Management occupations
55,677Education, training, and library occupations
53,224Installation, maintenance, and repair occupations
50,216Community and social service occupations
49,554Business and financial operations occupations
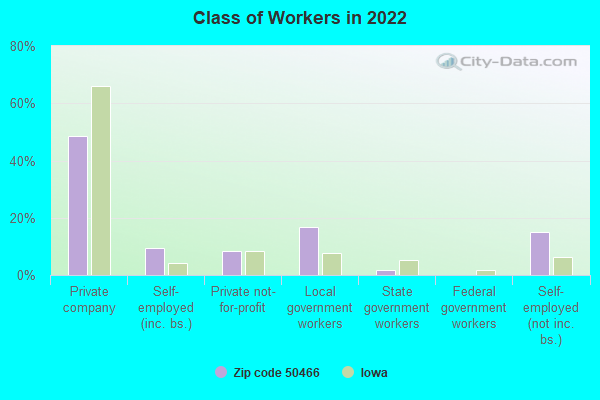
Top industries in this zip code by the number of employees in 2005:
Health Care and Social Assistance: Nursing Care Facilities (20-49 employees: 1 establishment)
Accommodation and Food Services: Full-Service Restaurants (10-19: 1, 1-4: 2)
Finance and Insurance: Commercial Banking (10-19: 1)
Health Care and Social Assistance: Child Day Care Services (5-9: 1, 1-4: 1)
People in group quarters in 2010:
29 people in nursing facilities/skilled-nursing facilities
People in group quarters in 2000:
35 people in nursing homes
Fatal accident statistics in 2014:
Fatal accident count: 2
Vehicles involved in fatal accidents: 3
Fatal accidents caused by drunken drivers: 0
Fatalities: 2
Persons involved in fatal accidents: 4
Pedestrians involved in fatal accidents: 0
2002 - 2018 National Fire Incident Reporting System (NFIRS) incidents
According to the data from the years 2002 - 2018 the average number of fire incidents per year is 8. The highest number of reported fires - 20 took place in 2008, and the least - 0 in 2010. The data has a dropping trend.
When looking into fire subcategories, the most reports belonged to: Outside Fires (31.4%), and Structure Fires (30.0%).
Fire incident types reported to NFIRS in Zip Code 50466


+$3,855
-$74
(% of AGI for various income ranges: -30.4% for AGIs below $10k, 6.5% for AGIs $10k-25k, 3.0% for AGIs $25k-50k, 3.2% for AGIs $50k-75k) Nearest zip codes: 50455, 52134, 55951, 50628, 50454, 55977.
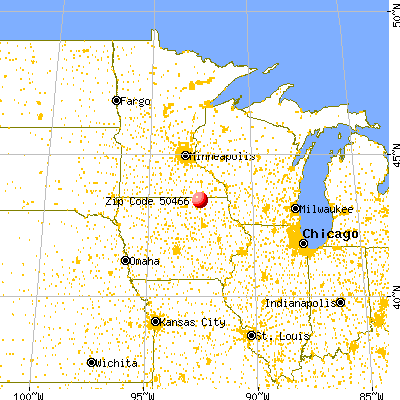
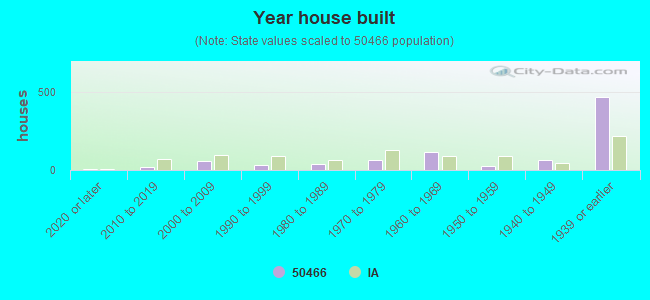


 According to the data from the years 2002 - 2018 the average number of fire incidents per year is 8. The highest number of reported fires - 20 took place in 2008, and the least - 0 in 2010. The data has a dropping trend.
 When looking into fire subcategories, the most reports belonged to: Outside Fires (31.4%), and Structure Fires (30.0%).