Estimated zip code population in 2022: 1,060 Zip code population in 2010: 862 Zip code population in 2000: 964
Houses and condos: 455 Renter-occupied apartments: 20
% of renters here:
5%
State:
28%
March 2022 cost of living index in zip code 51026: 83.2 (low, U.S. average is 100)
Land area: 108.5 sq. mi. Water area: 0.1 sq. mi.
Population density: 10 people per square mile
(very low).
OSM Map
General Map
Google Map
MSN Map
OSM Map
General Map
Google Map
MSN Map
OSM Map
General Map
Google Map
MSN Map
OSM Map
General Map
Google Map
MSN Map
Please wait while loading the map...
Real estate property taxes paid for housing units in 2022:
This zip code:
1.0% ($2,199)
Iowa:
1.4% ($2,724)
Median real estate property taxes paid for housing units with mortgages in 2022: $2,333 (1.0%) Median real estate property taxes paid for housing units with no mortgage in 2022: $1,763 (0.9%)
Business Search- 14 Million verified businesses
Males: 560
(52.8%)
Females: 500
(47.2%)
For population 25 years and over in 51026:
High school or higher: 95.5%
Bachelor's degree or higher: 20.1%
Graduate or professional degree: 6.6%
Mean travel time to work (commute): 25.5 minutes
For population 15 years and over in 51026:
Never married: 25.7%
Now married: 66.6%
Separated: 0.1%
Widowed: 1.5%
Divorced: 6.0%
Zip code 51026 compared to state average:
Unemployed percentage significantly below state average.
Black race population percentage significantly below state average.
Hispanic race population percentage below state average.
Median age above state average.
Foreign-born population percentage significantly below state average.
Renting percentage significantly below state average.
Length of stay since moving in significantly above state average.
Number of college students below state average.
Percentage of population with a bachelor's degree or higher below state average.
Estimated median house/condo value in 2022: $220,318
51026:
$220,318
Iowa:
$194,600
Median resident age:
This zip code:
45.6 years
Iowa median age:
38.9 years
Average household size:
This zip code:
2.4 people
Iowa:
2.3 people
Averages for the 2020 tax year for zip code 51026, filed in 2021:
Average Adjusted Gross Income (AGI) in 2020: $64,508 (Individual Income Tax Returns)
Here:
$64,508
State:
$71,087
Salary/wage: $46,659 (reported on 80.6% of returns)
Here:
$46,659
State:
$57,361
(% of AGI for various income ranges: 1145.0% for AGIs below $25k, 3431.7% for AGIs $25k-50k, 7942.5% for AGIs $50k-75k, 9346.7% for AGIs $75k-100k, 16013.3% for AGIs $100k-200k)
Taxable interest for individuals: $967 (reported on 41.7% of returns)
This zip code:
$967
Iowa:
$1,633
(% of AGI for various income ranges: 21.7% for AGIs below $25k, 11.7% for AGIs $25k-50k, 42.5% for AGIs $50k-75k, 16.7% for AGIs $75k-100k, 343.3% for AGIs $100k-200k)
Ordinary dividends: $2,186 (reported on 19.4% of returns)
Here:
$2,186
State:
$5,432
(% of AGI for various income ranges: 58.3% for AGIs $25k-50k, 393.3% for AGIs $100k-200k)
Net capital gain/loss in AGI: +$2,950 (reported on 16.7% of returns)
Here:
+$2,950
State:
+$15,243
(% of AGI for various income ranges: 88.3% for AGIs $25k-50k, 413.3% for AGIs $100k-200k)
Profit/loss from business: +$8,500 (reported on 16.7% of returns)
Here:
+$8,500
State:
+$11,763
(% of AGI for various income ranges: 666.7% for AGIs below $25k, 366.7% for AGIs $75k-100k)
Taxable individual retirement arrangement distribution: $11,450 (reported on 11.1% of returns)
51026:
$11,450
Iowa:
$17,324
(% of AGI for various income ranges: 1145.0% for AGIs $50k-75k)
Earned income credit: $2,300 (reported on 11.1% of returns)
Here:
$2,300
State:
$2,195
(% of AGI for various income ranges: 153.3% for AGIs below $25k)
Percentage of individuals using paid preparers for their 2020 taxes: 97.2%
Here:
97%
State:
95%
(% for various income ranges: 88.9% for AGIs below $25k, 100.0% for AGIs $25k-50k, 100.0% for AGIs $50k-75k, 100.0% for AGIs $75k-100k, 100.0% for AGIs $100k-200k)
Averages for the 2012 tax year for zip code 51026, filed in 2013:
Average Adjusted Gross Income (AGI) in 2012: $59,084 (Individual Income Tax Returns)
Here:
$59,084
State:
$58,860
Salary/wage: $41,957 (reported on 75.7% of returns)
Here:
$41,957
State:
$46,659
(% of AGI for various income ranges: 70.4% for AGIs below $25k, 77.0% for AGIs $25k-50k, 72.5% for AGIs $50k-75k, 66.9% for AGIs $75k-100k, 29.3% for AGIs $100k-200k)
Taxable interest for individuals: $662 (reported on 35.1% of returns)
This zip code:
$662
Iowa:
$1,537
(% of AGI for various income ranges: 0.8% for AGIs below $25k, 0.2% for AGIs $25k-50k, 0.6% for AGIs $50k-75k, 0.4% for AGIs $100k-200k)
Ordinary dividends: $1,300 (reported on 18.9% of returns)
Here:
$1,300
State:
$4,542
Net capital gain/loss in AGI: +$1,200 (reported on 13.5% of returns)
Here:
+$1,200
State:
+$11,802
Profit/loss from business: +$3,600 (reported on 16.2% of returns)
Here:
+$3,600
State:
+$10,509
Taxable individual retirement arrangement distribution: $8,700 (reported on 8.1% of returns)
51026:
$8,700
Iowa:
$11,773
Total itemized deductions: $18,500 (16% of AGI, reported on 21.6% of returns)
Here:
$18,500
State:
$21,278
Here:
16.1% of AGI
State:
18.9% of AGI
(% of AGI for various income ranges: 22.9% for AGIs below $25k, 11.2% for AGIs $50k-75k, 7.2% for AGIs $100k-200k)
Charity contributions: $2,343 (reported on 18.9% of returns)
Here:
$2,343
State:
$4,044
Taxes paid: $7,825 (reported on 21.6% of returns)
51026:
$7,825
State:
$8,846
(% of AGI for various income ranges: 4.2% for AGIs below $25k, 3.9% for AGIs $50k-75k, 4.2% for AGIs $100k-200k)
Earned income credit: $2,260 (reported on 13.5% of returns)
Here:
$2,260
State:
$2,098
(% of AGI for various income ranges: 5.5% for AGIs below $25k, 1.0% for AGIs $25k-50k)
Percentage of individuals using paid preparers for their 2012 taxes: 78.4%
Here:
78%
State:
65%
(% for various income ranges: 81.8% for AGIs below $25k, 80.0% for AGIs $25k-50k, 71.4% for AGIs $50k-75k, 75.0% for AGIs $75k-100k, 80.0% for AGIs $100k-200k)
Averages for the 2004 tax year for zip code 51026, filed in 2005:
Average Adjusted Gross Income (AGI) in 2004: $37,943 (Individual Income Tax Returns)
Here:
$37,943
State:
$43,875
Salary/wage: $32,941 (reported on 82.1% of returns)
Here:
$32,941
State:
$38,265
(% of AGI for various income ranges: 128.0% for AGIs below $10k, 71.1% for AGIs $10k-25k, 73.8% for AGIs $25k-50k, 80.2% for AGIs $50k-75k, 72.8% for AGIs $75k-100k, 40.8% for AGIs over 100k)
Taxable interest for individuals: $1,140 (reported on 47.6% of returns)
This zip code:
$1,140
Iowa:
$1,768
(% of AGI for various income ranges: 9.4% for AGIs below $10k, 2.2% for AGIs $10k-25k, 2.6% for AGIs $25k-50k, 0.7% for AGIs $50k-75k, 0.5% for AGIs $75k-100k)
Taxable dividends: $648 (reported on 24.1% of returns)
Here:
$648
State:
$2,510
(% of AGI for various income ranges: 1.0% for AGIs $10k-25k, 0.5% for AGIs $25k-50k, 0.3% for AGIs $50k-75k, 0.4% for AGIs $75k-100k)
Net capital gain/loss: +$2,539 (reported on 20.5% of returns)
Here:
+$2,539
State:
+$6,139
(% of AGI for various income ranges: -0.3% for AGIs $10k-25k, 1.8% for AGIs $25k-50k, 0.3% for AGIs $50k-75k, 4.2% for AGIs $75k-100k)
Profit/loss from business: +$5,909 (reported on 15.2% of returns)
Here:
+$5,909
State:
+$8,574
Profit/loss from farming: +$2,013 (reported on 18.2% of returns)
Here:
+$2,013
State:
-$74
(% of AGI for various income ranges: 8.2% for AGIs $10k-25k, 1.7% for AGIs $25k-50k, 1.3% for AGIs $50k-75k, -4.1% for AGIs $75k-100k)
IRA payment deduction: $2,909 (reported on 2.5% of returns)
51026:
$2,909
Iowa:
$2,970
Total itemized deductions: $14,098 (21% of AGI, reported on 23.4% of returns)
Here:
$14,098
State:
$16,976
Here:
21.2% of AGI
State:
20.8% of AGI
(% of AGI for various income ranges: 9.0% for AGIs $10k-25k, 5.5% for AGIs $25k-50k, 10.6% for AGIs $50k-75k, 10.3% for AGIs $75k-100k, 10.4% for AGIs over 100k)
Charity contributions deductions: $1,787 (3% of AGI, reported on 20.5% of returns)
Here:
$1,787
State:
$3,089
Here:
2.6% of AGI
State:
3.6% of AGI
(% of AGI for various income ranges: 0.4% for AGIs $10k-25k, 0.8% for AGIs $25k-50k, 1.7% for AGIs $50k-75k, 1.0% for AGIs $75k-100k, 0.4% for AGIs over 100k)
Total tax: $4,414 (reported on 81.6% of returns)
51026:
$4,414
State:
$6,177
(% of AGI for various income ranges: 4.7% for AGIs below $10k, 6.0% for AGIs $10k-25k, 7.3% for AGIs $25k-50k, 8.1% for AGIs $50k-75k, 12.3% for AGIs $75k-100k, 16.5% for AGIs over 100k)
Earned income credit: $1,725 (reported on 11.7% of returns)
Here:
$1,725
State:
$1,540
Percentage of individuals using paid preparers for their 2004 taxes: 81.8%
Here:
82%
State:
70%
(% for various income ranges: 70.5% for AGIs below $10k, 83.2% for AGIs $10k-25k, 83.6% for AGIs $25k-50k, 87.1% for AGIs $50k-75k, 83.8% for AGIs $75k-100k, 86.7% for AGIs over 100k)
Household received Food Stamps/SNAP in the past 12 months: 11 Household did not receive Food Stamps/SNAP in the past 12 months: 426
Women who did not have a birth in the past 12 months: 179 (95 now married, 83 unmarried)
Housing units in zip code 51026 with a mortgage: 281 (19 second mortgage, 20 both second mortgage and home equity loan) Median monthly owner costs for units with a mortgage: $1,555 Median monthly owner costs for units without a mortgage: $545
Residents with income below the poverty level in 2022:
This zip code:
15.4%
Whole state:
11.0%
Residents with income below 50% of the poverty level in 2022:
This zip code:
12.6%
Whole state:
5.5%
Median number of rooms in houses and condos:
Here:
7.1
State:
6.8
Median number of rooms in apartments:
Here:
6.9
State:
4.2
Notable locations in this zip code not listed on our city pages
Notable locations in zip code 51026: Snyders Grove (A), Grant Center (B), Woodbury County Disaster and Emergency Services (C), Hornick City Hall (D), Hornick Volunteer Fire and Rescue (E). Display/hide their locations on the map
Churches in zip code 51026 include: United Methodist Church (A), Saint John's Evangelical Church (B), Saint John's Lutheran Church (C), First Baptist Church (D), German City Church (E). Display/hide their locations on the map
Rivers and creeks: Wolf Creek (A), Whiskey Creek (B), Weber Creek (C), Lum Hollow Creek (D), West Fork Little Sioux River (E). Display/hide their locations on the map
In group quarters: 5 (-1 institutionalized population)
Size of family households: 183 2-persons, 39 3-persons, 75 4-persons, 16 5-persons, 6 6-persons
Size of nonfamily households: 58 1-person, 35 2-persons, 17 3-persons
165 married couples with children.
9 single-parent households (1 men, 8 women).
98.3% of residents of 51026 zip code speak English at home.
0.3% of residents speak Spanish at home (100% very well).
1.2% of residents speak other Indo-European language at home (100% very well).
Foreign born population: 14 (1.3%) (100.0% of them are naturalized citizens)
This zip code:
1.3%
Whole state:
6.0%
85%France
51%German
18%American
11%English
6%Irish
4%Swedish
2%European
2%Czech
Year of entry for the foreign-born population
302010 or later
02000 to 2009
01990 to 1999
0Before 1990
Facilities with environmental interests located in this zip code:
TODD SULSBERGER (2595 CO ROAD D25 in HORNICK, IA)
National Pollutant Discharge Elimination System NON-MAJOR (Tracking pollutant discharge elimination systems) - permit Business SIC classification: BEEF CATTLE FEEDLOTS Alternative names: DAVIS GULF COAST, INC.
HORNICK CITY OF STP (CITY CLERK in HORNICK, IA)
National Pollutant Discharge Elimination System NON-MAJOR (Tracking pollutant discharge elimination systems) - permit Business SIC classification: SEWERAGE SYSTEMS Organizations: CITY OF HORNICK (CONTACT/OWNER)
HORNICK FARMERS COOP (NO STREET ADDRESS in HORNICK, IA)
AIR MINOR (AIRS/AFS) Business SIC classification: GRAIN AND FIELD BEANS
HOLLY INDUSTRIES INCORPORATED (2991 MOVILLE BLACKTOP in HORNICK, IA)
Conditionally Exempt Small Quantity Generators, less than 100 kg/month of hazardous waste (Resource Conservation and Recovery Act (tracking hazardous waste)) Business NAICS classification: SHEET METAL WORK MANUFACTURING.; CONVEYOR AND CONVEYING EQUIPMENT MANUFACTURING. Organizations: DENNIS TORGENSON (CONTACT/OWNER)
Housing units lacking complete plumbing facilities: 0.7%
58.3%Bottled, tank, or LP gas
12.9%Fuel oil, kerosene, etc.
11.0%Utility gas
11.0%Electricity
5.7%Other fuel
1.9%Wood
Population in 1990: 894. Population change in the 1990s: +70 (+7.8%).
Place of birth for U.S.-born residents:
This state: 844
Northeast: 14
Midwest: 113
South: 27
West: 32
63% of the 51026 zip code residents lived in the same house 5 years ago. Out of people who lived in different houses, 55% lived in this county. Out of people who lived in different counties, 50% lived in Iowa.
84% of the 51026 zip code residents lived in the same house 1 year ago. Out of people who lived in different houses, 11% moved from this county. Out of people who lived in different houses, 92% moved from abroad.
Private vs. public school enrollment:
Students in private schools in grades 1 to 8 (elementary and middle school):
Here:
0.0%
Iowa:
10.6%
Students in private schools in grades 9 to 12 (high school):
Here:
0.0%
Iowa:
7.9%
Students in private undergraduate colleges:
Here:
0.0%
Iowa:
23.9%
Occupation by median earnings in the past 12 months ($)
79,040Education, training, and library occupations
68,922Office and administrative support occupations
65,872Sales and related occupations
65,092Material moving occupations
50,125Management occupations
42,167Construction and extraction occupations
Companies with federal contracts located in this zip code:
MIDWEST DIVING SERVICE (194 DEER RUN TRAIL in HORNICK, IA) : $34,275 in 5 contractsfrom 2004 to 2005
Contracts for Maintenance, Repair or Alteration of Real Property -- Dams by U.S. Army Corps of Engineers - civil program financing only, Army Signed by year:2000: $0; 2001: $0; 2002: $0; 2003: $0; 2004: $20,475; 2005: $13,800; 2006: $0.
Biggest contracts:
$6,990 with U.S. Army Corps of Engineers - civil program financing only for Maintenance, Repair or Alteration of Real Property -- Dams. Taking place in NE. Signed on 2004-08-02. Completion date: 2004-09-30.
$6,990 with Army for Maintenance, Repair or Alteration of Real Property -- Dams. Taking place in NE. Signed on 2004-08-02. Completion date: 2004-09-30.
$6,900 with U.S. Army Corps of Engineers - civil program financing only for Maintenance, Repair or Alteration of Real Property -- Dams. Taking place in ND. Signed on 2005-07-14. Completion date: 2005-07-31.
$6,900 with Army for Maintenance, Repair or Alteration of Real Property -- Dams. Taking place in ND. Signed on 2005-07-14. Completion date: 2005-07-31.
Top industries in this zip code by the number of employees in 2005:
Wholesale Trade: Grain and Field Bean Merchant Wholesalers (20-49 employees: 1 establishment, 10-19 employees: 1 establishment)
Other Services (except Public Administration): Religious Organizations (1-4: 2)
Administrative and Support and Waste Management and Remediation Services: Exterminating and Pest Control Services (1-4: 2)
Construction: Poured Concrete Foundation and Structure Contractors (1-4: 1)
Accommodation and Food Services: Snack and Nonalcoholic Beverage Bars (1-4: 1)
Construction: Drywall and Insulation Contractors (1-4: 1)
Construction: Framing Contractors (1-4: 1)
People in group quarters in 2010:
5 people in group homes intended for adults
Fatal accident statistics in 2011:
Fatal accident count: 1
Vehicles involved in fatal accidents: 1
Fatal accidents caused by drunken drivers: 0
Fatalities: 1
Persons involved in fatal accidents: 2
Pedestrians involved in fatal accidents: 0
Home Mortgage Disclosure Act Aggregated Statistics For Year 2009 (Based on 2 partial tracts)
A) FHA, FSA/RHS & VA Home Purchase Loans
B) Conventional Home Purchase Loans
C) Refinancings
D) Home Improvement Loans
F) Non-occupant Loans on < 5 Family Dwellings (A B C & D)
G) Loans On Manufactured Home Dwelling (A B C & D)
Number
Average Value
Number
Average Value
Number
Average Value
Number
Average Value
Number
Average Value
Number
Average Value
LOANS ORIGINATED
4
$114,052
9
$123,768
48
$107,833
9
$36,409
5
$29,190
0
$0
APPLICATIONS APPROVED, NOT ACCEPTED
0
$0
0
$0
2
$120,290
0
$0
0
$0
0
$0
APPLICATIONS DENIED
1
$136,530
4
$40,490
14
$134,178
3
$79,093
1
$61,200
1
$6,590
APPLICATIONS WITHDRAWN
1
$128,530
2
$88,745
10
$129,705
0
$0
0
$0
0
$0
FILES CLOSED FOR INCOMPLETENESS
0
$0
0
$0
1
$99,340
0
$0
0
$0
0
$0
Aggregated Statistics For Year 2008 (Based on 2 partial tracts)
A) FHA, FSA/RHS & VA Home Purchase Loans
B) Conventional Home Purchase Loans
C) Refinancings
D) Home Improvement Loans
F) Non-occupant Loans on < 5 Family Dwellings (A B C & D)
G) Loans On Manufactured Home Dwelling (A B C & D)
Number
Average Value
Number
Average Value
Number
Average Value
Number
Average Value
Number
Average Value
Number
Average Value
LOANS ORIGINATED
3
$164,153
18
$102,608
26
$82,318
7
$35,916
5
$38,324
2
$40,490
APPLICATIONS APPROVED, NOT ACCEPTED
0
$0
1
$113,460
3
$92,433
0
$0
0
$0
1
$80,040
APPLICATIONS DENIED
1
$116,760
1
$129,000
21
$149,580
5
$27,400
0
$0
2
$88,745
APPLICATIONS WITHDRAWN
0
$0
3
$60,263
8
$133,060
1
$102,160
1
$83,330
1
$101,220
FILES CLOSED FOR INCOMPLETENESS
0
$0
0
$0
2
$171,840
0
$0
0
$0
0
$0
Aggregated Statistics For Year 2007 (Based on 2 partial tracts)
B) Conventional Home Purchase Loans
C) Refinancings
D) Home Improvement Loans
F) Non-occupant Loans on < 5 Family Dwellings (A B C & D)
G) Loans On Manufactured Home Dwelling (A B C & D)
Number
Average Value
Number
Average Value
Number
Average Value
Number
Average Value
Number
Average Value
LOANS ORIGINATED
18
$107,107
25
$93,369
9
$33,166
1
$70,620
0
$0
APPLICATIONS APPROVED, NOT ACCEPTED
0
$0
4
$86,392
1
$15,540
0
$0
0
$0
APPLICATIONS DENIED
5
$58,002
10
$152,916
8
$48,786
1
$17,890
2
$43,315
APPLICATIONS WITHDRAWN
2
$67,795
10
$95,572
1
$101,220
0
$0
0
$0
FILES CLOSED FOR INCOMPLETENESS
1
$33,900
4
$142,065
0
$0
0
$0
0
$0
Aggregated Statistics For Year 2006 (Based on 2 partial tracts)
A) FHA, FSA/RHS & VA Home Purchase Loans
B) Conventional Home Purchase Loans
C) Refinancings
D) Home Improvement Loans
F) Non-occupant Loans on < 5 Family Dwellings (A B C & D)
G) Loans On Manufactured Home Dwelling (A B C & D)
Number
Average Value
Number
Average Value
Number
Average Value
Number
Average Value
Number
Average Value
Number
Average Value
LOANS ORIGINATED
1
$138,890
18
$98,894
31
$88,055
7
$30,333
3
$69,207
2
$85,685
APPLICATIONS APPROVED, NOT ACCEPTED
0
$0
2
$178,670
11
$100,324
0
$0
0
$0
0
$0
APPLICATIONS DENIED
0
$0
7
$87,636
21
$125,749
5
$45,480
1
$69,210
2
$66,145
APPLICATIONS WITHDRAWN
0
$0
2
$79,565
10
$107,531
3
$31,073
0
$0
1
$88,980
FILES CLOSED FOR INCOMPLETENESS
0
$0
2
$86,865
2
$123,585
0
$0
0
$0
0
$0
Aggregated Statistics For Year 2005 (Based on 2 partial tracts)
A) FHA, FSA/RHS & VA Home Purchase Loans
B) Conventional Home Purchase Loans
C) Refinancings
D) Home Improvement Loans
F) Non-occupant Loans on < 5 Family Dwellings (A B C & D)
G) Loans On Manufactured Home Dwelling (A B C & D)
Number
Average Value
Number
Average Value
Number
Average Value
Number
Average Value
Number
Average Value
Number
Average Value
LOANS ORIGINATED
2
$64,500
20
$89,970
47
$75,999
9
$33,636
8
$32,602
2
$21,185
APPLICATIONS APPROVED, NOT ACCEPTED
0
$0
1
$64,970
11
$78,410
1
$47,080
0
$0
0
$0
APPLICATIONS DENIED
0
$0
5
$53,200
27
$87,150
5
$45,008
0
$0
1
$102,630
APPLICATIONS WITHDRAWN
0
$0
2
$78,155
13
$91,878
1
$106,400
0
$0
0
$0
FILES CLOSED FOR INCOMPLETENESS
0
$0
1
$70,150
5
$119,300
1
$67,320
0
$0
0
$0
Aggregated Statistics For Year 2004 (Based on 2 partial tracts)
A) FHA, FSA/RHS & VA Home Purchase Loans
B) Conventional Home Purchase Loans
C) Refinancings
D) Home Improvement Loans
F) Non-occupant Loans on < 5 Family Dwellings (A B C & D)
G) Loans On Manufactured Home Dwelling (A B C & D)
Number
Average Value
Number
Average Value
Number
Average Value
Number
Average Value
Number
Average Value
Number
Average Value
LOANS ORIGINATED
3
$82,860
14
$85,148
42
$77,626
11
$23,284
3
$62,460
1
$45,200
APPLICATIONS APPROVED, NOT ACCEPTED
0
$0
2
$31,310
10
$82,484
0
$0
0
$0
0
$0
APPLICATIONS DENIED
1
$73,920
4
$81,330
22
$90,715
4
$29,542
0
$0
4
$59,675
APPLICATIONS WITHDRAWN
0
$0
1
$102,160
12
$80,782
1
$48,960
0
$0
0
$0
FILES CLOSED FOR INCOMPLETENESS
0
$0
0
$0
6
$107,185
0
$0
0
$0
0
$0
Aggregated Statistics For Year 2003 (Based on 2 partial tracts)
A) FHA, FSA/RHS & VA Home Purchase Loans
B) Conventional Home Purchase Loans
C) Refinancings
D) Home Improvement Loans
F) Non-occupant Loans on < 5 Family Dwellings (A B C & D)
Number
Average Value
Number
Average Value
Number
Average Value
Number
Average Value
Number
Average Value
LOANS ORIGINATED
3
$113,777
22
$72,589
74
$84,299
8
$20,421
8
$40,606
APPLICATIONS APPROVED, NOT ACCEPTED
0
$0
2
$156,070
7
$84,474
1
$11,770
0
$0
APPLICATIONS DENIED
0
$0
5
$56,120
19
$79,689
3
$20,717
1
$23,540
APPLICATIONS WITHDRAWN
0
$0
2
$85,450
18
$86,941
0
$0
0
$0
FILES CLOSED FOR INCOMPLETENESS
0
$0
0
$0
3
$83,330
0
$0
0
$0
Aggregated Statistics For Year 2002 (Based on 2 partial tracts)
A) FHA, FSA/RHS & VA Home Purchase Loans
B) Conventional Home Purchase Loans
C) Refinancings
D) Home Improvement Loans
F) Non-occupant Loans on < 5 Family Dwellings (A B C & D)
Number
Average Value
Number
Average Value
Number
Average Value
Number
Average Value
Number
Average Value
LOANS ORIGINATED
2
$83,565
13
$83,476
61
$72,966
14
$20,984
4
$64,853
APPLICATIONS APPROVED, NOT ACCEPTED
0
$0
1
$137,470
8
$69,208
0
$0
0
$0
APPLICATIONS DENIED
0
$0
2
$125,705
18
$78,153
3
$14,280
0
$0
APPLICATIONS WITHDRAWN
0
$0
2
$56,495
18
$83,750
0
$0
0
$0
FILES CLOSED FOR INCOMPLETENESS
0
$0
0
$0
2
$95,570
0
$0
0
$0
Aggregated Statistics For Year 2001 (Based on 2 partial tracts)
A) FHA, FSA/RHS & VA Home Purchase Loans
B) Conventional Home Purchase Loans
C) Refinancings
D) Home Improvement Loans
F) Non-occupant Loans on < 5 Family Dwellings (A B C & D)
Number
Average Value
Number
Average Value
Number
Average Value
Number
Average Value
Number
Average Value
LOANS ORIGINATED
1
$101,220
18
$76,191
58
$64,337
11
$21,743
3
$34,210
APPLICATIONS APPROVED, NOT ACCEPTED
0
$0
1
$68,270
10
$67,795
1
$8,000
0
$0
APPLICATIONS DENIED
0
$0
4
$53,552
24
$67,128
2
$8,710
0
$0
APPLICATIONS WITHDRAWN
0
$0
1
$53,670
12
$69,051
0
$0
0
$0
FILES CLOSED FOR INCOMPLETENESS
0
$0
0
$0
1
$109,230
1
$48,490
0
$0
Aggregated Statistics For Year 2000 (Based on 2 partial tracts)
A) FHA, FSA/RHS & VA Home Purchase Loans
B) Conventional Home Purchase Loans
C) Refinancings
D) Home Improvement Loans
F) Non-occupant Loans on < 5 Family Dwellings (A B C & D)
Number
Average Value
Number
Average Value
Number
Average Value
Number
Average Value
Number
Average Value
LOANS ORIGINATED
1
$87,100
20
$59,957
34
$53,214
12
$22,206
4
$38,018
APPLICATIONS APPROVED, NOT ACCEPTED
1
$32,490
2
$38,840
7
$46,206
3
$14,753
0
$0
APPLICATIONS DENIED
0
$0
5
$31,356
12
$63,166
4
$16,008
1
$90,390
APPLICATIONS WITHDRAWN
0
$0
0
$0
8
$59,498
2
$69,210
0
$0
FILES CLOSED FOR INCOMPLETENESS
0
$0
0
$0
2
$37,900
0
$0
0
$0
Aggregated Statistics For Year 1999 (Based on 1 partial tract)
A) FHA, FSA/RHS & VA Home Purchase Loans
B) Conventional Home Purchase Loans
C) Refinancings
D) Home Improvement Loans
F) Non-occupant Loans on < 5 Family Dwellings (A B C & D)


+$2,013
-$74
(% of AGI for various income ranges: 8.2% for AGIs $10k-25k, 1.7% for AGIs $25k-50k, 1.3% for AGIs $50k-75k, -4.1% for AGIs $75k-100k) Nearest zip codes: 51056, 51051, 51063, 51044, 51007, 51004.
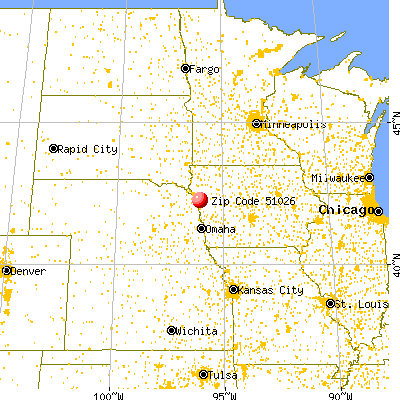


