Estimated zip code population in 2022: 1,006 Zip code population in 2010: 1,184 Zip code population in 2000: 1,094
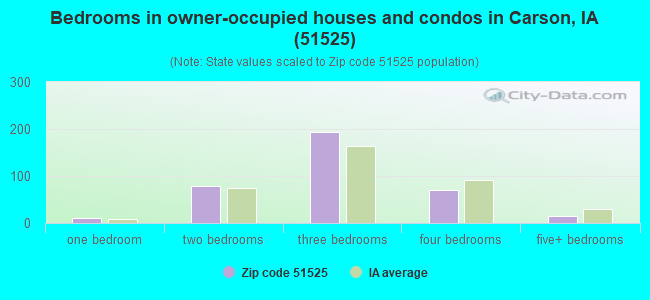
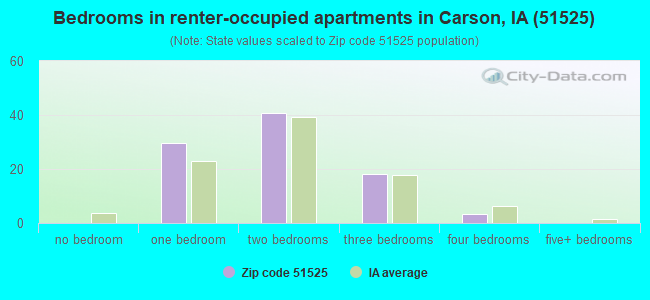
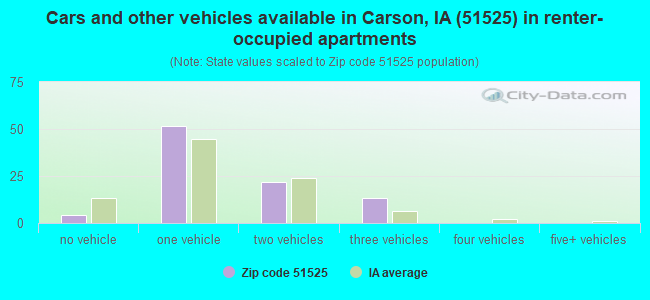
Houses and condos: 454 Renter-occupied apartments: 91
% of renters here:
20%
State:
28%
March 2022 cost of living index in zip code 51525: 82.2 (low, U.S. average is 100)
Land area: 60.5 sq. mi. Water area: 0.6 sq. mi.
Population density: 17 people per square mile
(very low).
OSM Map
General Map
Google Map
MSN Map
OSM Map
General Map
Google Map
MSN Map
OSM Map
General Map
Google Map
MSN Map
OSM Map
General Map
Google Map
MSN Map
Please wait while loading the map...
Real estate property taxes paid for housing units in 2022:
This zip code:
1.2% ($2,252)
Iowa:
1.4% ($2,724)
Median real estate property taxes paid for housing units with mortgages in 2022: $2,556 (1.2%) Median real estate property taxes paid for housing units with no mortgage in 2022: $2,063 (1.3%)
Business Search- 14 Million verified businesses
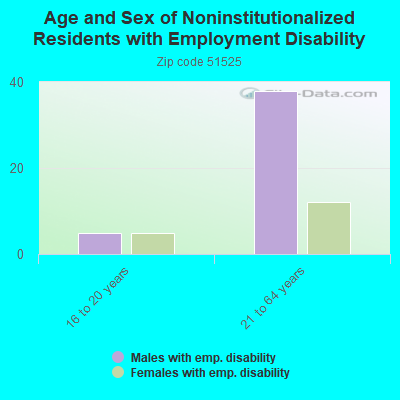
Males: 522
(51.9%)
Females: 483
(48.1%)
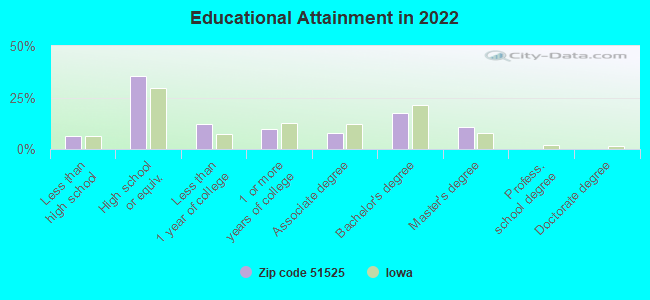
For population 25 years and over in 51525:
High school or higher: 92.1%
Bachelor's degree or higher: 27.8%
Graduate or professional degree: 10.6%
Unemployed: 2.7%
Mean travel time to work (commute): 30.5 minutes
For population 15 years and over in 51525:
Never married: 22.9%
Now married: 52.1%
Separated: 1.1%
Widowed: 7.8%
Divorced: 16.1%
Zip code 51525 compared to state average:
Black race population percentage significantly below state average.
Hispanic race population percentage significantly below state average.
Median age significantly above state average.
Foreign-born population percentage significantly below state average.
Length of stay since moving in significantly above state average.
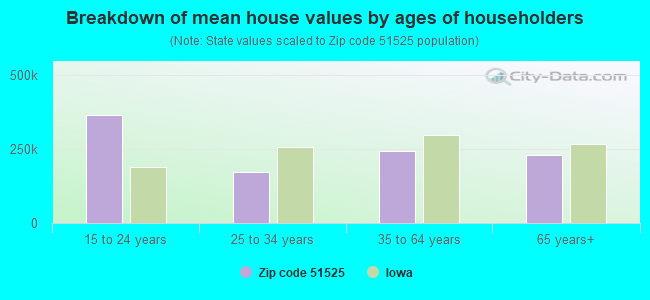
Estimated median house/condo value in 2022: $184,098
51525:
$184,098
Iowa:
$194,600
According to our research of Iowa and other state lists, there were 2 registered sex offenders living in 51525 zip code as of May 30, 2024. The ratio of all residents to sex offenders in zip code 51525 is 613 to 1. The ratio of registered sex offenders to all residents in this zip code is lower than the state average.
Median resident age:
This zip code:
47.0 years
Iowa median age:
38.9 years
Average household size:
This zip code:
2.2 people
Iowa:
2.3 people
Averages for the 2020 tax year for zip code 51525, filed in 2021:
Average Adjusted Gross Income (AGI) in 2020: $66,919 (Individual Income Tax Returns)
Here:
$66,919
State:
$71,087
Salary/wage: $57,449 (reported on 78.9% of returns)
Here:
$57,449
State:
$57,361
(% of AGI for various income ranges: 1373.3% for AGIs below $25k, 3761.1% for AGIs $25k-50k, 6660.0% for AGIs $50k-75k, 10877.5% for AGIs $75k-100k, 19968.0% for AGIs $100k-200k)
Taxable interest for individuals: $695 (reported on 36.8% of returns)
This zip code:
$695
Iowa:
$1,633
(% of AGI for various income ranges: 10.0% for AGIs below $25k, 26.7% for AGIs $25k-50k, 43.3% for AGIs $50k-75k, 40.0% for AGIs $75k-100k, 142.0% for AGIs $100k-200k)
Ordinary dividends: $1,462 (reported on 22.8% of returns)
Here:
$1,462
State:
$5,432
(% of AGI for various income ranges: 8.9% for AGIs below $25k, 18.9% for AGIs $25k-50k, 128.3% for AGIs $50k-75k, 176.0% for AGIs $100k-200k)
Net capital gain/loss in AGI: +$8,230 (reported on 17.5% of returns)
Here:
+$8,230
State:
+$15,243
(% of AGI for various income ranges: 26.7% for AGIs below $25k, 568.3% for AGIs $50k-75k, 916.0% for AGIs $100k-200k)
Profit/loss from business: +$11,225 (reported on 14.0% of returns)
Here:
+$11,225
State:
+$11,763
(% of AGI for various income ranges: 252.2% for AGIs below $25k, 256.7% for AGIs $50k-75k, 1034.0% for AGIs $100k-200k)
Taxable individual retirement arrangement distribution: $11,457 (reported on 12.3% of returns)
51525:
$11,457
Iowa:
$17,324
(% of AGI for various income ranges: 384.4% for AGIs $25k-50k, 1140.0% for AGIs $75k-100k)
Total itemized deductions: $23,050 (reported on 3.5% of returns)
Here:
$23,050
State:
$33,775
(% of AGI for various income ranges: 512.2% for AGIs below $25k)
Taxes paid: $6,150 (reported on 3.5% of returns)
51525:
$6,150
State:
$7,704
(% of AGI for various income ranges: 136.7% for AGIs $25k-50k)
Earned income credit: $2,360 (reported on 8.8% of returns)
Here:
$2,360
State:
$2,195
(% of AGI for various income ranges: 74.4% for AGIs below $25k, 56.7% for AGIs $25k-50k)
Percentage of individuals using paid preparers for their 2020 taxes: 94.7%
Here:
95%
State:
95%
(% for various income ranges: 93.3% for AGIs below $25k, 92.3% for AGIs $25k-50k, 90.0% for AGIs $50k-75k, 100.0% for AGIs $75k-100k, 120.0% for AGIs $100k-200k, 0.0% for AGIs over 200k)
Averages for the 2012 tax year for zip code 51525, filed in 2013:
Average Adjusted Gross Income (AGI) in 2012: $59,768 (Individual Income Tax Returns)
Here:
$59,768
State:
$58,860
Salary/wage: $43,394 (reported on 85.7% of returns)
Here:
$43,394
State:
$46,659
(% of AGI for various income ranges: 69.6% for AGIs below $25k, 79.6% for AGIs $25k-50k, 77.7% for AGIs $50k-75k, 76.5% for AGIs $75k-100k, 40.8% for AGIs $100k-200k)
Taxable interest for individuals: $789 (reported on 33.9% of returns)
This zip code:
$789
Iowa:
$1,537
(% of AGI for various income ranges: 1.6% for AGIs below $25k, 0.5% for AGIs $25k-50k, 0.4% for AGIs $50k-75k, 0.3% for AGIs $75k-100k, 0.4% for AGIs $100k-200k)
Ordinary dividends: $8,660 (reported on 17.9% of returns)
Here:
$8,660
State:
$4,542
(% of AGI for various income ranges: 0.5% for AGIs below $25k, 0.5% for AGIs $50k-75k, 6.0% for AGIs $100k-200k)
Net capital gain/loss in AGI: +$8,086 (reported on 12.5% of returns)
Here:
+$8,086
State:
+$11,802
Profit/loss from business: +$8,070 (reported on 17.9% of returns)
Here:
+$8,070
State:
+$10,509
(% of AGI for various income ranges: 1.6% for AGIs below $25k, 6.6% for AGIs $25k-50k, 6.2% for AGIs $75k-100k)
Taxable individual retirement arrangement distribution: $7,150 (reported on 7.1% of returns)
51525:
$7,150
Iowa:
$11,773
Total itemized deductions: $17,144 (18% of AGI, reported on 32.1% of returns)
Here:
$17,144
State:
$21,278
Here:
18.1% of AGI
State:
18.9% of AGI
(% of AGI for various income ranges: 13.9% for AGIs below $25k, 9.5% for AGIs $25k-50k, 9.4% for AGIs $50k-75k, 9.7% for AGIs $75k-100k, 8.1% for AGIs $100k-200k)
Charity contributions: $1,646 (reported on 23.2% of returns)
Here:
$1,646
State:
$4,044
(% of AGI for various income ranges: 0.6% for AGIs $25k-50k, 0.7% for AGIs $50k-75k, 0.8% for AGIs $75k-100k, 0.6% for AGIs $100k-200k)
Taxes paid: $7,022 (reported on 32.1% of returns)
51525:
$7,022
State:
$8,846
(% of AGI for various income ranges: 2.3% for AGIs below $25k, 2.3% for AGIs $25k-50k, 3.1% for AGIs $50k-75k, 3.5% for AGIs $75k-100k, 5.0% for AGIs $100k-200k)
Earned income credit: $2,086 (reported on 12.5% of returns)
Here:
$2,086
State:
$2,098
(% of AGI for various income ranges: 4.0% for AGIs below $25k, 1.2% for AGIs $25k-50k)
Percentage of individuals using paid preparers for their 2012 taxes: 69.6%
Here:
70%
State:
65%
(% for various income ranges: 62.5% for AGIs below $25k, 66.7% for AGIs $25k-50k, 77.8% for AGIs $50k-75k, 62.5% for AGIs $75k-100k, 87.5% for AGIs $100k-200k)
Averages for the 2004 tax year for zip code 51525, filed in 2005:
Average Adjusted Gross Income (AGI) in 2004: $38,157 (Individual Income Tax Returns)
Here:
$38,157
State:
$43,875
Salary/wage: $36,087 (reported on 80.7% of returns)
Here:
$36,087
State:
$38,265
(% of AGI for various income ranges: 76.1% for AGIs below $10k, 59.0% for AGIs $10k-25k, 77.2% for AGIs $25k-50k, 86.3% for AGIs $50k-75k, 83.2% for AGIs $75k-100k, 59.5% for AGIs over 100k)
Taxable interest for individuals: $1,479 (reported on 53.3% of returns)
This zip code:
$1,479
Iowa:
$1,768
(% of AGI for various income ranges: 7.3% for AGIs below $10k, 6.6% for AGIs $10k-25k, 2.4% for AGIs $25k-50k, 1.1% for AGIs $50k-75k, 0.7% for AGIs $75k-100k, 1.1% for AGIs over 100k)
Taxable dividends: $545 (reported on 22.8% of returns)
Here:
$545
State:
$2,510
(% of AGI for various income ranges: 2.4% for AGIs below $10k, 0.8% for AGIs $10k-25k, 0.2% for AGIs $25k-50k, 0.3% for AGIs $50k-75k, 0.2% for AGIs $75k-100k)
Net capital gain/loss: +$670 (reported on 16.3% of returns)
Here:
+$670
State:
+$6,139
(% of AGI for various income ranges: -0.2% for AGIs below $10k, 1.5% for AGIs $10k-25k, 0.8% for AGIs $25k-50k, -0.2% for AGIs $50k-75k)
Profit/loss from business: +$3,598 (reported on 15.2% of returns)
Here:
+$3,598
State:
+$8,574
(% of AGI for various income ranges: 16.8% for AGIs below $10k, 5.8% for AGIs $10k-25k, 1.1% for AGIs $25k-50k, 0.6% for AGIs $50k-75k)
Profit/loss from farming: +$1,356 (reported on 8.3% of returns)
Here:
+$1,356
State:
-$74
IRA payment deduction: $3,167 (reported on 2.2% of returns)
51525:
$3,167
Iowa:
$2,970
Total itemized deductions: $15,571 (25% of AGI, reported on 29.8% of returns)
Here:
$15,571
State:
$16,976
Here:
24.6% of AGI
State:
20.8% of AGI
(% of AGI for various income ranges: 15.6% for AGIs $10k-25k, 11.3% for AGIs $25k-50k, 10.5% for AGIs $50k-75k, 14.0% for AGIs $75k-100k, 14.3% for AGIs over 100k)
Charity contributions deductions: $1,695 (3% of AGI, reported on 23.7% of returns)
Here:
$1,695
State:
$3,089
Here:
2.8% of AGI
State:
3.6% of AGI
(% of AGI for various income ranges: 1.9% for AGIs $10k-25k, 0.6% for AGIs $25k-50k, 1.1% for AGIs $50k-75k, 1.4% for AGIs $75k-100k, 0.9% for AGIs over 100k)
Total tax: $3,995 (reported on 77.0% of returns)
51525:
$3,995
State:
$6,177
(% of AGI for various income ranges: 5.4% for AGIs below $10k, 4.5% for AGIs $10k-25k, 6.3% for AGIs $25k-50k, 7.8% for AGIs $50k-75k, 10.6% for AGIs $75k-100k, 11.6% for AGIs over 100k)
Earned income credit: $1,375 (reported on 8.9% of returns)
Here:
$1,375
State:
$1,540
Percentage of individuals using paid preparers for their 2004 taxes: 83.3%
Here:
83%
State:
70%
(% for various income ranges: 72.1% for AGIs below $10k, 88.7% for AGIs $10k-25k, 87.1% for AGIs $25k-50k, 85.7% for AGIs $50k-75k, 84.6% for AGIs $75k-100k, 71.4% for AGIs over 100k)
Household received Food Stamps/SNAP in the past 12 months: 16 Household did not receive Food Stamps/SNAP in the past 12 months: 444
Women who had a birth in the past 12 months: 12 (8 now married, 3 unmarried) Women who did not have a birth in the past 12 months: 163 (96 now married, 66 unmarried)
Housing units in zip code 51525 with a mortgage: 200 (22 second mortgage, 3 both second mortgage and home equity loan) Median monthly owner costs for units with a mortgage: $1,549 Median monthly owner costs for units without a mortgage: $517
Residents with income below the poverty level in 2022:
This zip code:
5.6%
Whole state:
11.0%
Residents with income below 50% of the poverty level in 2022:
This zip code:
4.2%
Whole state:
5.5%
Median number of rooms in houses and condos:
Here:
6.9
State:
6.8
Median number of rooms in apartments:
Here:
4.2
State:
4.2
Notable locations in this zip code not listed on our city pages
Churches in zip code 51525 include: Wheeler Grove Church (A), United Methodist Church (B), Reorganized Church of Jesus Christ of Latter Day Saints (C), Carson Presbyterian Church (D). Display/hide their locations on the map
Size of family households: 141 2-persons, 51 3-persons, 31 4-persons, 34 5-persons, 5 6-persons
Size of nonfamily households: 139 1-person, 56 2-persons
164 married couples with children.
40 single-parent households (22 men, 18 women).
99.7% of residents of 51525 zip code speak English at home.
0.3% of residents speak Spanish at home (100% very well).
0.2% of residents speak other Indo-European language at home (100% very well).
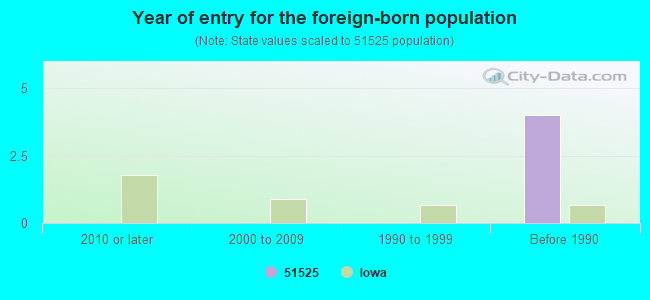
Foreign born population: 5 (0.5%) (60.8% of them are naturalized citizens)
This zip code:
0.5%
Whole state:
6.0%
51%German
16%English
8%American
6%Irish
3%Scottish
3%Danish
1%Northern European
Year of entry for the foreign-born population
02010 or later
02000 to 2009
01990 to 1999
4Before 1990
Facilities with environmental interests located in this zip code:
RIVERSIDE COMMUNITY MIDDLE SCHOOL (330 PLEASANT ST in CARSON, IA)
(National Center for Education Statistics) - STATE ID-785510 172 Organizations: RIVERSIDE COMM SCHOOL DISTRICT (SCHOOL DISTRICT)
PERFORMANCE WASH (106 HWY 92 ST in CARSON, IA)
(Resource Conservation and Recovery Act (tracking hazardous waste)) Business NAICS classification: AUTOMOTIVE BODY, PAINT, AND INTERIOR REPAIR AND MAINTENANCE. Organizations: RANDY MILLER (CONTACT/OPERATOR)
Alternative names: SKANKS REPAIR
BLUE SPRUCE FEEDLOTS (36488 BEECHNUT ROAD in CARSON, IA)
National Pollutant Discharge Elimination System NON-MAJOR (Tracking pollutant discharge elimination systems) - permit Business SIC classification: BEEF CATTLE FEEDLOTS Organizations: BLUE SPRUCE FEEDLOTS INC. (CONTACT/OWNER)
CARSON CITY OF STP (127 BROADWAY PO BOX 128 in CARSON, IA)
National Pollutant Discharge Elimination System NON-MAJOR (Tracking pollutant discharge elimination systems) - permit Business SIC classification: SEWERAGE SYSTEMS
CARSON FEEDERS, INC. (16983 370TH STREET in CARSON, IA)
National Pollutant Discharge Elimination System NON-MAJOR (Tracking pollutant discharge elimination systems) - permit Alternative names: A.U.I.
COHRON READY MIX (321 SOUTH OAK STREET in CARSON, IA)
AIR MINOR (AIRS/AFS) Business SIC classification: CONCRETE PRODUCTS, EXCEPT BLOCK AND BRICK; READY-MIXED CONCRETE Alternative names: A M COHRON & SON INCORPORATED, LYMAN RICHEY
PILLING GAS (14802 400TH STREET in CARSON, IA)
COMPLIANCE ACTIVITY (Tracking inspections of insecticide, fungicide, and rodenticide, and toxic substances)
RIVERSIDE CSD (330 PLEASANT ST in CARSON, IA)
COMPLIANCE ACTIVITY (Tracking inspections of insecticide, fungicide, and rodenticide, and toxic substances)
POTTAWATTAMIE COUNTY ENGRS OFF (311 COMMERCIAL in CARSON, IA)
Conditionally Exempt Small Quantity Generators, less than 100 kg/month of hazardous waste (Resource Conservation and Recovery Act (tracking hazardous waste)) Business NAICS classification: AIR TRAFFIC CONTROL.
Housing units lacking complete kitchen facilities: 0.6%
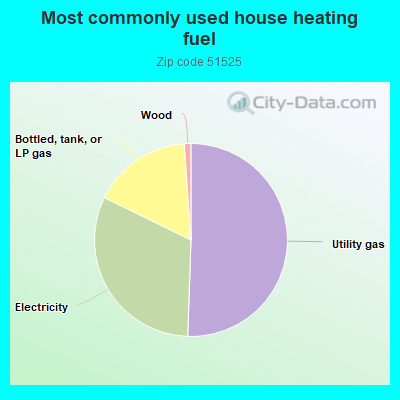
50.7%Utility gas
31.8%Electricity
16.7%Bottled, tank, or LP gas
1.1%Wood
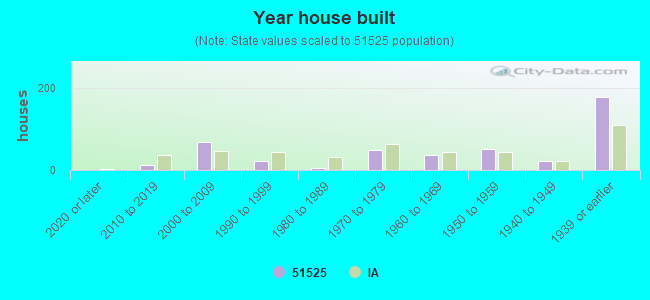
Population in 1990: 1,398.
Place of birth for U.S.-born residents:
This state: 596
Northeast: 8
Midwest: 296
South: 27
West: 66
70% of the 51525 zip code residents lived in the same house 5 years ago. Out of people who lived in different houses, 64% lived in this county. Out of people who lived in different counties, 50% lived in Iowa.
94% of the 51525 zip code residents lived in the same house 1 year ago. Out of people who lived in different houses, 65% moved from this county. Out of people who lived in different houses, 26% moved from different county within same state. Out of people who lived in different houses, 7% moved from different state.
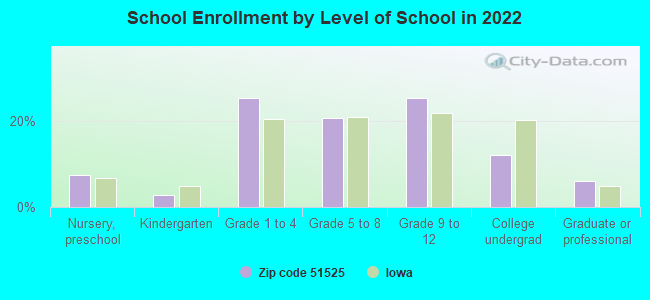
Private vs. public school enrollment:
Students in private schools in grades 1 to 8 (elementary and middle school):
Here:
0.0%
Iowa:
10.6%
Students in private schools in grades 9 to 12 (high school):
Here:
1.8%
Iowa:
7.9%
Students in private undergraduate colleges: 5
Here:
22.2%
Iowa:
23.9%
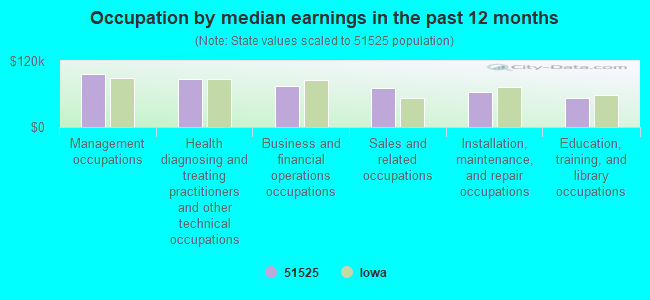
Occupation by median earnings in the past 12 months ($)
96,747Management occupations
86,873Health diagnosing and treating practitioners and other technical occupations
73,953Business and financial operations occupations
70,750Sales and related occupations
63,169Installation, maintenance, and repair occupations
53,056Education, training, and library occupations
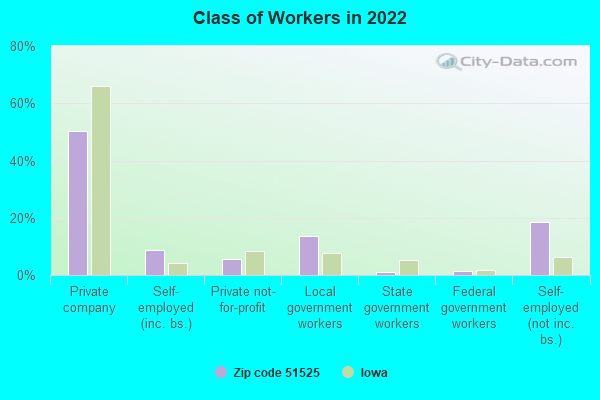
Top industries in this zip code by the number of employees in 2005:
Health Care and Social Assistance: Offices of Chiropractors (5-9 employees: 1 establishment)
Other Services (except Public Administration): Beauty Salons (1-4: 1)
Real Estate and Rental and Leasing: Residential Property Managers (1-4: 1)
Arts, Entertainment, and Recreation: Other Spectator Sports (1-4: 1)
Construction: New Single-Family Housing Construction (except Operative Builders) (1-4: 1)
Accommodation and Food Services: Full-Service Restaurants (1-4: 1)
Administrative and Support and Waste Management and Remediation Services: Landscaping Services (1-4: 1)
Other Services (except Public Administration): Automotive Body, Paint, and Interior Repair and Maintenance (1-4: 1)
Construction: Plumbing, Heating, and Air-Conditioning Contractors (1-4: 1)
Fatal accident statistics in 2014:
Fatal accident count: 1
Vehicles involved in fatal accidents: 2
Fatal accidents caused by drunken drivers: 0
Fatalities: 1
Persons involved in fatal accidents: 4
Pedestrians involved in fatal accidents: 0
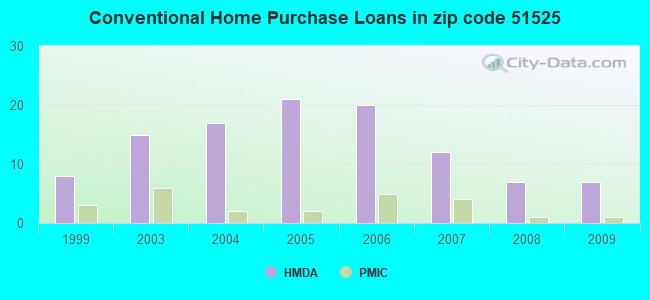
Home Mortgage Disclosure Act Aggregated Statistics For Year 2009 (Based on 2 partial tracts)
A) FHA, FSA/RHS & VA Home Purchase Loans
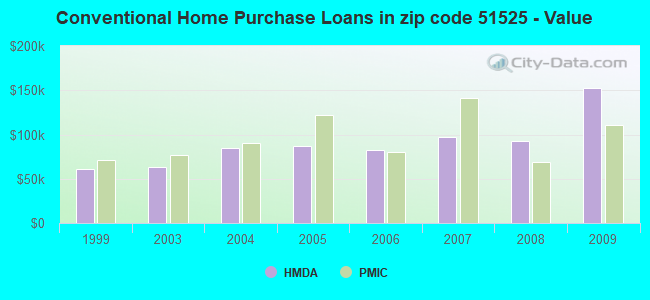
B) Conventional Home Purchase Loans
C) Refinancings
D) Home Improvement Loans
F) Non-occupant Loans on < 5 Family Dwellings (A B C & D)
G) Loans On Manufactured Home Dwelling (A B C & D)
Number
Average Value
Number
Average Value
Number
Average Value
Number
Average Value
Number
Average Value
Number
Average Value
LOANS ORIGINATED
4
$133,212
7
$152,159
27
$103,824
7
$91,583
1
$72,740
1
$34,300
APPLICATIONS APPROVED, NOT ACCEPTED
0
$0
1
$10,650
4
$97,432
1
$28,390
0
$0
1
$82,800
APPLICATIONS DENIED
2
$76,290
1
$68,600
9
$112,300
1
$4,730
0
$0
1
$40,220
APPLICATIONS WITHDRAWN
0
$0
1
$37,260
4
$105,860
0
$0
0
$0
0
$0
FILES CLOSED FOR INCOMPLETENESS
0
$0
0
$0
2
$67,715
1
$5,910
0
$0
0
$0
Aggregated Statistics For Year 2008 (Based on 2 partial tracts)
A) FHA, FSA/RHS & VA Home Purchase Loans
B) Conventional Home Purchase Loans
C) Refinancings
D) Home Improvement Loans
F) Non-occupant Loans on < 5 Family Dwellings (A B C & D)
G) Loans On Manufactured Home Dwelling (A B C & D)
Number
Average Value
Number
Average Value
Number
Average Value
Number
Average Value
Number
Average Value
Number
Average Value
LOANS ORIGINATED
3
$126,363
7
$92,174
12
$106,649
5
$33,828
2
$14,195
1
$33,120
APPLICATIONS APPROVED, NOT ACCEPTED
1
$115,910
0
$0
1
$43,170
0
$0
0
$0
0
$0
APPLICATIONS DENIED
0
$0
3
$88,710
10
$120,291
2
$72,740
1
$14,790
0
$0
APPLICATIONS WITHDRAWN
0
$0
0
$0
8
$100,464
0
$0
1
$13,010
1
$28,390
FILES CLOSED FOR INCOMPLETENESS
0
$0
0
$0
2
$103,495
0
$0
0
$0
0
$0
Aggregated Statistics For Year 2007 (Based on 2 partial tracts)
A) FHA, FSA/RHS & VA Home Purchase Loans
B) Conventional Home Purchase Loans
C) Refinancings
D) Home Improvement Loans
F) Non-occupant Loans on < 5 Family Dwellings (A B C & D)
G) Loans On Manufactured Home Dwelling (A B C & D)
Number
Average Value
Number
Average Value
Number
Average Value
Number
Average Value
Number
Average Value
Number
Average Value
LOANS ORIGINATED
1
$79,250
12
$97,581
14
$102,186
3
$17,347
2
$37,850
1
$113,550
APPLICATIONS APPROVED, NOT ACCEPTED
0
$0
1
$77,470
7
$101,214
1
$4,140
0
$0
0
$0
APPLICATIONS DENIED
0
$0
5
$103,850
14
$96,314
3
$112,760
0
$0
1
$48,490
APPLICATIONS WITHDRAWN
0
$0
2
$62,095
4
$121,238
0
$0
0
$0
0
$0
FILES CLOSED FOR INCOMPLETENESS
0
$0
2
$70,670
1
$133,070
0
$0
0
$0
0
$0
Aggregated Statistics For Year 2006 (Based on 2 partial tracts)
A) FHA, FSA/RHS & VA Home Purchase Loans
B) Conventional Home Purchase Loans
C) Refinancings
D) Home Improvement Loans
F) Non-occupant Loans on < 5 Family Dwellings (A B C & D)
G) Loans On Manufactured Home Dwelling (A B C & D)
Number
Average Value
Number
Average Value
Number
Average Value
Number
Average Value
Number
Average Value
Number
Average Value
LOANS ORIGINATED
1
$124,190
20
$82,500
18
$82,533
8
$19,590
3
$61,310
1
$14,790
APPLICATIONS APPROVED, NOT ACCEPTED
0
$0
1
$141,340
4
$119,462
0
$0
1
$82,800
0
$0
APPLICATIONS DENIED
1
$24,840
4
$56,182
18
$97,318
6
$32,922
0
$0
1
$49,680
APPLICATIONS WITHDRAWN
0
$0
1
$76,290
5
$77,710
0
$0
0
$0
0
$0
FILES CLOSED FOR INCOMPLETENESS
0
$0
0
$0
1
$116,510
1
$14,790
0
$0
1
$14,790
Aggregated Statistics For Year 2005 (Based on 2 partial tracts)
A) FHA, FSA/RHS & VA Home Purchase Loans
B) Conventional Home Purchase Loans
C) Refinancings
D) Home Improvement Loans
F) Non-occupant Loans on < 5 Family Dwellings (A B C & D)
G) Loans On Manufactured Home Dwelling (A B C & D)
Number
Average Value
Number
Average Value
Number
Average Value
Number
Average Value
Number
Average Value
Number
Average Value
LOANS ORIGINATED
2
$117,690
21
$86,795
23
$106,195
7
$21,121
5
$48,376
0
$0
APPLICATIONS APPROVED, NOT ACCEPTED
0
$0
2
$26,910
5
$65,764
1
$8,280
0
$0
1
$10,650
APPLICATIONS DENIED
1
$51,450
9
$85,753
17
$94,381
5
$54,646
0
$0
0
$0
APPLICATIONS WITHDRAWN
0
$0
4
$89,302
7
$113,549
1
$47,310
1
$14,790
0
$0
FILES CLOSED FOR INCOMPLETENESS
0
$0
1
$88,120
7
$106,283
0
$0
0
$0
0
$0
Aggregated Statistics For Year 2004 (Based on 2 partial tracts)
A) FHA, FSA/RHS & VA Home Purchase Loans
B) Conventional Home Purchase Loans
C) Refinancings
D) Home Improvement Loans
F) Non-occupant Loans on < 5 Family Dwellings (A B C & D)
G) Loans On Manufactured Home Dwelling (A B C & D)
Number
Average Value
Number
Average Value
Number
Average Value
Number
Average Value
Number
Average Value
Number
Average Value
LOANS ORIGINATED
2
$135,135
17
$85,196
24
$124,317
6
$25,627
3
$220,000
1
$95,220
APPLICATIONS APPROVED, NOT ACCEPTED
0
$0
1
$56,180
5
$102,194
3
$41,397
1
$8,280
0
$0
APPLICATIONS DENIED
1
$94,620
5
$69,904
25
$89,798
6
$18,038
1
$50,860
0
$0
APPLICATIONS WITHDRAWN
0
$0
4
$96,695
7
$86,767
1
$60,320
0
$0
0
$0
FILES CLOSED FOR INCOMPLETENESS
0
$0
1
$146,670
1
$154,360
0
$0
0
$0
0
$0
Aggregated Statistics For Year 2003 (Based on 2 partial tracts)
A) FHA, FSA/RHS & VA Home Purchase Loans
B) Conventional Home Purchase Loans
C) Refinancings
D) Home Improvement Loans
F) Non-occupant Loans on < 5 Family Dwellings (A B C & D)
Number
Average Value
Number
Average Value
Number
Average Value
Number
Average Value
Number
Average Value
LOANS ORIGINATED
2
$89,595
15
$63,043
43
$90,649
4
$19,515
1
$49,680
APPLICATIONS APPROVED, NOT ACCEPTED
0
$0
2
$58,255
5
$117,926
0
$0
0
$0
APPLICATIONS DENIED
0
$0
6
$49,087
9
$90,090
4
$42,432
0
$0
APPLICATIONS WITHDRAWN
0
$0
2
$49,680
13
$95,170
0
$0
1
$18,920
FILES CLOSED FOR INCOMPLETENESS
0
$0
0
$0
1
$121,240
0
$0
0
$0
Aggregated Statistics For Year 1999 (Based on 1 partial tract)
A) FHA, FSA/RHS & VA Home Purchase Loans
B) Conventional Home Purchase Loans
C) Refinancings
D) Home Improvement Loans
F) Non-occupant Loans on < 5 Family Dwellings (A B C & D)


+$1,356
-$74
 Nearest zip codes: 51549, 51560, 51541, 51536, 51575, 51533.