Estimated zip code population in 2022: 395 Zip code population in 2010: 465 Zip code population in 2000: 543
Houses and condos: 215 Renter-occupied apartments: 37
% of renters here:
20%
State:
28%
March 2022 cost of living index in zip code 51549: 82.9 (low, U.S. average is 100)
Land area: 32.7 sq. mi. Water area: 0.0 sq. mi.
Population density: 12 people per square mile
(very low).
OSM Map
General Map
Google Map
MSN Map
OSM Map
General Map
Google Map
MSN Map
OSM Map
General Map
Google Map
MSN Map
OSM Map
General Map
Google Map
MSN Map
Please wait while loading the map...
Real estate property taxes paid for housing units in 2022:
This zip code:
1.2% ($2,169)
Iowa:
1.4% ($2,724)
Median real estate property taxes paid for housing units with mortgages in 2022: $2,292 (1.1%) Median real estate property taxes paid for housing units with no mortgage in 2022: $2,107 (1.4%)
Business Search- 14 Million verified businesses
Males: 206
(52.1%)
Females: 189
(47.9%)
For population 25 years and over in 51549:
High school or higher: 95.1%
Bachelor's degree or higher: 27.4%
Graduate or professional degree: 4.3%
Unemployed: 0.7%
Mean travel time to work (commute): 25.8 minutes
For population 15 years and over in 51549:
Never married: 16.4%
Now married: 67.7%
Separated: 0.3%
Widowed: 10.3%
Divorced: 5.3%
Zip code 51549 compared to state average:
Unemployed percentage significantly below state average.
Black race population percentage significantly below state average.
Hispanic race population percentage significantly below state average.
Foreign-born population percentage significantly below state average.
Length of stay since moving in below state average.
Estimated median house/condo value in 2022: $179,919
51549:
$179,919
Iowa:
$194,600
Median resident age:
This zip code:
36.9 years
Iowa median age:
38.9 years
Average household size:
This zip code:
2.1 people
Iowa:
2.3 people
Averages for the 2020 tax year for zip code 51549, filed in 2021:
Average Adjusted Gross Income (AGI) in 2020: $67,376 (Individual Income Tax Returns)
Here:
$67,376
State:
$71,087
Salary/wage: $56,728 (reported on 85.7% of returns)
Here:
$56,728
State:
$57,361
(% of AGI for various income ranges: 980.0% for AGIs below $25k, 3642.5% for AGIs $25k-50k, 3772.5% for AGIs $50k-75k, 24450.0% for AGIs $100k-200k)
Taxable interest for individuals: $433 (reported on 28.6% of returns)
This zip code:
$433
Iowa:
$1,633
(% of AGI for various income ranges: 22.5% for AGIs below $25k, 12.5% for AGIs $50k-75k, 60.0% for AGIs $100k-200k)
Ordinary dividends: $1,950 (reported on 19.0% of returns)
Here:
$1,950
State:
$5,432
(% of AGI for various income ranges: 195.0% for AGIs $50k-75k)
Net capital gain/loss in AGI: +$2,300 (reported on 14.3% of returns)
Here:
+$2,300
State:
+$15,243
(% of AGI for various income ranges: 172.5% for AGIs $50k-75k)
Profit/loss from business: +$1,367 (reported on 14.3% of returns)
Here:
+$1,367
State:
+$11,763
(% of AGI for various income ranges: 102.5% for AGIs $25k-50k)
Earned income credit: $2,200 (reported on 9.5% of returns)
Here:
$2,200
State:
$2,195
(% of AGI for various income ranges: 110.0% for AGIs below $25k)
Percentage of individuals using paid preparers for their 2020 taxes: 95.2%
Here:
95%
State:
95%
(% for various income ranges: 100.0% for AGIs below $25k, 100.0% for AGIs $25k-50k, 100.0% for AGIs $50k-75k, 100.0% for AGIs $75k-100k, 80.0% for AGIs $100k-200k)
Averages for the 2012 tax year for zip code 51549, filed in 2013:
Average Adjusted Gross Income (AGI) in 2012: $64,210 (Individual Income Tax Returns)
Here:
$64,210
State:
$58,860
Salary/wage: $49,372 (reported on 85.7% of returns)
Here:
$49,372
State:
$46,659
(% of AGI for various income ranges: 59.6% for AGIs below $25k, 75.7% for AGIs $25k-50k, 80.2% for AGIs $50k-75k, 78.1% for AGIs $75k-100k, 56.2% for AGIs $100k-200k)
Taxable interest for individuals: $457 (reported on 33.3% of returns)
This zip code:
$457
Iowa:
$1,537
Ordinary dividends: $1,500 (reported on 14.3% of returns)
Here:
$1,500
State:
$4,542
Profit/loss from business: +$17,225 (reported on 19.0% of returns)
Here:
+$17,225
State:
+$10,509
Total itemized deductions: $22,420 (16% of AGI, reported on 23.8% of returns)
Here:
$22,420
State:
$21,278
Here:
16.0% of AGI
State:
18.9% of AGI
Charity contributions: $1,875 (reported on 19.0% of returns)
Here:
$1,875
State:
$4,044
Taxes paid: $9,320 (reported on 23.8% of returns)
51549:
$9,320
State:
$8,846
Earned income credit: $1,833 (reported on 14.3% of returns)
Here:
$1,833
State:
$2,098
(% of AGI for various income ranges: 6.5% for AGIs below $25k)
Percentage of individuals using paid preparers for their 2012 taxes: 76.2%
Here:
76%
State:
65%
(% for various income ranges: 71.4% for AGIs below $25k, 66.7% for AGIs $25k-50k, 133.3% for AGIs $50k-75k, 100.0% for AGIs $100k-200k)
Averages for the 2004 tax year for zip code 51549, filed in 2005:
Average Adjusted Gross Income (AGI) in 2004: $37,059 (Individual Income Tax Returns)
Here:
$37,059
State:
$43,875
Salary/wage: $34,653 (reported on 83.1% of returns)
Here:
$34,653
State:
$38,265
(% of AGI for various income ranges: 93.9% for AGIs below $10k, 60.2% for AGIs $10k-25k, 75.6% for AGIs $25k-50k, 76.7% for AGIs $50k-75k, 86.7% for AGIs $75k-100k)
Taxable interest for individuals: $1,253 (reported on 40.3% of returns)
This zip code:
$1,253
Iowa:
$1,768
(% of AGI for various income ranges: 6.6% for AGIs below $10k, 6.6% for AGIs $10k-25k, 0.9% for AGIs $25k-50k, 0.6% for AGIs $50k-75k, 0.2% for AGIs $75k-100k)
Taxable dividends: $533 (reported on 19.1% of returns)
Here:
$533
State:
$2,510
Profit/loss from business: +$4,933 (reported on 12.7% of returns)
Here:
+$4,933
State:
+$8,574
Profit/loss from farming: +$727 (reported on 4.7% of returns)
Here:
+$727
State:
-$74
Total itemized deductions: $14,250 (25% of AGI, reported on 27.1% of returns)
Here:
$14,250
State:
$16,976
Here:
24.9% of AGI
State:
20.8% of AGI
(% of AGI for various income ranges: 16.7% for AGIs $10k-25k, 7.2% for AGIs $25k-50k, 8.8% for AGIs $50k-75k, 13.8% for AGIs $75k-100k)
Charity contributions deductions: $1,036 (2% of AGI, reported on 23.3% of returns)
Here:
$1,036
State:
$3,089
Here:
1.8% of AGI
State:
3.6% of AGI
(% of AGI for various income ranges: 0.7% for AGIs $10k-25k, 0.8% for AGIs $25k-50k, 0.6% for AGIs $50k-75k, 0.6% for AGIs $75k-100k)
Total tax: $3,865 (reported on 78.4% of returns)
51549:
$3,865
State:
$6,177
(% of AGI for various income ranges: 2.0% for AGIs below $10k, 3.7% for AGIs $10k-25k, 7.6% for AGIs $25k-50k, 8.7% for AGIs $50k-75k, 10.5% for AGIs $75k-100k)
Earned income credit: $1,348 (reported on 9.7% of returns)
Here:
$1,348
State:
$1,540
Percentage of individuals using paid preparers for their 2004 taxes: 74.6%
Here:
75%
State:
70%
(% for various income ranges: 63.4% for AGIs below $10k, 77.2% for AGIs $10k-25k, 80.0% for AGIs $25k-50k, 75.0% for AGIs $50k-75k, 72.0% for AGIs $75k-100k)
Household received Food Stamps/SNAP in the past 12 months: 3 Household did not receive Food Stamps/SNAP in the past 12 months: 182
Women who had a birth in the past 12 months: 6 (2 now married, 3 unmarried) Women who did not have a birth in the past 12 months: 62 (48 now married, 14 unmarried)
Housing units in zip code 51549 with a mortgage: 75 (4 second mortgage, 1 both second mortgage and home equity loan) Median monthly owner costs for units with a mortgage: $1,515 Median monthly owner costs for units without a mortgage: $564
Residents with income below the poverty level in 2022:
This zip code:
3.4%
Whole state:
11.0%
Residents with income below 50% of the poverty level in 2022:
This zip code:
2.6%
Whole state:
5.5%
Median number of rooms in houses and condos:
Here:
6.2
State:
6.8
Median number of rooms in apartments:
Here:
5.7
State:
4.2
Notable locations in this zip code not listed on our city pages
Size of family households: 72 2-persons, 9 3-persons, 16 4-persons, 16 5-persons, 1 6-persons
Size of nonfamily households: 69 1-person
79 married couples with children.
8 single-parent households (1 men, 7 women).
99.7% of residents of 51549 zip code speak English at home.
Foreign born population: 0 (0.0%)
:
0.0%
Whole state:
6.0%
47%German
13%Irish
9%Polish
7%European
5%American
4%Croatian
2%Swedish
Facilities with environmental interests located in this zip code:
DONIA AUTO REPAIR (401 MAIN STREET in MACEDONIA, IA)
(Integrated Compliance Information System) - ICIS-07-1997-0302, FORMAL ENFORCEMENT ACTION Alternative names: DONIAS AUTOMOTIVE
SCHILDBERG CONSTRUCTION (11910 385TH ST in MACEDONIA, IA)
National Pollutant Discharge Elimination System NON-MAJOR (Tracking pollutant discharge elimination systems) - permit Business SIC classification: CRUSHED AND BROKEN LIMESTONE Organizations: SCHILDBERG CONSTRUCTION CO., I (CONTACT/OWNER)
Alternative names: MACEDONIA QUARRY, SCHILDBERG CONST (MACEDONIA QY
DONIA AUTO REPAIR (304 MAIN STREET in MACEDONIA, IA)
AIR MINOR (AIRS/AFS) Business SIC classification: AUTOMOTIVE REPAIR SHOPS Alternative names: DONIA'S AUTOMOTIVE
S & B FEEDYARD (35714 ASPEN ROAD in MACEDONIA, IA)
National Pollutant Discharge Elimination System NON-MAJOR (Tracking pollutant discharge elimination systems) - permit Alternative names: XETHANOL BIOFUELS, LLC
Housing units lacking complete plumbing facilities: 3.1% Housing units lacking complete kitchen facilities: 3.5%
54.1%Utility gas
29.3%Bottled, tank, or LP gas
15.2%Electricity
2.3%Wood
Population in 1990: 475. Population change in the 1990s: +68 (+14.3%).
Place of birth for U.S.-born residents:
This state: 203
Northeast: 8
Midwest: 132
South: 18
West: 30
61% of the 51549 zip code residents lived in the same house 5 years ago. Out of people who lived in different houses, 49% lived in this county. Out of people who lived in different counties, 50% lived in Iowa.
86% of the 51549 zip code residents lived in the same house 1 year ago. Out of people who lived in different houses, 62% moved from this county. Out of people who lived in different houses, 8% moved from different county within same state. Out of people who lived in different houses, 26% moved from different state.
Private vs. public school enrollment:
Students in private schools in grades 1 to 8 (elementary and middle school):
Here:
0.0%
Iowa:
10.6%
Students in private schools in grades 9 to 12 (high school):
Here:
0.0%
Iowa:
7.9%
Students in private undergraduate colleges:
Here:
0.0%
Iowa:
23.9%
Occupation by median earnings in the past 12 months ($)
102,442Office and administrative support occupations
65,650Management occupations
64,372Business and financial operations occupations
63,351Sales and related occupations
52,856Installation, maintenance, and repair occupations
50,022Construction and extraction occupations
Top industries in this zip code by the number of employees in 2005:
Wholesale Trade: Farm and Garden Machinery and Equipment Merchant Wholesalers (20-49 employees: 1 establishment)
Mining: Crushed and Broken Limestone Mining and Quarrying (10-19: 1)
Health Care and Social Assistance: Other Individual and Family Services (1-4: 1)
Real Estate and Rental and Leasing: Truck, Utility Trailer, and RV (Recreational Vehicle) Rental and Leasing (1-4: 1)
Other Services (except Public Administration): Religious Organizations (1-4: 1)
Home Mortgage Disclosure Act Aggregated Statistics For Year 2009 (Based on 4 partial tracts)
A) FHA, FSA/RHS & VA Home Purchase Loans
B) Conventional Home Purchase Loans
C) Refinancings
D) Home Improvement Loans
Number
Average Value
Number
Average Value
Number
Average Value
Number
Average Value
LOANS ORIGINATED
3
$147,763
5
$146,558
30
$146,938
4
$103,725
APPLICATIONS APPROVED, NOT ACCEPTED
0
$0
1
$124,890
3
$162,013
1
$14,390
APPLICATIONS DENIED
1
$55,470
1
$109,760
8
$132,069
1
$5,180
APPLICATIONS WITHDRAWN
0
$0
0
$0
4
$132,608
0
$0
FILES CLOSED FOR INCOMPLETENESS
0
$0
0
$0
1
$75,470
0
$0
Aggregated Statistics For Year 2008 (Based on 4 partial tracts)
A) FHA, FSA/RHS & VA Home Purchase Loans
B) Conventional Home Purchase Loans
C) Refinancings
D) Home Improvement Loans
F) Non-occupant Loans on < 5 Family Dwellings (A B C & D)
G) Loans On Manufactured Home Dwelling (A B C & D)
Number
Average Value
Number
Average Value
Number
Average Value
Number
Average Value
Number
Average Value
Number
Average Value
LOANS ORIGINATED
2
$167,860
5
$146,782
12
$133,539
5
$51,350
1
$37,170
1
$44,580
APPLICATIONS APPROVED, NOT ACCEPTED
0
$0
0
$0
2
$177,585
1
$43,730
0
$0
0
$0
APPLICATIONS DENIED
0
$0
2
$104,410
8
$147,109
2
$66,110
0
$0
0
$0
APPLICATIONS WITHDRAWN
0
$0
0
$0
4
$131,982
0
$0
0
$0
0
$0
FILES CLOSED FOR INCOMPLETENESS
0
$0
0
$0
1
$81,150
0
$0
0
$0
0
$0
Aggregated Statistics For Year 2007 (Based on 4 partial tracts)
A) FHA, FSA/RHS & VA Home Purchase Loans
B) Conventional Home Purchase Loans
C) Refinancings
D) Home Improvement Loans
F) Non-occupant Loans on < 5 Family Dwellings (A B C & D)
G) Loans On Manufactured Home Dwelling (A B C & D)
Number
Average Value
Number
Average Value
Number
Average Value
Number
Average Value
Number
Average Value
Number
Average Value
LOANS ORIGINATED
1
$121,360
12
$132,768
16
$139,862
5
$41,738
3
$68,973
1
$133,420
APPLICATIONS APPROVED, NOT ACCEPTED
0
$0
1
$68,840
3
$133,453
1
$108,290
0
$0
0
$0
APPLICATIONS DENIED
0
$0
3
$94,383
12
$130,872
2
$130,445
0
$0
0
$0
APPLICATIONS WITHDRAWN
0
$0
1
$154,990
3
$133,753
1
$100,890
0
$0
0
$0
FILES CLOSED FOR INCOMPLETENESS
0
$0
1
$116,880
1
$136,040
0
$0
0
$0
0
$0
Aggregated Statistics For Year 2006 (Based on 4 partial tracts)
A) FHA, FSA/RHS & VA Home Purchase Loans
B) Conventional Home Purchase Loans
C) Refinancings
D) Home Improvement Loans
F) Non-occupant Loans on < 5 Family Dwellings (A B C & D)
Number
Average Value
Number
Average Value
Number
Average Value
Number
Average Value
Number
Average Value
LOANS ORIGINATED
1
$224,350
16
$125,499
16
$117,976
6
$33,430
3
$87,107
APPLICATIONS APPROVED, NOT ACCEPTED
0
$0
1
$96,130
3
$138,113
1
$80,140
0
$0
APPLICATIONS DENIED
0
$0
2
$95,565
10
$113,191
3
$51,667
0
$0
APPLICATIONS WITHDRAWN
0
$0
1
$65,970
4
$117,335
0
$0
0
$0
FILES CLOSED FOR INCOMPLETENESS
0
$0
0
$0
1
$149,950
0
$0
0
$0
Aggregated Statistics For Year 2005 (Based on 4 partial tracts)
A) FHA, FSA/RHS & VA Home Purchase Loans
B) Conventional Home Purchase Loans
C) Refinancings
D) Home Improvement Loans
F) Non-occupant Loans on < 5 Family Dwellings (A B C & D)
G) Loans On Manufactured Home Dwelling (A B C & D)
Number
Average Value
Number
Average Value
Number
Average Value
Number
Average Value
Number
Average Value
Number
Average Value
LOANS ORIGINATED
1
$169,170
15
$115,799
21
$136,951
4
$23,505
2
$81,700
1
$61,430
APPLICATIONS APPROVED, NOT ACCEPTED
0
$0
2
$81,075
2
$83,465
1
$9,930
0
$0
0
$0
APPLICATIONS DENIED
0
$0
4
$104,162
9
$111,592
2
$58,515
0
$0
0
$0
APPLICATIONS WITHDRAWN
0
$0
2
$76,830
6
$164,843
1
$56,660
0
$0
0
$0
FILES CLOSED FOR INCOMPLETENESS
0
$0
1
$44,650
4
$148,520
0
$0
0
$0
0
$0
Aggregated Statistics For Year 2004 (Based on 4 partial tracts)
A) FHA, FSA/RHS & VA Home Purchase Loans
B) Conventional Home Purchase Loans
C) Refinancings
D) Home Improvement Loans
F) Non-occupant Loans on < 5 Family Dwellings (A B C & D)
G) Loans On Manufactured Home Dwelling (A B C & D)
Number
Average Value
Number
Average Value
Number
Average Value
Number
Average Value
Number
Average Value
Number
Average Value
LOANS ORIGINATED
1
$128,760
14
$124,244
21
$128,478
5
$24,848
2
$154,650
1
$81,400
APPLICATIONS APPROVED, NOT ACCEPTED
0
$0
1
$106,460
4
$132,530
2
$84,510
0
$0
0
$0
APPLICATIONS DENIED
0
$0
4
$107,635
15
$97,693
3
$17,657
0
$0
0
$0
APPLICATIONS WITHDRAWN
0
$0
2
$146,580
4
$133,765
0
$0
0
$0
0
$0
FILES CLOSED FOR INCOMPLETENESS
0
$0
1
$75,080
3
$114,573
0
$0
0
$0
0
$0
Aggregated Statistics For Year 2003 (Based on 4 partial tracts)
A) FHA, FSA/RHS & VA Home Purchase Loans
B) Conventional Home Purchase Loans
C) Refinancings
D) Home Improvement Loans
F) Non-occupant Loans on < 5 Family Dwellings (A B C & D)


+$727
-$74
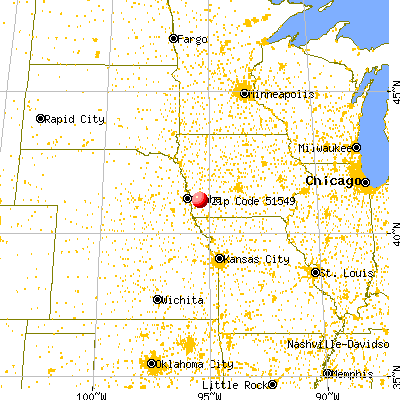
 Nearest zip codes: 51541, 51525, 51560, 51575, 51571, 51540.


