Estimated zip code population in 2022: 3,078 Zip code population in 2010: 2,915 Zip code population in 2000: 2,889
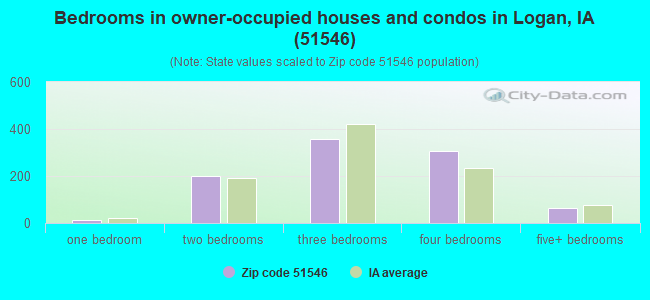
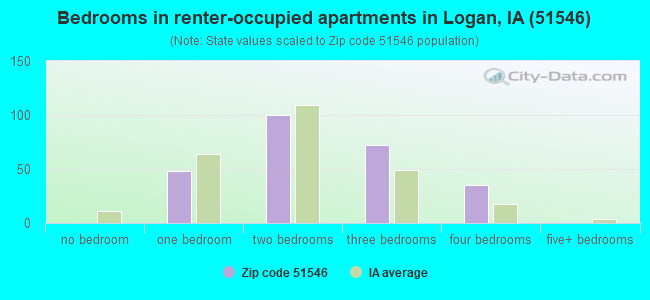
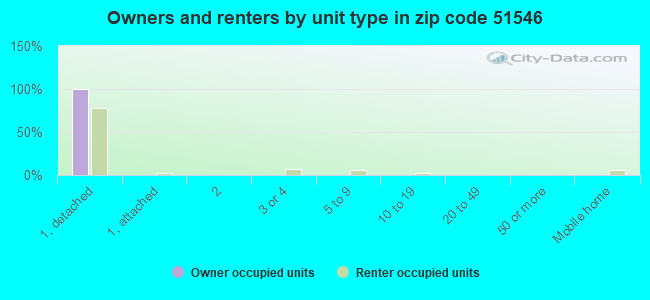
Houses and condos: 1,300 Renter-occupied apartments: 254
% of renters here:
21%
State:
28%
March 2022 cost of living index in zip code 51546: 83.1 (low, U.S. average is 100)
Land area: 113.1 sq. mi. Water area: 0.1 sq. mi.
Population density: 27 people per square mile
(very low).
OSM Map
General Map
Google Map
MSN Map
OSM Map
General Map
Google Map
MSN Map
OSM Map
General Map
Google Map
MSN Map
OSM Map
General Map
Google Map
MSN Map
Please wait while loading the map...
Real estate property taxes paid for housing units in 2022:
This zip code:
1.3% ($2,431)
Iowa:
1.4% ($2,724)
Median real estate property taxes paid for housing units with mortgages in 2022: $2,378 (1.3%) Median real estate property taxes paid for housing units with no mortgage in 2022: $2,532 (1.2%)
Estimated median house/condo value in 2022: $193,957
51546:
$193,957
Iowa:
$194,600
According to our research of Iowa and other state lists, there were 2 registered sex offenders living in 51546 zip code as of May 28, 2024. The ratio of all residents to sex offenders in zip code 51546 is 1,407 to 1. The ratio of registered sex offenders to all residents in this zip code is much lower than the state average.
Median resident age:
This zip code:
39.1 years
Iowa median age:
38.9 years
Average household size:
This zip code:
2.5 people
Iowa:
2.3 people
Averages for the 2020 tax year for zip code 51546, filed in 2021:
Average Adjusted Gross Income (AGI) in 2020: $72,967 (Individual Income Tax Returns)
Here:
$72,967
State:
$71,087
Salary/wage: $61,685 (reported on 83.6% of returns)
Here:
$61,685
State:
$57,361
(% of AGI for various income ranges: 1216.8% for AGIs below $25k, 3856.5% for AGIs $25k-50k, 7450.0% for AGIs $50k-75k, 10004.4% for AGIs $75k-100k, 17309.3% for AGIs $100k-200k)
Taxable interest for individuals: $1,128 (reported on 35.9% of returns)
This zip code:
$1,128
Iowa:
$1,633
(% of AGI for various income ranges: 18.9% for AGIs below $25k, 12.7% for AGIs $25k-50k, 60.7% for AGIs $50k-75k, 122.2% for AGIs $75k-100k, 115.3% for AGIs $100k-200k)
Ordinary dividends: $2,364 (reported on 19.5% of returns)
Here:
$2,364
State:
$5,432
(% of AGI for various income ranges: 16.3% for AGIs below $25k, 18.1% for AGIs $25k-50k, 68.6% for AGIs $50k-75k, 44.4% for AGIs $75k-100k, 156.7% for AGIs $100k-200k)
Net capital gain/loss in AGI: +$10,128 (reported on 19.5% of returns)
Here:
+$10,128
State:
+$15,243
(% of AGI for various income ranges: 38.4% for AGIs below $25k, 27.3% for AGIs $25k-50k, 157.9% for AGIs $50k-75k, 90.0% for AGIs $75k-100k, 688.7% for AGIs $100k-200k)
Profit/loss from business: +$11,430 (reported on 15.6% of returns)
Here:
+$11,430
State:
+$11,763
(% of AGI for various income ranges: 98.9% for AGIs below $25k, 116.2% for AGIs $25k-50k, 310.7% for AGIs $50k-75k, 630.0% for AGIs $75k-100k, 529.3% for AGIs $100k-200k)
Taxable individual retirement arrangement distribution: $12,962 (reported on 10.2% of returns)
51546:
$12,962
Iowa:
$17,324
(% of AGI for various income ranges: 58.9% for AGIs below $25k, 118.8% for AGIs $25k-50k, 304.3% for AGIs $50k-75k, 558.7% for AGIs $100k-200k)
Total itemized deductions: $31,183 (reported on 4.7% of returns)
Here:
$31,183
State:
$33,775
(% of AGI for various income ranges: 272.7% for AGIs $25k-50k, 774.7% for AGIs $100k-200k)
Charity contributions: $6,950 (reported on 3.1% of returns)
Here:
$6,950
State:
$13,075
(% of AGI for various income ranges: 185.3% for AGIs $100k-200k)
Taxes paid: $7,050 (reported on 4.7% of returns)
51546:
$7,050
State:
$7,704
(% of AGI for various income ranges: 38.1% for AGIs $25k-50k, 216.0% for AGIs $100k-200k)
Earned income credit: $2,125 (reported on 9.4% of returns)
Here:
$2,125
State:
$2,195
(% of AGI for various income ranges: 61.6% for AGIs below $25k, 53.1% for AGIs $25k-50k)
Percentage of individuals using paid preparers for their 2020 taxes: 94.5%
Here:
95%
State:
95%
(% for various income ranges: 89.3% for AGIs below $25k, 97.0% for AGIs $25k-50k, 95.5% for AGIs $50k-75k, 92.9% for AGIs $75k-100k, 96.2% for AGIs $100k-200k, 100.0% for AGIs over 200k)
Averages for the 2012 tax year for zip code 51546, filed in 2013:
Average Adjusted Gross Income (AGI) in 2012: $57,766 (Individual Income Tax Returns)
Here:
$57,766
State:
$58,860
Salary/wage: $45,710 (reported on 83.5% of returns)
Here:
$45,710
State:
$46,659
(% of AGI for various income ranges: 71.3% for AGIs below $25k, 80.8% for AGIs $25k-50k, 80.3% for AGIs $50k-75k, 77.2% for AGIs $75k-100k, 77.6% for AGIs $100k-200k)
Taxable interest for individuals: $1,249 (reported on 35.4% of returns)
This zip code:
$1,249
Iowa:
$1,537
(% of AGI for various income ranges: 2.6% for AGIs below $25k, 0.3% for AGIs $25k-50k, 0.8% for AGIs $50k-75k, 0.8% for AGIs $75k-100k, 0.5% for AGIs $100k-200k, 0.7% for AGIs over 200k)
Ordinary dividends: $1,804 (reported on 18.9% of returns)
Here:
$1,804
State:
$4,542
(% of AGI for various income ranges: 0.9% for AGIs below $25k, 0.3% for AGIs $25k-50k, 0.3% for AGIs $50k-75k, 0.4% for AGIs $75k-100k, 0.8% for AGIs $100k-200k, 0.9% for AGIs over 200k)
Net capital gain/loss in AGI: +$5,995 (reported on 16.5% of returns)
Here:
+$5,995
State:
+$11,802
(% of AGI for various income ranges: 0.4% for AGIs below $25k, 0.5% for AGIs $25k-50k, 0.9% for AGIs $50k-75k, 0.3% for AGIs $75k-100k, 0.8% for AGIs $100k-200k, 7.6% for AGIs over 200k)
Profit/loss from business: +$7,990 (reported on 15.7% of returns)
Here:
+$7,990
State:
+$10,509
(% of AGI for various income ranges: 3.7% for AGIs below $25k, 1.8% for AGIs $25k-50k, 2.2% for AGIs $50k-75k, 2.1% for AGIs $75k-100k, 3.2% for AGIs $100k-200k)
Taxable individual retirement arrangement distribution: $11,575 (reported on 9.4% of returns)
51546:
$11,575
Iowa:
$11,773
(% of AGI for various income ranges: 2.1% for AGIs below $25k, 2.5% for AGIs $25k-50k, 4.4% for AGIs $50k-75k, 2.4% for AGIs $100k-200k)
Total itemized deductions: $20,439 (21% of AGI, reported on 32.3% of returns)
Here:
$20,439
State:
$21,278
Here:
20.7% of AGI
State:
18.9% of AGI
(% of AGI for various income ranges: 12.2% for AGIs below $25k, 8.6% for AGIs $25k-50k, 8.5% for AGIs $50k-75k, 12.8% for AGIs $75k-100k, 12.6% for AGIs $100k-200k, 12.8% for AGIs over 200k)
Charity contributions: $3,278 (reported on 25.2% of returns)
Here:
$3,278
State:
$4,044
(% of AGI for various income ranges: 1.0% for AGIs below $25k, 1.0% for AGIs $25k-50k, 1.1% for AGIs $50k-75k, 1.4% for AGIs $75k-100k, 1.6% for AGIs $100k-200k, 2.1% for AGIs over 200k)
Taxes paid: $7,476 (reported on 32.3% of returns)
51546:
$7,476
State:
$8,846
(% of AGI for various income ranges: 2.1% for AGIs below $25k, 2.2% for AGIs $25k-50k, 2.6% for AGIs $50k-75k, 4.9% for AGIs $75k-100k, 5.8% for AGIs $100k-200k, 4.8% for AGIs over 200k)
Earned income credit: $1,976 (reported on 13.4% of returns)
Here:
$1,976
State:
$2,098
(% of AGI for various income ranges: 4.0% for AGIs below $25k, 1.3% for AGIs $25k-50k)
Percentage of individuals using paid preparers for their 2012 taxes: 74.8%
Here:
75%
State:
65%
(% for various income ranges: 68.2% for AGIs below $25k, 73.1% for AGIs $25k-50k, 81.0% for AGIs $50k-75k, 76.5% for AGIs $75k-100k, 81.2% for AGIs $100k-200k, 100.0% for AGIs over 200k)
Averages for the 2004 tax year for zip code 51546, filed in 2005:
Average Adjusted Gross Income (AGI) in 2004: $39,056 (Individual Income Tax Returns)
Here:
$39,056
State:
$43,875
Salary/wage: $36,057 (reported on 85.1% of returns)
Here:
$36,057
State:
$38,265
(% of AGI for various income ranges: 124.6% for AGIs below $10k, 76.6% for AGIs $10k-25k, 80.6% for AGIs $25k-50k, 83.5% for AGIs $50k-75k, 80.4% for AGIs $75k-100k, 60.3% for AGIs over 100k)
Taxable interest for individuals: $1,401 (reported on 45.5% of returns)
This zip code:
$1,401
Iowa:
$1,768
(% of AGI for various income ranges: 9.6% for AGIs below $10k, 3.5% for AGIs $10k-25k, 1.2% for AGIs $25k-50k, 1.3% for AGIs $50k-75k, 1.8% for AGIs $75k-100k, 0.5% for AGIs over 100k)
Taxable dividends: $1,127 (reported on 22.8% of returns)
Here:
$1,127
State:
$2,510
(% of AGI for various income ranges: 1.7% for AGIs below $10k, 0.6% for AGIs $10k-25k, 0.2% for AGIs $25k-50k, 0.9% for AGIs $50k-75k, 0.5% for AGIs $75k-100k, 0.9% for AGIs over 100k)
Net capital gain/loss: +$4,454 (reported on 18.4% of returns)
Here:
+$4,454
State:
+$6,139
(% of AGI for various income ranges: -1.7% for AGIs below $10k, 0.2% for AGIs $10k-25k, 0.8% for AGIs $25k-50k, 2.3% for AGIs $50k-75k, 2.1% for AGIs $75k-100k, 5.5% for AGIs over 100k)
Profit/loss from business: +$6,232 (reported on 19.0% of returns)
Here:
+$6,232
State:
+$8,574
(% of AGI for various income ranges: 9.1% for AGIs below $10k, 3.3% for AGIs $10k-25k, 4.3% for AGIs $25k-50k, 2.0% for AGIs $50k-75k, 3.1% for AGIs $75k-100k, 2.2% for AGIs over 100k)
IRA payment deduction: $2,714 (reported on 2.2% of returns)
51546:
$2,714
Iowa:
$2,970
Total itemized deductions: $15,211 (24% of AGI, reported on 32.6% of returns)
Here:
$15,211
State:
$16,976
Here:
24.3% of AGI
State:
20.8% of AGI
(% of AGI for various income ranges: 25.8% for AGIs below $10k, 9.4% for AGIs $10k-25k, 11.3% for AGIs $25k-50k, 13.4% for AGIs $50k-75k, 14.4% for AGIs $75k-100k, 12.7% for AGIs over 100k)
Charity contributions deductions: $1,756 (3% of AGI, reported on 25.3% of returns)
Here:
$1,756
State:
$3,089
Here:
2.7% of AGI
State:
3.6% of AGI
(% of AGI for various income ranges: 1.8% for AGIs below $10k, 0.7% for AGIs $10k-25k, 0.7% for AGIs $25k-50k, 1.2% for AGIs $50k-75k, 1.1% for AGIs $75k-100k, 2.0% for AGIs over 100k)
Total tax: $4,470 (reported on 76.8% of returns)
51546:
$4,470
State:
$6,177
(% of AGI for various income ranges: 3.9% for AGIs below $10k, 4.3% for AGIs $10k-25k, 6.6% for AGIs $25k-50k, 7.5% for AGIs $50k-75k, 10.4% for AGIs $75k-100k, 16.6% for AGIs over 100k)
Earned income credit: $1,713 (reported on 12.0% of returns)
Here:
$1,713
State:
$1,540
Percentage of individuals using paid preparers for their 2004 taxes: 80.7%
Here:
81%
State:
70%
(% for various income ranges: 73.3% for AGIs below $10k, 80.6% for AGIs $10k-25k, 84.4% for AGIs $25k-50k, 82.4% for AGIs $50k-75k, 79.0% for AGIs $75k-100k, 86.0% for AGIs over 100k)
Likely homosexual households (counted as self-reported same-sex unmarried-partner households)
Lesbian couples: 0.2% of all households
Gay men: 0.0% of all households
Household received Food Stamps/SNAP in the past 12 months: 52 Household did not receive Food Stamps/SNAP in the past 12 months: 1,144
Women who had a birth in the past 12 months: 46 (45 now married, 2 unmarried) Women who did not have a birth in the past 12 months: 548 (375 now married, 172 unmarried)
Housing units in zip code 51546 with a mortgage: 625 (55 second mortgage, 2 home equity loan, 55 both second mortgage and home equity loan) Houses without a mortgage: 23
Median monthly owner costs for units with a mortgage: $1,183 Median monthly owner costs for units without a mortgage: $567
Residents with income below the poverty level in 2022:
This zip code:
5.6%
Whole state:
11.0%
Residents with income below 50% of the poverty level in 2022:
This zip code:
1.5%
Whole state:
5.5%
Median number of rooms in houses and condos:
Here:
7.0
State:
6.8
Median number of rooms in apartments:
Here:
5.1
State:
4.2
Notable locations in this zip code not listed on our city pages
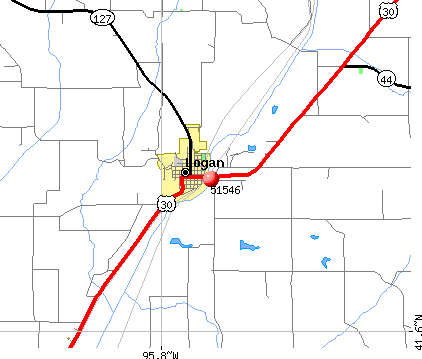
Notable locations in zip code 51546: Biglers Grove (A), Whitesboro (B), Logan (C), Logan Volunteer Fire and Rescue Association (D), Harrison County Sheriff Office (E), Harrison County Courthouse (F), Logan City Police Department (G), Logan City Hall (H), Logan Community Center (I), Logan Public Library (J), Museum of Religious Arts (K). Display/hide their locations on the map
Churches in zip code 51546 include: The Church of Jesus Christ of Latter Day Saints (A), United Methodist Church (B), Reorganized Church of Jesus Christ of Latter Day Saints (C), Christian Church (D), Immanuel Lutheran Church (E), Saint Annes Parish (F), Landmark Baptist Mission (G), Zion Lutheran Church (H), Harris Grove Church (I). Display/hide their locations on the map
Cemeteries: Bethel Cemetery (1), Silver Hill Cemetery (2), Harris Grove Cemetery (3), Logan Cemetery (4), Greenwood Cemetery (5), McGavern Cemetery (6), Hawkins Cemetery (7). Display/hide their locations on the map
In group quarters: 46 (-1 institutionalized population)
Size of family households: 431 2-persons, 197 3-persons, 117 4-persons, 169 5-persons, 19 6-persons, 7 7-or-more-persons
Size of nonfamily households: 224 1-person, 20 2-persons
707 married couples with children.
116 single-parent households (83 men, 33 women).
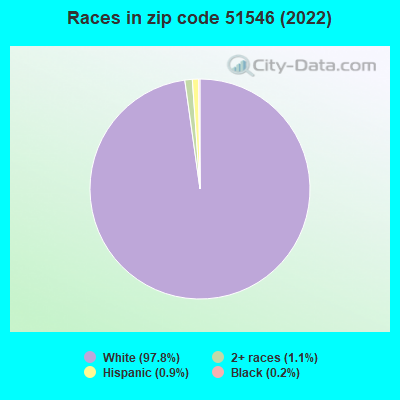
98.8% of residents of 51546 zip code speak English at home.
0.9% of residents speak Spanish at home (69% very well, 31% well).
0.1% of residents speak Asian or Pacific Island language at home (100% very well).
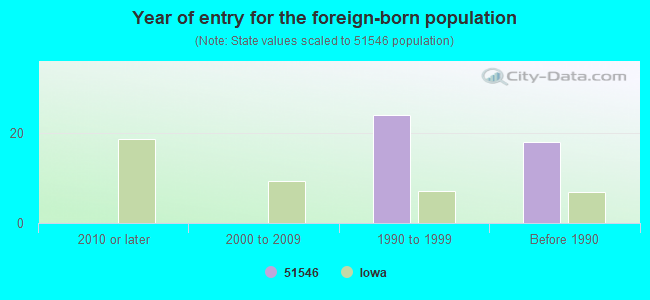
Foreign born population: 17 (0.6%) (50.9% of them are naturalized citizens)
This zip code:
0.6%
Whole state:
6.0%
50%El Salvador
44%Honduras
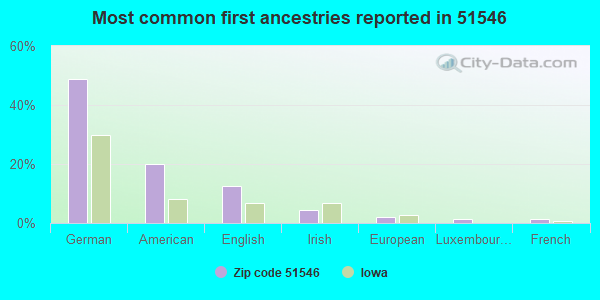
49%German
20%American
13%English
5%Irish
2%European
1%Luxembourger
1%French
Year of entry for the foreign-born population
02010 or later
02000 to 2009
241990 to 1999
18Before 1990
Facilities with environmental interests located in this zip code:
R & C DEAN, INC (203 N. LINN AVE in LOGAN, IA)
(Integrated Compliance Information System) - ICIS-07-2003-0170, FORMAL ENFORCEMENT ACTION COMPLIANCE ACTIVITY (Tracking inspections of insecticide, fungicide, and rodenticide, and toxic substances) Business SIC classification: DISINFECTING AND PEST CONTROL SERVICES
AGRILAND FS INC. LOGAN (404 SOUTH 3RD in LOGAN, IA)
COMPLIANCE ACTIVITY (Tracking inspections of insecticide, fungicide, and rodenticide, and toxic substances) (Resource Conservation and Recovery Act (tracking hazardous waste)) Business NAICS classification: FERTILIZER (MIXING ONLY) MANUFACTURING. Alternative names: AGRILAND F/S INC
BOND EQUIPMENT CORP (1207 INDUSTRIAL DR in LOGAN, IA)
(Resource Conservation and Recovery Act (tracking hazardous waste))
BROWER CONSTRUCTION-FORMER SITE OF (2594 260TH ST in LOGAN, IA)
(Resource Conservation and Recovery Act (tracking hazardous waste)) Business NAICS classification: ASPHALT PAVING MIXTURE AND BLOCK MANUFACTURING.
HIGHWAY SURFACERS (NO STREET ADDRESS in LOGAN, IA)
AIR MINOR (AIRS/AFS) Business SIC classification: ASPHALT PAVING MIXTURES AND BLOCKS Alternative names: CLOSED FACILITY -- HIGHWAY SURFACERS
PERFECTION PRESS INCORPORATED (1200 INDUSTRIAL DRIVE in LOGAN, IA)
AIR SYNTHETIC MINOR (AIRS/AFS) Conditionally Exempt Small Quantity Generators, less than 100 kg/month of hazardous waste (Resource Conservation and Recovery Act (tracking hazardous waste)) Business SIC classification: BOOKBINDING AND RELATED WORK Business NAICS classification: COMMERCIAL LITHOGRAPHIC PRINTING.
R & C DEAN INC (203 NORTH LINN AVE in LOGAN, IA)
COMPLIANCE ACTIVITY (Tracking inspections of insecticide, fungicide, and rodenticide, and toxic substances)
Housing units lacking complete plumbing facilities: 4.3% Housing units lacking complete kitchen facilities: 5.3%
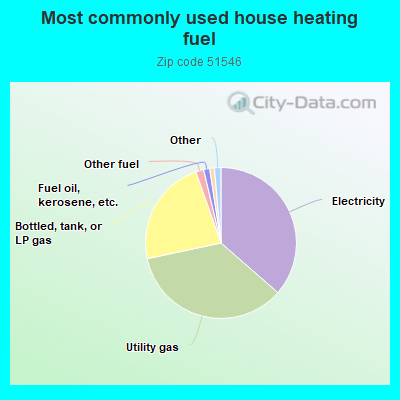
36.5%Electricity
35.3%Utility gas
23.0%Bottled, tank, or LP gas
1.7%Other fuel
1.3%Fuel oil, kerosene, etc.
1.0%Solar energy
0.8%No fuel used
0.7%Wood
Population in 1990: 2,764. Population change in the 1990s: +125 (+4.5%).
Place of birth for U.S.-born residents:
This state: 1,425
Northeast: 25
Midwest: 1,307
South: 111
West: 132
59% of the 51546 zip code residents lived in the same house 5 years ago. Out of people who lived in different houses, 57% lived in this county. Out of people who lived in different counties, 50% lived in Iowa.
96% of the 51546 zip code residents lived in the same house 1 year ago. Out of people who lived in different houses, 54% moved from this county. Out of people who lived in different houses, 11% moved from different county within same state. Out of people who lived in different houses, 40% moved from different state.
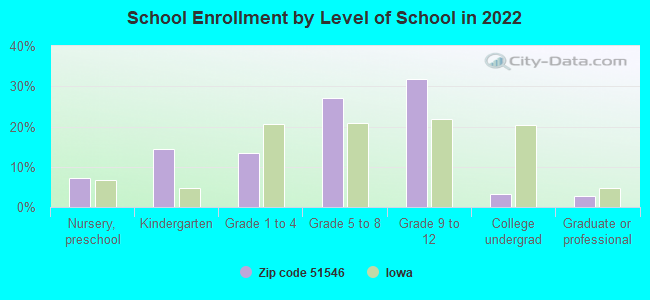
Private vs. public school enrollment:
Students in private schools in grades 1 to 8 (elementary and middle school): 2
Here:
1.0%
Iowa:
10.6%
Students in private schools in grades 9 to 12 (high school): 26
Here:
11.7%
Iowa:
7.9%
Students in private undergraduate colleges: 7
Here:
32.1%
Iowa:
23.9%
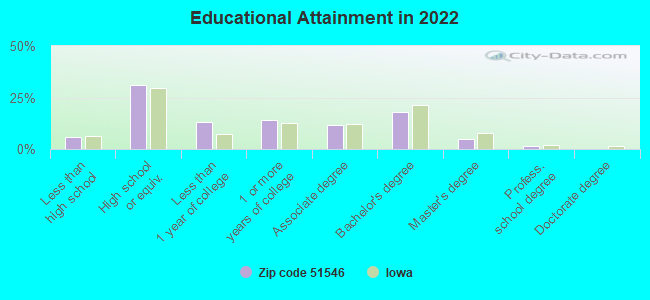
Occupation by median earnings in the past 12 months ($)
107,474Computer and mathematical occupations
68,228Sales and related occupations
59,023Management occupations
55,189Health diagnosing and treating practitioners and other technical occupations
53,643Business and financial operations occupations
52,348Construction and extraction occupations
Top industries in this zip code by the number of employees in 2005:
Health Care and Social Assistance: Residential Mental Retardation Facilities (50-99: 1)
Health Care and Social Assistance: Nursing Care Facilities (50-99: 1)
Finance and Insurance: Commercial Banking (10-19: 1, 5-9: 1)
Finance and Insurance: Insurance Agencies and Brokerages (5-9: 1, 1-4: 5)
Other Services (except Public Administration): Religious Organizations (5-9: 1, 1-4: 2)
Professional, Scientific, and Technical Services: Title Abstract and Settlement Offices (5-9: 1, 1-4: 1)
Accommodation and Food Services: Full-Service Restaurants (5-9: 1, 1-4: 1)
People in group quarters in 2010:
30 people in nursing facilities/skilled-nursing facilities
12 people in group homes intended for adults
7 people in local jails and other municipal confinement facilities
5 people in residential treatment centers for adults
People in group quarters in 2000:
58 people in nursing homes
8 people in homes for the mentally retarded
2 people in local jails and other confinement facilities (including police lockups)
Fatal accident statistics in 2014:
Fatal accident count: 2
Vehicles involved in fatal accidents: 4
Fatal accidents caused by drunken drivers: 1
Fatalities: 2
Persons involved in fatal accidents: 5
Pedestrians involved in fatal accidents: 0
Fatal accident statistics in 2013:
Fatal accident count: 1
Vehicles involved in fatal accidents: 1
Fatal accidents caused by drunken drivers: 0
Fatalities: 1
Persons involved in fatal accidents: 1
Pedestrians involved in fatal accidents: 0
2002 - 2018 National Fire Incident Reporting System (NFIRS) incidents
According to the data from the years 2002 - 2018 the average number of fire incidents per year is 18. The highest number of reported fires - 44 took place in 2014, and the least - 1 in 2006. The data has an increasing trend.
When looking into fire subcategories, the most incidents belonged to: Outside Fires (49.8%), and Structure Fires (33.2%).
Fire incident types reported to NFIRS in Zip Code 51546

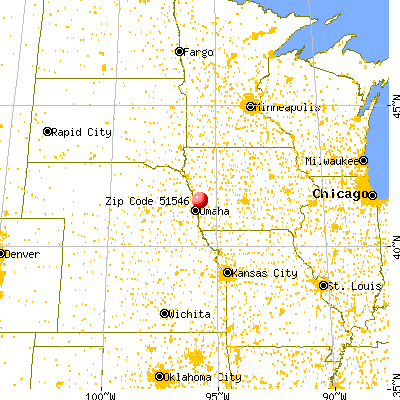


 Nearest zip codes: 51550, 51579, 51555, 51563, 51559, 51542.


 According to the data from the years 2002 - 2018 the average number of fire incidents per year is 18. The highest number of reported fires - 44 took place in 2014, and the least - 1 in 2006. The data has an increasing trend.
 When looking into fire subcategories, the most incidents belonged to: Outside Fires (49.8%), and Structure Fires (33.2%).