Estimated zip code population in 2022: 2,007 Zip code population in 2010: 1,788 Zip code population in 2000: 1,738
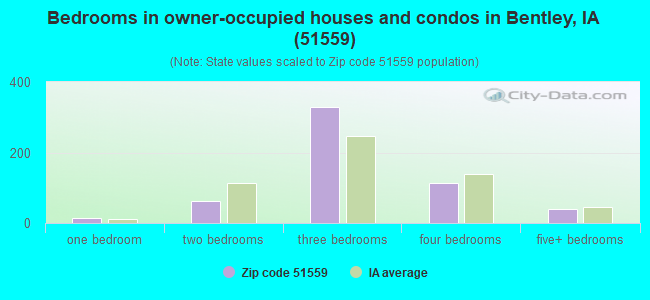
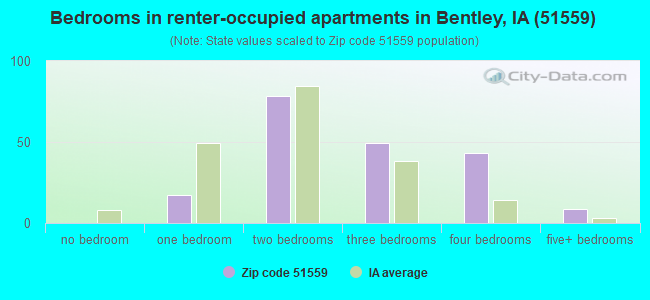
Houses and condos: 788 Renter-occupied apartments: 195
% of renters here:
26%
State:
28%
March 2022 cost of living index in zip code 51559: 83.5 (less than average, U.S. average is 100)
Land area: 85.0 sq. mi. Water area: 0.2 sq. mi.
Population density: 24 people per square mile
(very low).
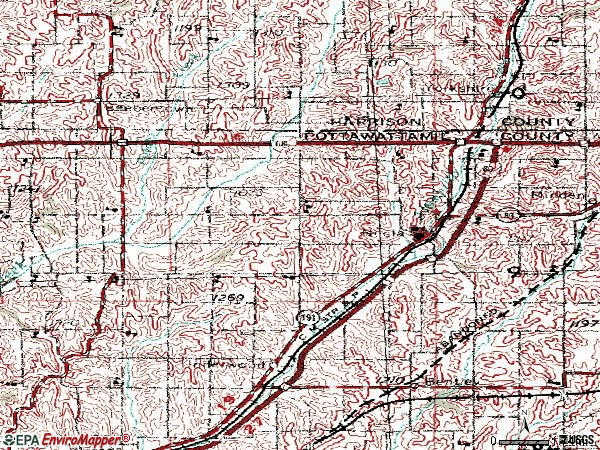
OSM Map
General Map
Google Map
MSN Map
OSM Map
General Map
Google Map
MSN Map
OSM Map
General Map
Google Map
MSN Map
OSM Map
General Map
Google Map
MSN Map
Please wait while loading the map...
Real estate property taxes paid for housing units in 2022:
This zip code:
1.4% ($2,731)
Iowa:
1.4% ($2,724)
Median real estate property taxes paid for housing units with mortgages in 2022: $2,750 (1.4%) Median real estate property taxes paid for housing units with no mortgage in 2022: $2,604 (1.2%)
Business Search- 14 Million verified businesses
Males: 1,014
(50.6%)
Females: 992
(49.4%)
For population 25 years and over in 51559:
High school or higher: 97.9%
Bachelor's degree or higher: 25.0%
Graduate or professional degree: 6.8%
Unemployed: 5.5%
Mean travel time to work (commute): 27.7 minutes
For population 15 years and over in 51559:
Never married: 25.3%
Now married: 57.2%
Separated: 1.4%
Widowed: 4.3%
Divorced: 11.7%
Zip code 51559 compared to state average:
Unemployed percentage above state average.
Black race population percentage significantly below state average.
Hispanic race population percentage significantly below state average.
Foreign-born population percentage significantly below state average.
Length of stay since moving in significantly above state average.
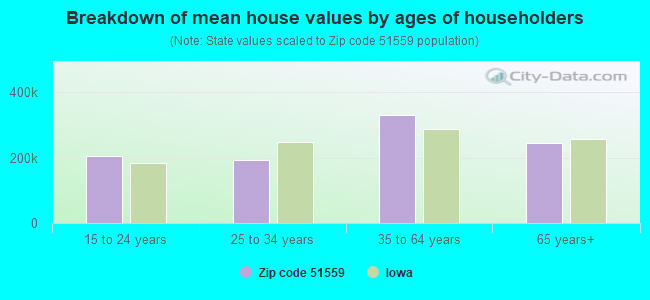
Estimated median house/condo value in 2022: $198,886
51559:
$198,886
Iowa:
$194,600
According to our research of Iowa and other state lists, there were 2 registered sex offenders living in 51559 zip code as of May 28, 2024. The ratio of all residents to sex offenders in zip code 51559 is 833 to 1. The ratio of registered sex offenders to all residents in this zip code is lower than the state average.
Median resident age:
This zip code:
36.1 years
Iowa median age:
38.9 years
Average household size:
This zip code:
2.7 people
Iowa:
2.3 people
Averages for the 2020 tax year for zip code 51559, filed in 2021:
Average Adjusted Gross Income (AGI) in 2020: $74,183 (Individual Income Tax Returns)
Here:
$74,183
State:
$71,087
Salary/wage: $61,123 (reported on 83.9% of returns)
Here:
$61,123
State:
$57,361
(% of AGI for various income ranges: 1222.9% for AGIs below $25k, 3622.0% for AGIs $25k-50k, 6484.5% for AGIs $50k-75k, 9733.3% for AGIs $75k-100k, 16782.7% for AGIs $100k-200k)
Taxable interest for individuals: $1,328 (reported on 36.8% of returns)
This zip code:
$1,328
Iowa:
$1,633
(% of AGI for various income ranges: 6.4% for AGIs below $25k, 16.7% for AGIs $25k-50k, 67.3% for AGIs $50k-75k, 56.7% for AGIs $75k-100k, 131.8% for AGIs $100k-200k)
Ordinary dividends: $4,112 (reported on 19.5% of returns)
Here:
$4,112
State:
$5,432
(% of AGI for various income ranges: 22.9% for AGIs below $25k, 51.3% for AGIs $25k-50k, 45.0% for AGIs $75k-100k, 137.3% for AGIs $100k-200k)
Net capital gain/loss in AGI: +$15,218 (reported on 19.5% of returns)
Here:
+$15,218
State:
+$15,243
(% of AGI for various income ranges: 40.0% for AGIs below $25k, 4.7% for AGIs $25k-50k, 107.3% for AGIs $50k-75k, 158.3% for AGIs $75k-100k, 587.3% for AGIs $100k-200k)
Profit/loss from business: +$7,393 (reported on 16.1% of returns)
Here:
+$7,393
State:
+$11,763
(% of AGI for various income ranges: 93.6% for AGIs below $25k, 128.7% for AGIs $25k-50k, 300.0% for AGIs $75k-100k, 482.7% for AGIs $100k-200k)
Taxable individual retirement arrangement distribution: $16,138 (reported on 9.2% of returns)
51559:
$16,138
Iowa:
$17,324
(% of AGI for various income ranges: 171.4% for AGIs below $25k, 268.2% for AGIs $50k-75k, 687.3% for AGIs $100k-200k)
Total itemized deductions: $25,950 (reported on 4.6% of returns)
Here:
$25,950
State:
$33,775
(% of AGI for various income ranges: 943.6% for AGIs $100k-200k)
Charity contributions: $4,833 (reported on 3.4% of returns)
Here:
$4,833
State:
$13,075
(% of AGI for various income ranges: 131.8% for AGIs $50k-75k)
Taxes paid: $7,050 (reported on 4.6% of returns)
51559:
$7,050
State:
$7,704
(% of AGI for various income ranges: 256.4% for AGIs $100k-200k)
Earned income credit: $1,983 (reported on 6.9% of returns)
Here:
$1,983
State:
$2,195
(% of AGI for various income ranges: 36.4% for AGIs below $25k, 45.3% for AGIs $25k-50k)
Percentage of individuals using paid preparers for their 2020 taxes: 95.4%
Here:
95%
State:
95%
(% for various income ranges: 90.5% for AGIs below $25k, 94.7% for AGIs $25k-50k, 100.0% for AGIs $50k-75k, 100.0% for AGIs $75k-100k, 94.4% for AGIs $100k-200k, 100.0% for AGIs over 200k)
Averages for the 2012 tax year for zip code 51559, filed in 2013:
Average Adjusted Gross Income (AGI) in 2012: $59,230 (Individual Income Tax Returns)
Here:
$59,230
State:
$58,860
Salary/wage: $49,376 (reported on 82.6% of returns)
Here:
$49,376
State:
$46,659
(% of AGI for various income ranges: 68.4% for AGIs below $25k, 74.2% for AGIs $25k-50k, 73.9% for AGIs $50k-75k, 78.8% for AGIs $75k-100k, 59.6% for AGIs $100k-200k)
Taxable interest for individuals: $1,028 (reported on 41.9% of returns)
This zip code:
$1,028
Iowa:
$1,537
(% of AGI for various income ranges: 1.0% for AGIs below $25k, 1.0% for AGIs $25k-50k, 0.6% for AGIs $50k-75k, 0.4% for AGIs $75k-100k, 0.8% for AGIs $100k-200k)
Ordinary dividends: $2,378 (reported on 20.9% of returns)
Here:
$2,378
State:
$4,542
(% of AGI for various income ranges: 1.0% for AGIs below $25k, 0.8% for AGIs $25k-50k, 0.3% for AGIs $50k-75k, 0.7% for AGIs $75k-100k, 1.2% for AGIs $100k-200k)
Net capital gain/loss in AGI: +$5,079 (reported on 16.3% of returns)
Here:
+$5,079
State:
+$11,802
(% of AGI for various income ranges: 2.5% for AGIs $50k-75k, 0.8% for AGIs $75k-100k, 1.9% for AGIs $100k-200k)
Profit/loss from business: +$5,054 (reported on 15.1% of returns)
Here:
+$5,054
State:
+$10,509
(% of AGI for various income ranges: 4.5% for AGIs below $25k, 2.2% for AGIs $25k-50k, 1.7% for AGIs $50k-75k, 2.0% for AGIs $75k-100k)
Taxable individual retirement arrangement distribution: $7,912 (reported on 9.3% of returns)
51559:
$7,912
Iowa:
$11,773
Total itemized deductions: $18,097 (19% of AGI, reported on 34.9% of returns)
Here:
$18,097
State:
$21,278
Here:
18.9% of AGI
State:
18.9% of AGI
(% of AGI for various income ranges: 10.2% for AGIs below $25k, 8.0% for AGIs $25k-50k, 9.6% for AGIs $50k-75k, 11.7% for AGIs $75k-100k, 11.5% for AGIs $100k-200k)
Charity contributions: $2,052 (reported on 29.1% of returns)
Here:
$2,052
State:
$4,044
(% of AGI for various income ranges: 0.8% for AGIs below $25k, 0.5% for AGIs $25k-50k, 0.6% for AGIs $50k-75k, 1.1% for AGIs $75k-100k, 1.4% for AGIs $100k-200k)
Taxes paid: $7,570 (reported on 34.9% of returns)
51559:
$7,570
State:
$8,846
(% of AGI for various income ranges: 1.9% for AGIs below $25k, 2.3% for AGIs $25k-50k, 3.5% for AGIs $50k-75k, 4.7% for AGIs $75k-100k, 5.8% for AGIs $100k-200k)
Earned income credit: $2,162 (reported on 9.3% of returns)
Here:
$2,162
State:
$2,098
(% of AGI for various income ranges: 4.2% for AGIs below $25k, 0.7% for AGIs $25k-50k)
Percentage of individuals using paid preparers for their 2012 taxes: 72.1%
Here:
72%
State:
65%
(% for various income ranges: 60.0% for AGIs below $25k, 73.7% for AGIs $25k-50k, 80.0% for AGIs $50k-75k, 76.9% for AGIs $75k-100k, 78.6% for AGIs $100k-200k)
Averages for the 2004 tax year for zip code 51559, filed in 2005:
Average Adjusted Gross Income (AGI) in 2004: $41,408 (Individual Income Tax Returns)
Here:
$41,408
State:
$43,875
Salary/wage: $39,641 (reported on 84.7% of returns)
Here:
$39,641
State:
$38,265
(% of AGI for various income ranges: 73.0% for AGIs $10k-25k, 78.0% for AGIs $25k-50k, 77.7% for AGIs $50k-75k, 86.0% for AGIs $75k-100k, 68.4% for AGIs over 100k)
Taxable interest for individuals: $1,339 (reported on 53.3% of returns)
This zip code:
$1,339
Iowa:
$1,768
(% of AGI for various income ranges: 3.9% for AGIs $10k-25k, 2.1% for AGIs $25k-50k, 0.7% for AGIs $50k-75k, 0.8% for AGIs $75k-100k, 1.8% for AGIs over 100k)
Taxable dividends: $1,120 (reported on 24.9% of returns)
Here:
$1,120
State:
$2,510
(% of AGI for various income ranges: 0.8% for AGIs $10k-25k, 0.4% for AGIs $25k-50k, 0.3% for AGIs $50k-75k, 0.8% for AGIs $75k-100k, 1.0% for AGIs over 100k)
Net capital gain/loss: +$1,887 (reported on 19.8% of returns)
Here:
+$1,887
State:
+$6,139
(% of AGI for various income ranges: -0.3% for AGIs $10k-25k, 0.5% for AGIs $25k-50k, 1.8% for AGIs $50k-75k, 0.4% for AGIs $75k-100k, 0.5% for AGIs over 100k)
Profit/loss from business: +$5,296 (reported on 14.3% of returns)
Here:
+$5,296
State:
+$8,574
(% of AGI for various income ranges: 4.6% for AGIs $10k-25k, 3.9% for AGIs $25k-50k, 3.2% for AGIs $50k-75k, -0.2% for AGIs $75k-100k)
IRA payment deduction: $3,389 (reported on 2.2% of returns)
51559:
$3,389
Iowa:
$2,970
Total itemized deductions: $15,939 (24% of AGI, reported on 34.9% of returns)
Here:
$15,939
State:
$16,976
Here:
24.3% of AGI
State:
20.8% of AGI
(% of AGI for various income ranges: 17.5% for AGIs $10k-25k, 11.6% for AGIs $25k-50k, 10.9% for AGIs $50k-75k, 13.1% for AGIs $75k-100k, 16.1% for AGIs over 100k)
Charity contributions deductions: $1,903 (3% of AGI, reported on 29.4% of returns)
Here:
$1,903
State:
$3,089
Here:
2.8% of AGI
State:
3.6% of AGI
(% of AGI for various income ranges: 1.6% for AGIs $10k-25k, 1.0% for AGIs $25k-50k, 1.0% for AGIs $50k-75k, 1.6% for AGIs $75k-100k, 1.8% for AGIs over 100k)
Total tax: $4,852 (reported on 78.5% of returns)
51559:
$4,852
State:
$6,177
(% of AGI for various income ranges: 4.5% for AGIs $10k-25k, 6.4% for AGIs $25k-50k, 8.3% for AGIs $50k-75k, 9.4% for AGIs $75k-100k, 14.5% for AGIs over 100k)
Earned income credit: $1,614 (reported on 10.3% of returns)
Here:
$1,614
State:
$1,540
Percentage of individuals using paid preparers for their 2004 taxes: 75.5%
Here:
75%
State:
70%
(% for various income ranges: 63.4% for AGIs below $10k, 72.8% for AGIs $10k-25k, 81.9% for AGIs $25k-50k, 79.5% for AGIs $50k-75k, 76.9% for AGIs $75k-100k, 76.6% for AGIs over 100k)
Household received Food Stamps/SNAP in the past 12 months: 28 Household did not receive Food Stamps/SNAP in the past 12 months: 728
Women who had a birth in the past 12 months: 21 (15 now married, 5 unmarried) Women who did not have a birth in the past 12 months: 376 (207 now married, 168 unmarried)
Housing units in zip code 51559 with a mortgage: 371 (25 second mortgage, 15 both second mortgage and home equity loan) Median monthly owner costs for units with a mortgage: $1,511 Median monthly owner costs for units without a mortgage: $642
Residents with income below the poverty level in 2022:
This zip code:
4.3%
Whole state:
11.0%
Residents with income below 50% of the poverty level in 2022:
This zip code:
3.0%
Whole state:
5.5%
Median number of rooms in houses and condos:
Here:
7.2
State:
6.8
Median number of rooms in apartments:
Here:
6.2
State:
4.2
Notable locations in this zip code not listed on our city pages
Notable locations in zip code 51559: Neola (A), Neola Elevator (B), Quail Run Golf Course (C), Neola Volunteer Fire Department (D), Neola City Hall (E). Display/hide their locations on the map
Churches in zip code 51559 include: Saint Patricks Catholic Church (A), First Presbyterian Church (B), Saint Pauls Church (C). Display/hide their locations on the map
Cemeteries: Saint Pauls Lutheran Cemetery (1), Neola Cemetery (2), Saint Patricks Catholic Cemetery (3), Cox Cemetery (4). Display/hide their locations on the map
Size of family households: 264 2-persons, 103 3-persons, 69 4-persons, 57 5-persons, 20 6-persons, 15 7-or-more-persons
Size of nonfamily households: 185 1-person, 37 2-persons
420 married couples with children.
113 single-parent households (18 men, 95 women).
98.8% of residents of 51559 zip code speak English at home.
0.5% of residents speak Spanish at home (11% very well, 89% well).
Foreign born population: 18 (0.9%) (59.7% of them are naturalized citizens)
This zip code:
0.9%
Whole state:
6.0%
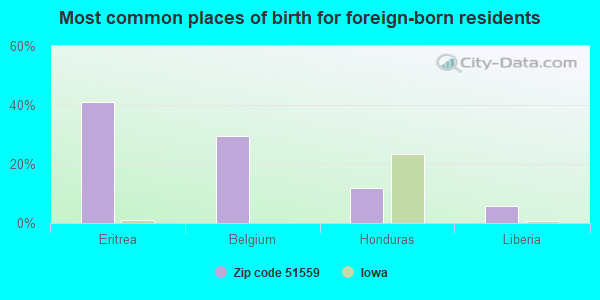
41%Eritrea
29%Belgium
12%Honduras
6%Liberia
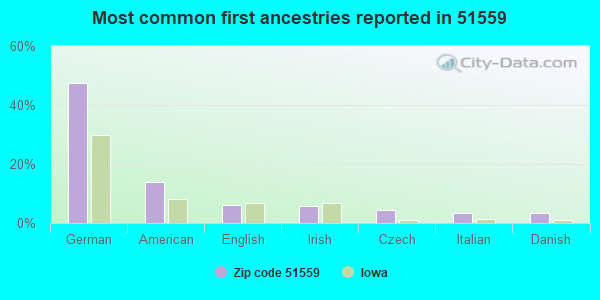
48%German
14%American
6%English
6%Irish
4%Czech
3%Italian
3%Danish
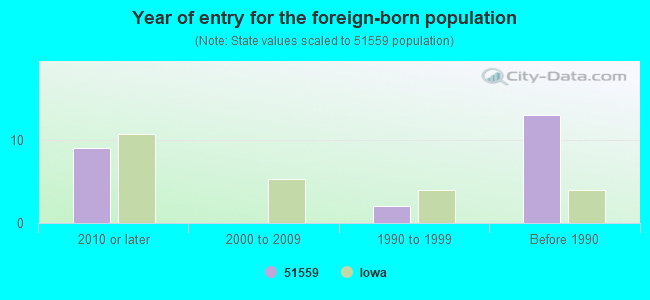
Year of entry for the foreign-born population
92010 or later
02000 to 2009
21990 to 1999
13Before 1990
Facilities with environmental interests located in this zip code:
TRI-CENTER HIGH SCHOOL (33980 310TH ST in NEOLA, IA)
(Geographic Names Information System) (National Center for Education Statistics) - STATE ID-786460 109 Organizations: TRI-CENTER COMM SCHOOL DISTRICT (SCHOOL DISTRICT)
TRI-CENTER ELEMENTARY SCHOOL (33980 310TH ST in NEOLA, IA)
(National Center for Education Statistics) - STATE ID-786460 417 Organizations: TRI-CENTER COMM SCHOOL DISTRICT (SCHOOL DISTRICT)
TRI-CENTER MIDDLE SCHOOL (33980 310TH ST in NEOLA, IA)
(National Center for Education Statistics) - STATE ID-786460 209 Organizations: TRI-CENTER COMM SCHOOL DISTRICT (SCHOOL DISTRICT)
ROLLING B FARMS (25597 310TH STREET in NEOLA, IA)
National Pollutant Discharge Elimination System NON-MAJOR (Tracking pollutant discharge elimination systems) - permit Alternative names: LAURENS CO LANDFILL
TRI-CENTER COMMUNITY SCHOOL (C/O BRETT NANNINGA, SUPT. in NEOLA, IA)
National Pollutant Discharge Elimination System NON-MAJOR (Tracking pollutant discharge elimination systems) - permit Business SIC classification: ELEMENTARY AND SECONDARY SCHOOLS
NEOLA CITY OF STP (CITY CLERK in NEOLA, IA)
National Pollutant Discharge Elimination System NON-MAJOR (Tracking pollutant discharge elimination systems) - permit Business SIC classification: SEWERAGE SYSTEMS Organizations: CITY OF NEOLA (CONTACT/OWNER)
ST JOE SCHOOL (3RD & AVON in NEOLA, IA)
COMPLIANCE ACTIVITY (Tracking inspections of insecticide, fungicide, and rodenticide, and toxic substances)
ST JOSEPH SCHOOL (3RD & NEOLA in NEOLA, IA)
COMPLIANCE ACTIVITY (Tracking inspections of insecticide, fungicide, and rodenticide, and toxic substances)
TRI-CENTER C S D (RR2 PO BOX 217A in NEOLA, IA)
COMPLIANCE ACTIVITY (Tracking inspections of insecticide, fungicide, and rodenticide, and toxic substances)
TRI-CENTER CSD (RR 2 BOX 217A in NEOLA, IA)
COMPLIANCE ACTIVITY (Tracking inspections of insecticide, fungicide, and rodenticide, and toxic substances)
Housing units lacking complete plumbing facilities: 1.8% Housing units lacking complete kitchen facilities: 4.9%
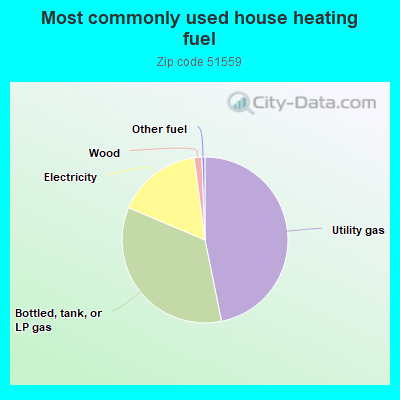
47.0%Utility gas
34.7%Bottled, tank, or LP gas
16.6%Electricity
1.5%Wood
0.6%Other fuel
Population in 1990: 1,766.
Place of birth for U.S.-born residents:
This state: 1,217
Northeast: 28
Midwest: 563
South: 117
West: 42
69% of the 51559 zip code residents lived in the same house 5 years ago. Out of people who lived in different houses, 79% lived in this county. Out of people who lived in different counties, 50% lived in Iowa.
89% of the 51559 zip code residents lived in the same house 1 year ago. Out of people who lived in different houses, 44% moved from this county. Out of people who lived in different houses, 18% moved from different county within same state. Out of people who lived in different houses, 36% moved from different state.
Private vs. public school enrollment:
Students in private schools in grades 1 to 8 (elementary and middle school): 13
Here:
5.5%
Iowa:
10.6%
Students in private schools in grades 9 to 12 (high school): 5
Here:
3.4%
Iowa:
7.9%
Students in private undergraduate colleges: 65
Here:
87.4%
Iowa:
23.9%
Occupation by median earnings in the past 12 months ($)
94,422Transportation occupations
79,387Life, physical, and social science occupations
78,521Computer and mathematical occupations
75,497Management occupations
72,439Community and social service occupations
70,056Sales and related occupations
Top industries in this zip code by the number of employees in 2005:
Finance and Insurance: Commercial Banking (10-19 employees: 1 establishment)
Other Services (except Public Administration): Religious Organizations (5-9: 1, 1-4: 1)
Construction: Plumbing, Heating, and Air-Conditioning Contractors (5-9: 1)
Construction: Other Heavy and Civil Engineering Construction (5-9: 1)
Arts, Entertainment, and Recreation: Other Spectator Sports (1-4: 2)
Fatal accident statistics in 2012:
Fatal accident count: 1
Vehicles involved in fatal accidents: 1
Fatal accidents caused by drunken drivers: 1
Fatalities: 1
Persons involved in fatal accidents: 1
Pedestrians involved in fatal accidents: 0
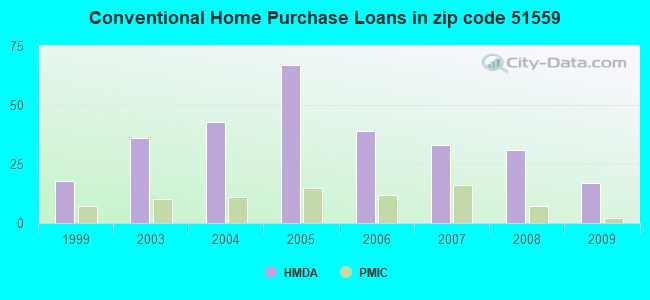
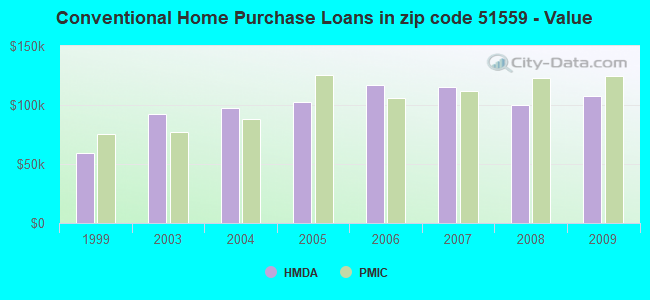
Home Mortgage Disclosure Act Aggregated Statistics For Year 2009 (Based on 4 partial tracts)
A) FHA, FSA/RHS & VA Home Purchase Loans
B) Conventional Home Purchase Loans
C) Refinancings
D) Home Improvement Loans
F) Non-occupant Loans on < 5 Family Dwellings (A B C & D)
Number
Average Value
Number
Average Value
Number
Average Value
Number
Average Value
Number
Average Value
LOANS ORIGINATED
12
$108,473
17
$107,644
84
$143,125
14
$36,171
7
$57,520
APPLICATIONS APPROVED, NOT ACCEPTED
0
$0
1
$61,210
9
$125,471
0
$0
2
$57,685
APPLICATIONS DENIED
4
$91,498
2
$88,755
37
$140,933
2
$54,880
0
$0
APPLICATIONS WITHDRAWN
0
$0
3
$72,137
6
$150,860
0
$0
1
$109,480
FILES CLOSED FOR INCOMPLETENESS
1
$210,720
0
$0
1
$95,550
0
$0
0
$0
Aggregated Statistics For Year 2008 (Based on 4 partial tracts)
A) FHA, FSA/RHS & VA Home Purchase Loans
B) Conventional Home Purchase Loans
C) Refinancings
D) Home Improvement Loans
F) Non-occupant Loans on < 5 Family Dwellings (A B C & D)
G) Loans On Manufactured Home Dwelling (A B C & D)
Number
Average Value
Number
Average Value
Number
Average Value
Number
Average Value
Number
Average Value
Number
Average Value
LOANS ORIGINATED
9
$133,581
31
$99,670
58
$114,655
22
$20,032
23
$59,800
1
$97,710
APPLICATIONS APPROVED, NOT ACCEPTED
0
$0
1
$143,620
5
$86,448
3
$35,330
0
$0
0
$0
APPLICATIONS DENIED
1
$34,140
3
$78,210
26
$120,493
4
$11,792
1
$63,940
0
$0
APPLICATIONS WITHDRAWN
1
$221,870
1
$98,580
10
$129,464
3
$43,897
0
$0
0
$0
FILES CLOSED FOR INCOMPLETENESS
0
$0
0
$0
1
$136,550
0
$0
0
$0
0
$0
Aggregated Statistics For Year 2007 (Based on 4 partial tracts)
A) FHA, FSA/RHS & VA Home Purchase Loans
B) Conventional Home Purchase Loans
C) Refinancings
D) Home Improvement Loans
F) Non-occupant Loans on < 5 Family Dwellings (A B C & D)
G) Loans On Manufactured Home Dwelling (A B C & D)
Number
Average Value
Number
Average Value
Number
Average Value
Number
Average Value
Number
Average Value
Number
Average Value
LOANS ORIGINATED
6
$147,675
33
$115,352
55
$109,832
24
$26,533
5
$66,766
1
$49,960
APPLICATIONS APPROVED, NOT ACCEPTED
0
$0
6
$116,475
13
$114,881
2
$20,600
0
$0
0
$0
APPLICATIONS DENIED
0
$0
10
$94,182
28
$128,645
6
$66,883
1
$146,250
0
$0
APPLICATIONS WITHDRAWN
0
$0
4
$115,365
15
$123,223
2
$14,125
1
$130,670
0
$0
FILES CLOSED FOR INCOMPLETENESS
0
$0
0
$0
6
$124,202
0
$0
0
$0
0
$0
Aggregated Statistics For Year 2006 (Based on 4 partial tracts)
A) FHA, FSA/RHS & VA Home Purchase Loans
B) Conventional Home Purchase Loans
C) Refinancings
D) Home Improvement Loans
E) Loans on Dwellings For 5+ Families
F) Non-occupant Loans on < 5 Family Dwellings (A B C & D)
Number
Average Value
Number
Average Value
Number
Average Value
Number
Average Value
Number
Average Value
Number
Average Value
LOANS ORIGINATED
4
$69,712
39
$116,585
63
$100,863
31
$34,705
1
$14,130
12
$89,608
APPLICATIONS APPROVED, NOT ACCEPTED
0
$0
2
$30,020
16
$108,219
3
$29,710
0
$0
1
$58,860
APPLICATIONS DENIED
0
$0
4
$116,848
42
$120,647
19
$30,203
0
$0
4
$56,800
APPLICATIONS WITHDRAWN
0
$0
2
$115,825
19
$137,677
8
$89,846
0
$0
0
$0
FILES CLOSED FOR INCOMPLETENESS
0
$0
1
$182,470
4
$147,078
0
$0
0
$0
0
$0
Aggregated Statistics For Year 2005 (Based on 4 partial tracts)
A) FHA, FSA/RHS & VA Home Purchase Loans
B) Conventional Home Purchase Loans
C) Refinancings
D) Home Improvement Loans
F) Non-occupant Loans on < 5 Family Dwellings (A B C & D)
Number
Average Value
Number
Average Value
Number
Average Value
Number
Average Value
Number
Average Value
LOANS ORIGINATED
2
$104,605
67
$102,421
76
$113,171
24
$32,213
4
$57,398
APPLICATIONS APPROVED, NOT ACCEPTED
0
$0
4
$83,472
10
$70,535
3
$53,977
0
$0
APPLICATIONS DENIED
0
$0
11
$59,395
49
$98,831
10
$50,183
0
$0
APPLICATIONS WITHDRAWN
0
$0
6
$56,110
31
$105,413
1
$127,140
0
$0
FILES CLOSED FOR INCOMPLETENESS
0
$0
3
$111,707
7
$110,981
1
$56,180
0
$0
Aggregated Statistics For Year 2004 (Based on 4 partial tracts)
A) FHA, FSA/RHS & VA Home Purchase Loans
B) Conventional Home Purchase Loans
C) Refinancings
D) Home Improvement Loans
E) Loans on Dwellings For 5+ Families
F) Non-occupant Loans on < 5 Family Dwellings (A B C & D)
Number
Average Value
Number
Average Value
Number
Average Value
Number
Average Value
Number
Average Value
Number
Average Value
LOANS ORIGINATED
5
$125,832
43
$97,477
94
$107,752
22
$35,433
3
$120,980
12
$58,028
APPLICATIONS APPROVED, NOT ACCEPTED
0
$0
1
$69,490
18
$107,576
1
$29,690
0
$0
0
$0
APPLICATIONS DENIED
0
$0
9
$81,150
48
$97,953
13
$17,305
0
$0
1
$220,670
APPLICATIONS WITHDRAWN
0
$0
4
$100,602
18
$103,817
1
$137,970
0
$0
0
$0
FILES CLOSED FOR INCOMPLETENESS
0
$0
0
$0
12
$119,585
0
$0
0
$0
0
$0
Aggregated Statistics For Year 2003 (Based on 4 partial tracts)
A) FHA, FSA/RHS & VA Home Purchase Loans
B) Conventional Home Purchase Loans
C) Refinancings
D) Home Improvement Loans
E) Loans on Dwellings For 5+ Families
F) Non-occupant Loans on < 5 Family Dwellings (A B C & D)
Number
Average Value
Number
Average Value
Number
Average Value
Number
Average Value
Number
Average Value
Number
Average Value
LOANS ORIGINATED
8
$104,114
36
$92,358
170
$98,820
21
$18,814
4
$58,272
8
$35,414
APPLICATIONS APPROVED, NOT ACCEPTED
0
$0
2
$118,550
24
$96,535
3
$12,277
0
$0
1
$145,970
APPLICATIONS DENIED
2
$119,485
6
$54,522
48
$94,765
10
$17,814
0
$0
1
$47,090
APPLICATIONS WITHDRAWN
0
$0
4
$71,300
19
$83,946
0
$0
0
$0
0
$0
FILES CLOSED FOR INCOMPLETENESS
0
$0
1
$176,580
12
$97,392
0
$0
0
$0
0
$0
Aggregated Statistics For Year 1999 (Based on 1 partial tract)
A) FHA, FSA/RHS & VA Home Purchase Loans
B) Conventional Home Purchase Loans
C) Refinancings
D) Home Improvement Loans
F) Non-occupant Loans on < 5 Family Dwellings (A B C & D)
Detailed PMIC statistics for the following Tracts:0215.01
, 0216.03
2002 - 2018 National Fire Incident Reporting System (NFIRS) incidents
Based on the data from the years 2002 - 2018 the average number of fire incidents per year is 7. The highest number of fires - 24 took place in 2005, and the least - 0 in 2006. The data has a constant trend.
When looking into fire subcategories, the most incidents belonged to: Outside Fires (50.9%), and Structure Fires (25.0%).
Fire incident types reported to NFIRS in Zip Code 51559


 Nearest zip codes: 51576, 51553, 51563, 51548, 51570, 51542.


 Based on the data from the years 2002 - 2018 the average number of fire incidents per year is 7. The highest number of fires - 24 took place in 2005, and the least - 0 in 2006. The data has a constant trend.
 When looking into fire subcategories, the most incidents belonged to: Outside Fires (50.9%), and Structure Fires (25.0%).