Estimated zip code population in 2022: 2,800 Zip code population in 2010: 3,090 Zip code population in 2000: 3,309
Houses and condos: 1,389 Renter-occupied apartments: 193
% of renters here:
16%
State:
28%
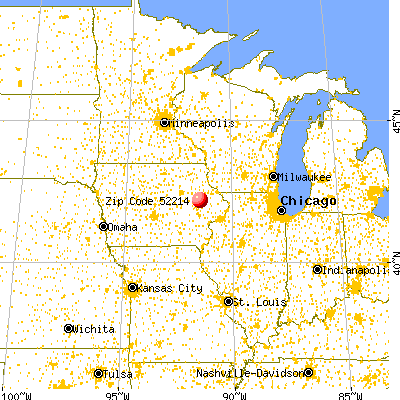
March 2022 cost of living index in zip code 52214: 84.0 (less than average, U.S. average is 100)
Land area: 94.4 sq. mi. Water area: 1.2 sq. mi.
Population density: 30 people per square mile
(very low).
OSM Map
General Map
Google Map
MSN Map
OSM Map
General Map
Google Map
MSN Map
OSM Map
General Map
Google Map
MSN Map
OSM Map
General Map
Google Map
MSN Map
Please wait while loading the map...
Real estate property taxes paid for housing units in 2022:
This zip code:
1.2% ($2,839)
Iowa:
1.4% ($2,724)
Median real estate property taxes paid for housing units with mortgages in 2022: $2,806 (1.1%) Median real estate property taxes paid for housing units with no mortgage in 2022: $2,888 (1.2%)
Business Search- 14 Million verified businesses
Males: 1,308
(46.7%)
Females: 1,491
(53.3%)
For population 25 years and over in 52214:
High school or higher: 96.9%
Bachelor's degree or higher: 24.1%
Graduate or professional degree: 7.0%
Unemployed: 3.7%
Mean travel time to work (commute): 27.2 minutes
For population 15 years and over in 52214:
Never married: 20.6%
Now married: 68.3%
Separated: 1.5%
Widowed: 3.4%
Divorced: 6.2%
Zip code 52214 compared to state average:
Black race population percentage significantly below state average.
Hispanic race population percentage significantly below state average.
Median age above state average.
Foreign-born population percentage significantly below state average.
Renting percentage below state average.
Length of stay since moving in significantly above state average.
Estimated median house/condo value in 2022: $244,750
52214:
$244,750
Iowa:
$194,600
According to our research of Iowa and other state lists, there were 5 registered sex offenders living in 52214 zip code as of May 28, 2024. The ratio of all residents to sex offenders in zip code 52214 is 739 to 1. The ratio of registered sex offenders to all residents in this zip code is lower than the state average.
Median resident age:
This zip code:
46.5 years
Iowa median age:
38.9 years
Average household size:
This zip code:
2.4 people
Iowa:
2.3 people
Averages for the 2020 tax year for zip code 52214, filed in 2021:
Average Adjusted Gross Income (AGI) in 2020: $71,792 (Individual Income Tax Returns)
Here:
$71,792
State:
$71,087
Salary/wage: $62,259 (reported on 81.5% of returns)
Here:
$62,259
State:
$57,361
(% of AGI for various income ranges: 1248.1% for AGIs below $25k, 3582.3% for AGIs $25k-50k, 6297.1% for AGIs $50k-75k, 9610.0% for AGIs $75k-100k, 16178.9% for AGIs $100k-200k)
Taxable interest for individuals: $1,646 (reported on 43.0% of returns)
This zip code:
$1,646
Iowa:
$1,633
(% of AGI for various income ranges: 32.3% for AGIs below $25k, 43.5% for AGIs $25k-50k, 94.7% for AGIs $50k-75k, 95.5% for AGIs $75k-100k, 238.3% for AGIs $100k-200k)
Ordinary dividends: $2,171 (reported on 23.2% of returns)
Here:
$2,171
State:
$5,432
(% of AGI for various income ranges: 20.8% for AGIs below $25k, 40.4% for AGIs $25k-50k, 61.8% for AGIs $50k-75k, 38.2% for AGIs $75k-100k, 215.0% for AGIs $100k-200k)
Net capital gain/loss in AGI: +$6,135 (reported on 20.5% of returns)
Here:
+$6,135
State:
+$15,243
(% of AGI for various income ranges: 11.2% for AGIs below $25k, 69.6% for AGIs $25k-50k, 128.8% for AGIs $50k-75k, 180.0% for AGIs $75k-100k, 513.3% for AGIs $100k-200k)
Profit/loss from business: +$12,195 (reported on 13.2% of returns)
Here:
+$12,195
State:
+$11,763
(% of AGI for various income ranges: 91.2% for AGIs below $25k, 143.1% for AGIs $25k-50k, 1.8% for AGIs $50k-75k, 299.1% for AGIs $75k-100k, 832.2% for AGIs $100k-200k)
Taxable individual retirement arrangement distribution: $12,955 (reported on 13.2% of returns)
52214:
$12,955
Iowa:
$17,324
(% of AGI for various income ranges: 90.8% for AGIs below $25k, 117.7% for AGIs $25k-50k, 285.9% for AGIs $50k-75k, 346.4% for AGIs $75k-100k, 656.7% for AGIs $100k-200k)
Total itemized deductions: $32,733 (reported on 6.0% of returns)
Here:
$32,733
State:
$33,775
(% of AGI for various income ranges: 203.1% for AGIs below $25k, 345.9% for AGIs $50k-75k, 1016.7% for AGIs $100k-200k)
Charity contributions: $17,720 (reported on 3.3% of returns)
Here:
$17,720
State:
$13,075
(% of AGI for various income ranges: 492.2% for AGIs $100k-200k)
Taxes paid: $6,767 (reported on 6.0% of returns)
52214:
$6,767
State:
$7,704
(% of AGI for various income ranges: 24.2% for AGIs below $25k, 109.4% for AGIs $50k-75k, 200.0% for AGIs $100k-200k)
Earned income credit: $2,036 (reported on 9.3% of returns)
Here:
$2,036
State:
$2,195
(% of AGI for various income ranges: 62.3% for AGIs below $25k, 47.3% for AGIs $25k-50k)
Percentage of individuals using paid preparers for their 2020 taxes: 94.7%
Here:
95%
State:
95%
(% for various income ranges: 92.7% for AGIs below $25k, 94.3% for AGIs $25k-50k, 95.8% for AGIs $50k-75k, 94.1% for AGIs $75k-100k, 96.6% for AGIs $100k-200k, 100.0% for AGIs over 200k)
Averages for the 2012 tax year for zip code 52214, filed in 2013:
Average Adjusted Gross Income (AGI) in 2012: $55,615 (Individual Income Tax Returns)
Here:
$55,615
State:
$58,860
Salary/wage: $47,378 (reported on 82.6% of returns)
Here:
$47,378
State:
$46,659
(% of AGI for various income ranges: 66.5% for AGIs below $25k, 73.0% for AGIs $25k-50k, 76.6% for AGIs $50k-75k, 75.6% for AGIs $75k-100k, 74.9% for AGIs $100k-200k, 41.8% for AGIs over 200k)
Taxable interest for individuals: $1,677 (reported on 45.1% of returns)
This zip code:
$1,677
Iowa:
$1,537
(% of AGI for various income ranges: 2.9% for AGIs below $25k, 1.5% for AGIs $25k-50k, 0.8% for AGIs $50k-75k, 0.8% for AGIs $75k-100k, 1.0% for AGIs $100k-200k, 2.9% for AGIs over 200k)
Ordinary dividends: $2,144 (reported on 22.2% of returns)
Here:
$2,144
State:
$4,542
(% of AGI for various income ranges: 1.3% for AGIs below $25k, 0.7% for AGIs $25k-50k, 0.6% for AGIs $50k-75k, 0.5% for AGIs $75k-100k, 1.7% for AGIs $100k-200k)
Net capital gain/loss in AGI: +$6,467 (reported on 16.7% of returns)
Here:
+$6,467
State:
+$11,802
(% of AGI for various income ranges: 0.4% for AGIs below $25k, 0.3% for AGIs $25k-50k, 1.0% for AGIs $50k-75k, 0.7% for AGIs $75k-100k, 5.7% for AGIs $100k-200k)
Profit/loss from business: +$7,405 (reported on 13.2% of returns)
Here:
+$7,405
State:
+$10,509
(% of AGI for various income ranges: 5.2% for AGIs below $25k, 1.8% for AGIs $25k-50k, 1.7% for AGIs $50k-75k, 1.2% for AGIs $75k-100k, 2.1% for AGIs $100k-200k)
Taxable individual retirement arrangement distribution: $8,453 (reported on 11.8% of returns)
52214:
$8,453
Iowa:
$11,773
(% of AGI for various income ranges: 3.3% for AGIs below $25k, 3.3% for AGIs $25k-50k, 1.7% for AGIs $50k-75k, 2.3% for AGIs $75k-100k, 1.1% for AGIs $100k-200k)
Total itemized deductions: $18,436 (19% of AGI, reported on 29.2% of returns)
Here:
$18,436
State:
$21,278
Here:
19.2% of AGI
State:
18.9% of AGI
(% of AGI for various income ranges: 11.7% for AGIs below $25k, 7.9% for AGIs $25k-50k, 9.1% for AGIs $50k-75k, 9.0% for AGIs $75k-100k, 11.7% for AGIs $100k-200k, 8.2% for AGIs over 200k)
Charity contributions: $3,045 (reported on 22.9% of returns)
Here:
$3,045
State:
$4,044
(% of AGI for various income ranges: 1.0% for AGIs below $25k, 1.1% for AGIs $25k-50k, 0.7% for AGIs $50k-75k, 1.3% for AGIs $75k-100k, 1.8% for AGIs $100k-200k, 1.4% for AGIs over 200k)
Taxes paid: $7,414 (reported on 29.2% of returns)
52214:
$7,414
State:
$8,846
(% of AGI for various income ranges: 2.0% for AGIs below $25k, 2.0% for AGIs $25k-50k, 3.1% for AGIs $50k-75k, 3.7% for AGIs $75k-100k, 5.6% for AGIs $100k-200k, 5.1% for AGIs over 200k)
Earned income credit: $1,742 (reported on 13.2% of returns)
Here:
$1,742
State:
$2,098
(% of AGI for various income ranges: 4.1% for AGIs below $25k, 0.8% for AGIs $25k-50k)
Percentage of individuals using paid preparers for their 2012 taxes: 61.1%
Here:
61%
State:
65%
(% for various income ranges: 54.2% for AGIs below $25k, 61.8% for AGIs $25k-50k, 68.0% for AGIs $50k-75k, 64.7% for AGIs $75k-100k, 64.7% for AGIs $100k-200k, 66.7% for AGIs over 200k)
Averages for the 2004 tax year for zip code 52214, filed in 2005:
Average Adjusted Gross Income (AGI) in 2004: $41,671 (Individual Income Tax Returns)
Here:
$41,671
State:
$43,875
Salary/wage: $39,667 (reported on 82.0% of returns)
Here:
$39,667
State:
$38,265
(% of AGI for various income ranges: 121.4% for AGIs below $10k, 62.8% for AGIs $10k-25k, 80.4% for AGIs $25k-50k, 81.8% for AGIs $50k-75k, 85.0% for AGIs $75k-100k, 69.1% for AGIs over 100k)
Taxable interest for individuals: $1,338 (reported on 55.5% of returns)
This zip code:
$1,338
Iowa:
$1,768
(% of AGI for various income ranges: 12.5% for AGIs below $10k, 5.4% for AGIs $10k-25k, 1.8% for AGIs $25k-50k, 1.0% for AGIs $50k-75k, 0.6% for AGIs $75k-100k, 1.4% for AGIs over 100k)
Taxable dividends: $849 (reported on 24.6% of returns)
Here:
$849
State:
$2,510
(% of AGI for various income ranges: 3.4% for AGIs below $10k, 0.9% for AGIs $10k-25k, 0.4% for AGIs $25k-50k, 0.4% for AGIs $50k-75k, 0.3% for AGIs $75k-100k, 0.5% for AGIs over 100k)
Net capital gain/loss: +$2,519 (reported on 20.9% of returns)
Here:
+$2,519
State:
+$6,139
(% of AGI for various income ranges: 16.6% for AGIs below $10k, 0.6% for AGIs $10k-25k, 0.9% for AGIs $25k-50k, 0.8% for AGIs $50k-75k, 2.2% for AGIs $75k-100k, 1.0% for AGIs over 100k)
Profit/loss from business: +$6,378 (reported on 15.8% of returns)
Here:
+$6,378
State:
+$8,574
(% of AGI for various income ranges: 5.6% for AGIs below $10k, 5.7% for AGIs $10k-25k, 2.4% for AGIs $25k-50k, 3.1% for AGIs $50k-75k, 0.2% for AGIs $75k-100k, 1.6% for AGIs over 100k)
IRA payment deduction: $3,415 (reported on 2.9% of returns)
52214:
$3,415
Iowa:
$2,970
Self-employed pension: $5,500 (reported on 0.8% of returns)
Here:
$5,500
Iowa:
$11,928
Total itemized deductions: $15,082 (22% of AGI, reported on 33.6% of returns)
Here:
$15,082
State:
$16,976
Here:
22.0% of AGI
State:
20.8% of AGI
(% of AGI for various income ranges: 23.4% for AGIs below $10k, 8.6% for AGIs $10k-25k, 11.0% for AGIs $25k-50k, 12.0% for AGIs $50k-75k, 13.5% for AGIs $75k-100k, 13.5% for AGIs over 100k)
Charity contributions deductions: $2,219 (3% of AGI, reported on 28.0% of returns)
Here:
$2,219
State:
$3,089
Here:
3.1% of AGI
State:
3.6% of AGI
(% of AGI for various income ranges: 1.2% for AGIs $10k-25k, 1.0% for AGIs $25k-50k, 1.1% for AGIs $50k-75k, 2.1% for AGIs $75k-100k, 2.2% for AGIs over 100k)
Total tax: $5,001 (reported on 80.2% of returns)
52214:
$5,001
State:
$6,177
(% of AGI for various income ranges: 7.5% for AGIs below $10k, 4.2% for AGIs $10k-25k, 6.7% for AGIs $25k-50k, 8.2% for AGIs $50k-75k, 9.9% for AGIs $75k-100k, 17.2% for AGIs over 100k)
Earned income credit: $1,411 (reported on 10.3% of returns)
Here:
$1,411
State:
$1,540
Percentage of individuals using paid preparers for their 2004 taxes: 67.2%
Here:
67%
State:
70%
(% for various income ranges: 59.4% for AGIs below $10k, 65.8% for AGIs $10k-25k, 71.9% for AGIs $25k-50k, 70.9% for AGIs $50k-75k, 68.6% for AGIs $75k-100k, 60.2% for AGIs over 100k)
Likely homosexual households (counted as self-reported same-sex unmarried-partner households)
Lesbian couples: 0.7% of all households
Gay men: 0.0% of all households
Household received Food Stamps/SNAP in the past 12 months: 71 Household did not receive Food Stamps/SNAP in the past 12 months: 1,111
Women who had a birth in the past 12 months: 62 (40 now married, 20 unmarried) Women who did not have a birth in the past 12 months: 515 (268 now married, 246 unmarried)
Housing units in zip code 52214 with a mortgage: 582 (131 second mortgage, 2 home equity loan, 108 both second mortgage and home equity loan) Houses without a mortgage: 5
Median monthly owner costs for units with a mortgage: $1,747 Median monthly owner costs for units without a mortgage: $600
Residents with income below the poverty level in 2022:
This zip code:
10.9%
Whole state:
11.0%
Residents with income below 50% of the poverty level in 2022:
This zip code:
8.6%
Whole state:
5.5%
Median number of rooms in houses and condos:
Here:
6.6
State:
6.8
Median number of rooms in apartments:
Here:
4.6
State:
4.2
Notable locations in this zip code not listed on our city pages
Notable locations in zip code 52214: Rogers (A), Central City (B), Camp Wakomda (C), Camp Waubeek (D), Wapsa (E), Necot (F), Nugent (G), Meadowview Country Club (H), John C Clegg Library (I), Central City Hall (J), Northeast Linn Ambulance Service (K), Central City Fire Department (L). Display/hide their locations on the map
Churches in zip code 52214 include: United Methodist Church (A), Saint Stephen's Catholic Church (B), United Church of Christ (C). Display/hide their locations on the map
Cemeteries: Oakhill Cemetery (1), Blodgett Cemetery (2), Boulder Cemetery (3), Prairieburg-Boulder Cemetery (4), Gillilan Cemetery (5), Hazel Knoll Cemetery (6), Mills Cemetery (7). Display/hide their locations on the map
Parks in zip code 52214 include: Eakpicada County Park (1), Jay G Sigmund Park (2), Matsell Bridge Public Access (3), Mount Hope Public Access (4), Pinicon Ridge County Park (5), Wakpicada County Park (6). Display/hide their locations on the map
Size of family households: 519 2-persons, 146 3-persons, 153 4-persons, 70 5-persons
Size of nonfamily households: 229 1-person, 55 2-persons
444 married couples with children.
86 single-parent households (43 men, 43 women).
98.9% of residents of 52214 zip code speak English at home.
0.4% of residents speak Spanish at home (64% very well, 36% not well).
0.6% of residents speak other Indo-European language at home (100% very well).
Foreign born population: 21 (0.8%) (80.6% of them are naturalized citizens)
This zip code:
0.8%
Whole state:
6.0%
15%Honduras
41%German
13%Czech
5%American
5%Irish
4%English
4%Norwegian
4%European
Year of entry for the foreign-born population
142010 or later
72000 to 2009
61990 to 1999
0Before 1990
Major facilities with environmental interests located in this zip code:
CENTRAL CITY HIGH SCHOOL (400 BARBER ST in CENTRAL CITY, IA)
(National Center for Education Statistics) - STATE ID-571089 109 Conditionally Exempt Small Quantity Generators, less than 100 kg/month of hazardous waste (Resource Conservation and Recovery Act (tracking hazardous waste)) - ICIS-, ENFORCEMENT/COMPLIANCE ACTIVITY Organizations: CENTRAL CITY COMMUNITY SCHOOL DISTRICT (CONTACT/OPERATOR)
, CENTRAL CITY COMM SCHOOL DISTRICT (SCHOOL DISTRICT)
COSMETOLOGY FOR CARS (32 4TH STREET in CENTRAL CITY, IA)
AIR MINOR (AIRS/AFS) AIR SYNTHETIC MINOR (AIRS/AFS) (Resource Conservation and Recovery Act (tracking hazardous waste)) Business SIC classification: GENERAL AUTOMOTIVE REPAIR SHOPS; NONCLASSIFIABLE ESTABLISHMENTS Organizations: CARROLL C HALL JR (CONTACT/OWNER)
Alternative names: COOKIES AUTO BODY, COOKIES AUTO BODY SERVICE-FORMER SITE OF, CRYSTAL SPRAY AUTO BODY
CENTRAL CITY ELEMENTARY SCHOOL (400 BARBER ST in CENTRAL CITY, IA)
(National Center for Education Statistics) - STATE ID-571089 409 Organizations: CENTRAL CITY COMM SCHOOL DISTRICT (SCHOOL DISTRICT)
CENTRAL CITY MIDDLE SCHOOL (400 BARBER ST in CENTRAL CITY, IA)
(National Center for Education Statistics) - STATE ID-571089 418 Organizations: CENTRAL CITY COMM SCHOOL DISTRICT (SCHOOL DISTRICT)
CENTRAL CITY COM SCH DIST (4TH & BARBER in CENTRAL CITY, IA)
(Integrated Compliance Information System) - ICIS-07-2000-0059, FORMAL ENFORCEMENT ACTION
CENTRAL CITY C S D (400 BARBER in CENTRAL CITY, IA)
COMPLIANCE ACTIVITY (Tracking inspections of insecticide, fungicide, and rodenticide, and toxic substances) Alternative names: CENTRAL CITY COMM SCHOOLS, CENTRAL CITY CSD
PLOWER QUARRY (4822 DREXLER ROAD in CENTRAL CITY, IA)
National Pollutant Discharge Elimination System NON-MAJOR (Tracking pollutant discharge elimination systems) - permit Business SIC classification: CRUSHED AND BROKEN LIMESTONE Organizations: WENDLING QUARRIES, INC. (CONTACT/OWNER)
Alternative names: WENDLING QUARRIES INC
CENTRAL CITY, CITY OF STP (137 4TH STREET in CENTRAL CITY, IA)
National Pollutant Discharge Elimination System NON-MAJOR (Tracking pollutant discharge elimination systems) - permit Business SIC classification: SEWERAGE SYSTEMS Organizations: CITY OF CENTRAL CITY (CONTACT/OWNER)
SHARON AUTO SALES (653 E MAPLE ST. in CENTRAL CITY, IA)
AIR MINOR (AIRS/AFS) Business SIC classification: NONCLASSIFIABLE ESTABLISHMENTS
SWISS VALLEY AG SERVICE (450 SOUTH RIVER ROAD in CENTRAL CITY, IA)
AIR MINOR (AIRS/AFS) COMPLIANCE ACTIVITY (Tracking inspections of insecticide, fungicide, and rodenticide, and toxic substances) Business SIC classification: FARM PRODUCT WAREHOUSING AND STORAGE Alternative names: SWISS VALLEY FARMS COMPANY CENTRAL CITY NH3
AMOCO FERTILIZER PLANT-FORMER SITE OF (OFF HWY 13 in CENTRAL CITY, IA)
(Resource Conservation and Recovery Act (tracking hazardous waste))
BARD CONCRETE (1001 MARION ROAD SOUTH in CENTRAL CITY, IA)
AIR MINOR (AIRS/AFS) Business SIC classification: READY-MIXED CONCRETE
DON'S STANDARD LLC (356 MAIN ST. in CENTRAL CITY, IA)
AIR MINOR (AIRS/AFS) Business SIC classification: GASOLINE SERVICE STATIONS
Housing units lacking complete plumbing facilities: 2.9% Housing units lacking complete kitchen facilities: 2.8%
41.8%Bottled, tank, or LP gas
37.5%Utility gas
10.4%Electricity
7.1%Wood
1.9%Fuel oil, kerosene, etc.
1.7%Other fuel
Population in 1990: 3,478.
Place of birth for U.S.-born residents:
This state: 2,383
Northeast: 23
Midwest: 230
South: 44
West: 88
63% of the 52214 zip code residents lived in the same house 5 years ago. Out of people who lived in different houses, 70% lived in this county. Out of people who lived in different counties, 50% lived in Iowa.
98% of the 52214 zip code residents lived in the same house 1 year ago. Out of people who lived in different houses, 110% moved from this county. Out of people who lived in different houses, 2% moved from different state.
Private vs. public school enrollment:
Students in private schools in grades 1 to 8 (elementary and middle school): 17
Here:
6.9%
Iowa:
10.6%
Students in private schools in grades 9 to 12 (high school): 20
Here:
14.2%
Iowa:
7.9%
Students in private undergraduate colleges: 10
Here:
17.7%
Iowa:
23.9%
Occupation by median earnings in the past 12 months ($)
127,383Architecture and engineering occupations
96,712Sales and related occupations
92,763Management occupations
88,991Computer and mathematical occupations
87,762Installation, maintenance, and repair occupations
75,330Health diagnosing and treating practitioners and other technical occupations
Companies with federal contracts located in this zip code:
CENTRAL CITY MFG , INC (OLD HIGHWAY 13 SOUTH in CENTRAL CITY, IA; small business) : $3,307,988 in 38 contractsfrom 2000 to 2006
Contracts for Winches, Hoists, Cranes, and Derricks, Motor Vehicle Maintenance and Repair Shop Specialized Equipment, Conveyors, Camouflage and Deception Equipment by Army, Defense Logistics Agency Signed by year:2000: $158,651; 2001: $758,478; 2002: $554,901; 2003: $773,801; 2004: $775,827; 2005: $99,354; 2006: $186,976.
Biggest contracts:
$329,011 with Army for Winches, Hoists, Cranes, and Derricks. Signed on 2001-03-01. Completion date: 2003-12-31.
$291,801, same as above.Signed on 2002-02-19. Completion date: 2003-12-31.
$257,521, same as above.Signed on 2004-10-13. Completion date: 2005-06-30.
$238,091, same as above.Signed on 2001-11-05. Completion date: 2003-12-31.
Top industries in this zip code by the number of employees in 2005:
Finance and Insurance: Commercial Banking (20-49 employees: 1 establishment)
Other Services (except Public Administration): Religious Organizations (10-19: 1, 1-4: 2)
Administrative and Support and Waste Management and Remediation Services: Janitorial Services (10-19: 1)
Administrative and Support and Waste Management and Remediation Services: Solid Waste Collection (10-19: 1)
Wholesale Trade: Recyclable Material Merchant Wholesalers (10-19: 1)
Fatal accident statistics in 2013:
Fatal accident count: 2
Vehicles involved in fatal accidents: 4
Fatal accidents caused by drunken drivers: 1
Fatalities: 2
Persons involved in fatal accidents: 5
Pedestrians involved in fatal accidents: 0
Fatal accident statistics in 2012:
Fatal accident count: 3
Vehicles involved in fatal accidents: 5
Fatal accidents caused by drunken drivers: 1
Fatalities: 3
Persons involved in fatal accidents: 5
Pedestrians involved in fatal accidents: 0
Home Mortgage Disclosure Act Aggregated Statistics For Year 2009 (Based on 4 partial tracts)
A) FHA, FSA/RHS & VA Home Purchase Loans
B) Conventional Home Purchase Loans
C) Refinancings
D) Home Improvement Loans
E) Loans on Dwellings For 5+ Families
F) Non-occupant Loans on < 5 Family Dwellings (A B C & D)
G) Loans On Manufactured Home Dwelling (A B C & D)
Number
Average Value
Number
Average Value
Number
Average Value
Number
Average Value
Number
Average Value
Number
Average Value
Number
Average Value
LOANS ORIGINATED
29
$136,147
47
$125,315
182
$125,260
33
$38,483
1
$220,350
17
$75,515
2
$103,485
APPLICATIONS APPROVED, NOT ACCEPTED
3
$59,260
1
$313,000
13
$137,502
3
$16,833
0
$0
0
$0
1
$51,330
APPLICATIONS DENIED
3
$132,147
3
$110,517
47
$119,971
5
$26,526
0
$0
2
$14,565
0
$0
APPLICATIONS WITHDRAWN
6
$124,620
4
$119,500
37
$136,548
4
$54,150
0
$0
1
$107,670
0
$0
FILES CLOSED FOR INCOMPLETENESS
3
$115,700
3
$151,303
8
$143,506
0
$0
0
$0
1
$56,300
0
$0
Aggregated Statistics For Year 2008 (Based on 4 partial tracts)
A) FHA, FSA/RHS & VA Home Purchase Loans
B) Conventional Home Purchase Loans
C) Refinancings
D) Home Improvement Loans
E) Loans on Dwellings For 5+ Families
F) Non-occupant Loans on < 5 Family Dwellings (A B C & D)
G) Loans On Manufactured Home Dwelling (A B C & D)
Number
Average Value
Number
Average Value
Number
Average Value
Number
Average Value
Number
Average Value
Number
Average Value
Number
Average Value
LOANS ORIGINATED
14
$129,726
55
$105,020
124
$139,339
17
$24,277
1
$225,360
9
$63,028
4
$89,335
APPLICATIONS APPROVED, NOT ACCEPTED
0
$0
6
$124,405
18
$134,841
2
$32,345
0
$0
0
$0
1
$31,720
APPLICATIONS DENIED
1
$118,950
7
$61,301
42
$127,050
16
$40,592
0
$0
3
$25,457
5
$60,110
APPLICATIONS WITHDRAWN
2
$108,155
4
$131,882
18
$120,204
3
$84,940
0
$0
2
$81,680
0
$0
FILES CLOSED FOR INCOMPLETENESS
0
$0
0
$0
7
$159,557
0
$0
0
$0
0
$0
0
$0
Aggregated Statistics For Year 2007 (Based on 4 partial tracts)
A) FHA, FSA/RHS & VA Home Purchase Loans
B) Conventional Home Purchase Loans
C) Refinancings
D) Home Improvement Loans
E) Loans on Dwellings For 5+ Families
F) Non-occupant Loans on < 5 Family Dwellings (A B C & D)
G) Loans On Manufactured Home Dwelling (A B C & D)
Number
Average Value
Number
Average Value
Number
Average Value
Number
Average Value
Number
Average Value
Number
Average Value
Number
Average Value
LOANS ORIGINATED
8
$124,589
76
$108,330
115
$125,457
44
$41,744
1
$150,240
16
$68,240
5
$99,814
APPLICATIONS APPROVED, NOT ACCEPTED
0
$0
8
$88,604
22
$139,664
6
$69,495
0
$0
0
$0
1
$70,580
APPLICATIONS DENIED
3
$129,460
23
$77,661
68
$88,858
15
$33,123
0
$0
3
$88,893
1
$40,440
APPLICATIONS WITHDRAWN
1
$88,820
9
$85,618
26
$134,374
1
$95,160
0
$0
3
$99,327
1
$28,550
FILES CLOSED FOR INCOMPLETENESS
0
$0
3
$79,293
8
$134,272
0
$0
0
$0
0
$0
0
$0
Aggregated Statistics For Year 2006 (Based on 4 partial tracts)
A) FHA, FSA/RHS & VA Home Purchase Loans
B) Conventional Home Purchase Loans
C) Refinancings
D) Home Improvement Loans
E) Loans on Dwellings For 5+ Families
F) Non-occupant Loans on < 5 Family Dwellings (A B C & D)
G) Loans On Manufactured Home Dwelling (A B C & D)
Number
Average Value
Number
Average Value
Number
Average Value
Number
Average Value
Number
Average Value
Number
Average Value
Number
Average Value
LOANS ORIGINATED
12
$91,978
108
$99,320
170
$87,291
49
$27,168
0
$0
11
$56,531
9
$48,446
APPLICATIONS APPROVED, NOT ACCEPTED
2
$73,430
10
$95,836
25
$101,792
7
$39,946
0
$0
1
$62,600
3
$11,267
APPLICATIONS DENIED
2
$129,260
13
$87,108
77
$105,873
20
$42,676
1
$82,470
5
$61,410
8
$44,092
APPLICATIONS WITHDRAWN
2
$105,920
13
$108,530
41
$115,452
3
$60,513
0
$0
2
$68,990
0
$0
FILES CLOSED FOR INCOMPLETENESS
0
$0
0
$0
14
$106,421
3
$30,047
0
$0
0
$0
0
$0
Aggregated Statistics For Year 2005 (Based on 4 partial tracts)
A) FHA, FSA/RHS & VA Home Purchase Loans
B) Conventional Home Purchase Loans
C) Refinancings
D) Home Improvement Loans
F) Non-occupant Loans on < 5 Family Dwellings (A B C & D)
G) Loans On Manufactured Home Dwelling (A B C & D)
Number
Average Value
Number
Average Value
Number
Average Value
Number
Average Value
Number
Average Value
Number
Average Value
LOANS ORIGINATED
4
$89,818
115
$96,638
152
$102,251
43
$21,738
15
$68,601
6
$50,228
APPLICATIONS APPROVED, NOT ACCEPTED
1
$39,650
9
$98,198
20
$90,973
2
$58,470
0
$0
0
$0
APPLICATIONS DENIED
0
$0
14
$67,158
61
$90,616
7
$76,540
0
$0
2
$62,290
APPLICATIONS WITHDRAWN
1
$99,920
17
$99,040
49
$97,748
4
$44,168
1
$39,650
1
$103,920
FILES CLOSED FOR INCOMPLETENESS
0
$0
6
$82,982
23
$112,987
0
$0
1
$67,610
0
$0
Aggregated Statistics For Year 2004 (Based on 4 partial tracts)
A) FHA, FSA/RHS & VA Home Purchase Loans
B) Conventional Home Purchase Loans
C) Refinancings
D) Home Improvement Loans
E) Loans on Dwellings For 5+ Families
F) Non-occupant Loans on < 5 Family Dwellings (A B C & D)
G) Loans On Manufactured Home Dwelling (A B C & D)
Number
Average Value
Number
Average Value
Number
Average Value
Number
Average Value
Number
Average Value
Number
Average Value
Number
Average Value
LOANS ORIGINATED
8
$78,191
81
$99,329
186
$87,041
41
$30,603
1
$343,050
20
$68,670
2
$120,445
APPLICATIONS APPROVED, NOT ACCEPTED
3
$68,860
14
$97,106
19
$87,146
3
$95,987
0
$0
2
$78,045
0
$0
APPLICATIONS DENIED
0
$0
9
$90,918
55
$99,408
12
$38,702
0
$0
3
$54,453
3
$70,047
APPLICATIONS WITHDRAWN
1
$82,630
14
$106,424
32
$110,965
7
$74,734
0
$0
0
$0
0
$0
FILES CLOSED FOR INCOMPLETENESS
0
$0
5
$113,766
17
$112,078
2
$19,260
0
$0
0
$0
0
$0
Aggregated Statistics For Year 2003 (Based on 4 partial tracts)
A) FHA, FSA/RHS & VA Home Purchase Loans
B) Conventional Home Purchase Loans
C) Refinancings
D) Home Improvement Loans
F) Non-occupant Loans on < 5 Family Dwellings (A B C & D)
Number
Average Value
Number
Average Value
Number
Average Value
Number
Average Value
Number
Average Value
LOANS ORIGINATED
7
$108,779
87
$116,769
310
$103,358
45
$24,958
15
$153,697
APPLICATIONS APPROVED, NOT ACCEPTED
0
$0
7
$104,871
26
$121,367
0
$0
0
$0
APPLICATIONS DENIED
0
$0
19
$108,720
70
$91,049
6
$33,458
0
$0
APPLICATIONS WITHDRAWN
3
$114,767
16
$126,966
50
$86,860
1
$19,820
2
$187,555
FILES CLOSED FOR INCOMPLETENESS
0
$0
5
$97,030
5
$109,678
0
$0
0
$0
Aggregated Statistics For Year 2002 (Based on 4 partial tracts)
A) FHA, FSA/RHS & VA Home Purchase Loans
B) Conventional Home Purchase Loans
C) Refinancings
D) Home Improvement Loans
E) Loans on Dwellings For 5+ Families
F) Non-occupant Loans on < 5 Family Dwellings (A B C & D)
Number
Average Value
Number
Average Value
Number
Average Value
Number
Average Value
Number
Average Value
Number
Average Value
LOANS ORIGINATED
6
$81,717
57
$84,634
203
$99,117
50
$23,142
1
$132,710
9
$59,434
APPLICATIONS APPROVED, NOT ACCEPTED
0
$0
4
$68,770
32
$95,258
3
$33,527
0
$0
1
$47,580
APPLICATIONS DENIED
2
$90,290
19
$60,398
51
$82,569
8
$58,438
0
$0
3
$31,300
APPLICATIONS WITHDRAWN
1
$30,930
5
$89,912
55
$103,204
5
$114,434
0
$0
3
$73,927
FILES CLOSED FOR INCOMPLETENESS
0
$0
1
$15,070
16
$93,294
0
$0
0
$0
1
$93,900
Aggregated Statistics For Year 2001 (Based on 4 partial tracts)
A) FHA, FSA/RHS & VA Home Purchase Loans
B) Conventional Home Purchase Loans
C) Refinancings
D) Home Improvement Loans
F) Non-occupant Loans on < 5 Family Dwellings (A B C & D)
Number
Average Value
Number
Average Value
Number
Average Value
Number
Average Value
Number
Average Value
LOANS ORIGINATED
13
$102,627
89
$93,847
189
$90,377
33
$17,191
12
$57,718
APPLICATIONS APPROVED, NOT ACCEPTED
1
$117,690
6
$81,420
16
$78,914
2
$11,895
1
$88,890
APPLICATIONS DENIED
1
$45,990
26
$67,354
68
$69,824
2
$16,840
2
$67,800
APPLICATIONS WITHDRAWN
2
$118,215
9
$81,469
38
$94,046
4
$35,412
0
$0
FILES CLOSED FOR INCOMPLETENESS
0
$0
3
$116,717
7
$68,790
0
$0
0
$0
Aggregated Statistics For Year 2000 (Based on 4 partial tracts)
A) FHA, FSA/RHS & VA Home Purchase Loans
B) Conventional Home Purchase Loans
C) Refinancings
D) Home Improvement Loans
F) Non-occupant Loans on < 5 Family Dwellings (A B C & D)
Number
Average Value
Number
Average Value
Number
Average Value
Number
Average Value
Number
Average Value
LOANS ORIGINATED
10
$73,460
80
$87,433
75
$74,380
40
$16,910
10
$64,675
APPLICATIONS APPROVED, NOT ACCEPTED
1
$102,660
5
$107,562
18
$73,502
1
$43,820
0
$0
APPLICATIONS DENIED
1
$108,920
22
$56,309
39
$69,699
6
$12,660
4
$63,980
APPLICATIONS WITHDRAWN
1
$57,100
6
$87,983
29
$74,134
3
$9,600
1
$25,040
FILES CLOSED FOR INCOMPLETENESS
0
$0
0
$0
4
$68,860
0
$0
0
$0
Aggregated Statistics For Year 1999 (Based on 2 partial tracts)
A) FHA, FSA/RHS & VA Home Purchase Loans
B) Conventional Home Purchase Loans
C) Refinancings
D) Home Improvement Loans
F) Non-occupant Loans on < 5 Family Dwellings (A B C & D)
Detailed PMIC statistics for the following Tracts:0101.00
, 0103.00
2002 - 2018 National Fire Incident Reporting System (NFIRS) incidents
According to the data from the years 2002 - 2018 the average number of fires per year is 9. The highest number of fires - 31 took place in 2003, and the least - 1 in 2007. The data has a decreasing trend.
When looking into fire subcategories, the most incidents belonged to: Outside Fires (44.4%), and Structure Fires (42.5%).
Fire incident types reported to NFIRS in Zip Code 52214


 Nearest zip codes: 52219, 52218, 52202, 52302, 52336, 52330.


 According to the data from the years 2002 - 2018 the average number of fires per year is 9. The highest number of fires - 31 took place in 2003, and the least - 1 in 2007. The data has a decreasing trend.
 When looking into fire subcategories, the most incidents belonged to: Outside Fires (44.4%), and Structure Fires (42.5%).