Estimated zip code population in 2022: 1,715 Zip code population in 2010: 1,788 Zip code population in 2000: 1,784
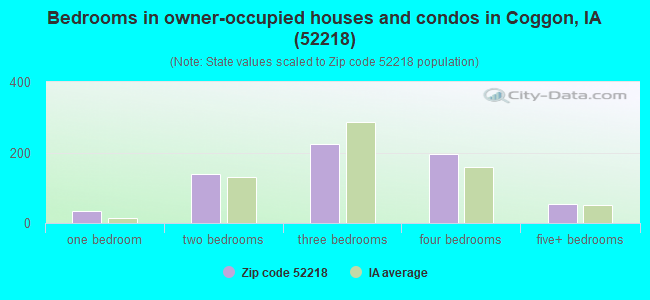
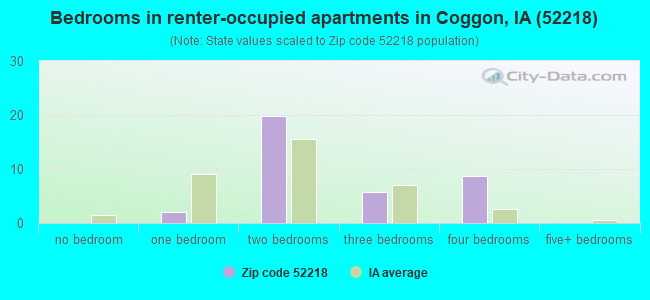
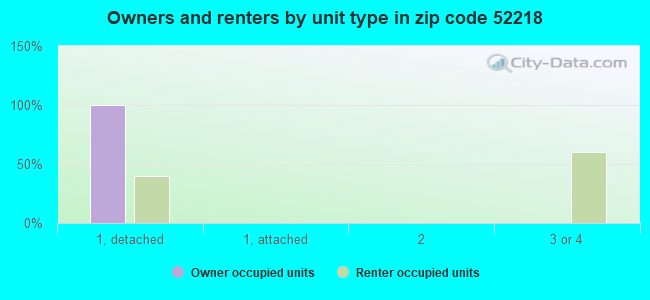
Houses and condos: 763 Renter-occupied apartments: 35
% of renters here:
5%
State:
28%
March 2022 cost of living index in zip code 52218: 81.6 (low, U.S. average is 100)
Land area: 72.0 sq. mi. Water area: 0.4 sq. mi.
Population density: 24 people per square mile
(very low).
OSM Map
General Map
Google Map
MSN Map
OSM Map
General Map
Google Map
MSN Map
OSM Map
General Map
Google Map
MSN Map
OSM Map
General Map
Google Map
MSN Map
Please wait while loading the map...
Real estate property taxes paid for housing units in 2022:
This zip code:
1.4% ($2,488)
Iowa:
1.4% ($2,724)
Median real estate property taxes paid for housing units with mortgages in 2022: $2,362 (1.2%) Median real estate property taxes paid for housing units with no mortgage in 2022: $2,771 (1.8%)
Business Search- 14 Million verified businesses
Males: 938
(54.7%)
Females: 777
(45.3%)
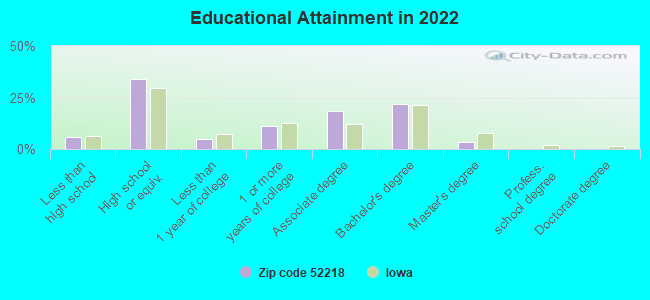
For population 25 years and over in 52218:
High school or higher: 93.2%
Bachelor's degree or higher: 25.0%
Graduate or professional degree: 3.4%
Unemployed: 0.5%
Mean travel time to work (commute): 34.9 minutes
For population 15 years and over in 52218:
Never married: 19.3%
Now married: 63.7%
Separated: 2.5%
Widowed: 3.4%
Divorced: 11.2%
Zip code 52218 compared to state average:
Unemployed percentage significantly below state average.
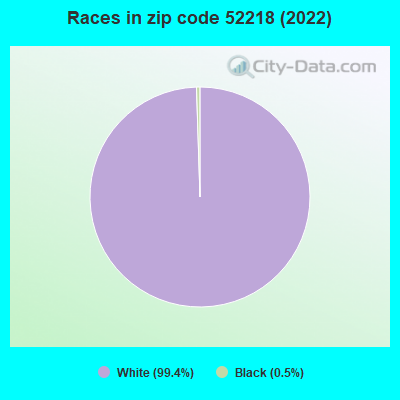
Black race population percentage significantly below state average.
Hispanic race population percentage significantly below state average.
Foreign-born population percentage significantly below state average.
Renting percentage significantly below state average.
Averages for the 2020 tax year for zip code 52218, filed in 2021:
Average Adjusted Gross Income (AGI) in 2020: $64,549 (Individual Income Tax Returns)
Here:
$64,549
State:
$71,087
Salary/wage: $56,555 (reported on 82.7% of returns)
Here:
$56,555
State:
$57,361
(% of AGI for various income ranges: 1240.8% for AGIs below $25k, 3851.7% for AGIs $25k-50k, 7012.0% for AGIs $50k-75k, 9128.6% for AGIs $75k-100k, 16130.0% for AGIs $100k-200k)
Taxable interest for individuals: $1,273 (reported on 44.0% of returns)
This zip code:
$1,273
Iowa:
$1,633
(% of AGI for various income ranges: 40.8% for AGIs below $25k, 42.5% for AGIs $25k-50k, 130.0% for AGIs $50k-75k, 30.0% for AGIs $75k-100k, 241.4% for AGIs $100k-200k)
Ordinary dividends: $2,215 (reported on 17.3% of returns)
Here:
$2,215
State:
$5,432
(% of AGI for various income ranges: 27.5% for AGIs $25k-50k, 127.0% for AGIs $50k-75k, 71.4% for AGIs $75k-100k, 111.4% for AGIs $100k-200k)
Net capital gain/loss in AGI: +$7,785 (reported on 17.3% of returns)
Here:
+$7,785
State:
+$15,243
(% of AGI for various income ranges: 47.5% for AGIs below $25k, 37.0% for AGIs $50k-75k, 164.3% for AGIs $75k-100k, 1147.1% for AGIs $100k-200k)
Profit/loss from business: +$12,075 (reported on 16.0% of returns)
Here:
+$12,075
State:
+$11,763
(% of AGI for various income ranges: 150.8% for AGIs below $25k, 197.5% for AGIs $25k-50k, 645.0% for AGIs $50k-75k, 551.4% for AGIs $100k-200k)
Taxable individual retirement arrangement distribution: $12,286 (reported on 9.3% of returns)
52218:
$12,286
Iowa:
$17,324
(% of AGI for various income ranges: 298.3% for AGIs $25k-50k, 717.1% for AGIs $75k-100k)
Total itemized deductions: $27,333 (reported on 4.0% of returns)
Here:
$27,333
State:
$33,775
(% of AGI for various income ranges: 683.3% for AGIs $25k-50k)
Taxes paid: $5,850 (reported on 2.7% of returns)
52218:
$5,850
State:
$7,704
(% of AGI for various income ranges: 97.5% for AGIs $25k-50k)
Earned income credit: $2,071 (reported on 9.3% of returns)
Here:
$2,071
State:
$2,195
(% of AGI for various income ranges: 68.3% for AGIs below $25k, 52.5% for AGIs $25k-50k)
Percentage of individuals using paid preparers for their 2020 taxes: 93.3%
Here:
93%
State:
95%
(% for various income ranges: 94.4% for AGIs below $25k, 94.1% for AGIs $25k-50k, 93.3% for AGIs $50k-75k, 90.0% for AGIs $75k-100k, 100.0% for AGIs $100k-200k, 66.7% for AGIs over 200k)
Averages for the 2012 tax year for zip code 52218, filed in 2013:
Average Adjusted Gross Income (AGI) in 2012: $53,097 (Individual Income Tax Returns)
Here:
$53,097
State:
$58,860
Salary/wage: $44,080 (reported on 81.9% of returns)
Here:
$44,080
State:
$46,659
(% of AGI for various income ranges: 68.3% for AGIs below $25k, 75.9% for AGIs $25k-50k, 80.4% for AGIs $50k-75k, 80.3% for AGIs $75k-100k, 51.1% for AGIs $100k-200k)
Taxable interest for individuals: $1,083 (reported on 48.6% of returns)
This zip code:
$1,083
Iowa:
$1,537
(% of AGI for various income ranges: 2.6% for AGIs below $25k, 1.0% for AGIs $25k-50k, 0.4% for AGIs $50k-75k, 0.6% for AGIs $75k-100k, 1.1% for AGIs $100k-200k)
Ordinary dividends: $1,569 (reported on 22.2% of returns)
Here:
$1,569
State:
$4,542
(% of AGI for various income ranges: 1.8% for AGIs below $25k, 0.8% for AGIs $25k-50k, 0.1% for AGIs $50k-75k, 0.9% for AGIs $75k-100k, 0.5% for AGIs $100k-200k)
Net capital gain/loss in AGI: +$5,138 (reported on 18.1% of returns)
Here:
+$5,138
State:
+$11,802
(% of AGI for various income ranges: 1.2% for AGIs below $25k, 1.0% for AGIs $25k-50k, 1.8% for AGIs $50k-75k, 3.2% for AGIs $100k-200k)
Profit/loss from business: +$7,327 (reported on 15.3% of returns)
Here:
+$7,327
State:
+$10,509
(% of AGI for various income ranges: 7.0% for AGIs below $25k, 3.1% for AGIs $25k-50k, 3.3% for AGIs $50k-75k, 1.0% for AGIs $100k-200k)
Taxable individual retirement arrangement distribution: $6,683 (reported on 8.3% of returns)
52218:
$6,683
Iowa:
$11,773
Total itemized deductions: $17,881 (21% of AGI, reported on 29.2% of returns)
Here:
$17,881
State:
$21,278
Here:
21.0% of AGI
State:
18.9% of AGI
(% of AGI for various income ranges: 10.4% for AGIs below $25k, 7.3% for AGIs $25k-50k, 7.5% for AGIs $50k-75k, 13.5% for AGIs $75k-100k, 10.1% for AGIs $100k-200k)
Charity contributions: $2,453 (reported on 20.8% of returns)
Here:
$2,453
State:
$4,044
(% of AGI for various income ranges: 0.9% for AGIs $25k-50k, 0.5% for AGIs $50k-75k, 0.8% for AGIs $75k-100k, 1.5% for AGIs $100k-200k)
Taxes paid: $6,290 (reported on 29.2% of returns)
52218:
$6,290
State:
$8,846
(% of AGI for various income ranges: 2.2% for AGIs below $25k, 1.7% for AGIs $25k-50k, 2.2% for AGIs $50k-75k, 4.2% for AGIs $75k-100k, 4.9% for AGIs $100k-200k)
Earned income credit: $2,011 (reported on 12.5% of returns)
Here:
$2,011
State:
$2,098
(% of AGI for various income ranges: 3.8% for AGIs below $25k, 0.9% for AGIs $25k-50k)
Percentage of individuals using paid preparers for their 2012 taxes: 69.4%
Here:
69%
State:
65%
(% for various income ranges: 64.0% for AGIs below $25k, 72.2% for AGIs $25k-50k, 63.6% for AGIs $50k-75k, 77.8% for AGIs $75k-100k, 77.8% for AGIs $100k-200k)
Averages for the 2004 tax year for zip code 52218, filed in 2005:
Average Adjusted Gross Income (AGI) in 2004: $35,785 (Individual Income Tax Returns)
Here:
$35,785
State:
$43,875
Salary/wage: $34,899 (reported on 81.9% of returns)
Here:
$34,899
State:
$38,265
(% of AGI for various income ranges: 197.8% for AGIs below $10k, 58.6% for AGIs $10k-25k, 76.7% for AGIs $25k-50k, 81.6% for AGIs $50k-75k, 88.8% for AGIs $75k-100k, 73.9% for AGIs over 100k)
Taxable interest for individuals: $1,371 (reported on 50.6% of returns)
This zip code:
$1,371
Iowa:
$1,768
(% of AGI for various income ranges: 9.2% for AGIs below $10k, 6.7% for AGIs $10k-25k, 2.3% for AGIs $25k-50k, 1.2% for AGIs $50k-75k, 0.3% for AGIs $75k-100k, 0.4% for AGIs over 100k)
Taxable dividends: $868 (reported on 26.6% of returns)
Here:
$868
State:
$2,510
(% of AGI for various income ranges: 8.0% for AGIs below $10k, 1.3% for AGIs $10k-25k, 0.7% for AGIs $25k-50k, 0.6% for AGIs $50k-75k, 0.1% for AGIs $75k-100k)
Net capital gain/loss: +$2,954 (reported on 21.2% of returns)
Here:
+$2,954
State:
+$6,139
(% of AGI for various income ranges: 5.8% for AGIs below $10k, 2.3% for AGIs $10k-25k, 2.7% for AGIs $25k-50k, 1.8% for AGIs $50k-75k, 0.6% for AGIs $75k-100k)
Profit/loss from business: +$6,369 (reported on 15.6% of returns)
Here:
+$6,369
State:
+$8,574
(% of AGI for various income ranges: -15.4% for AGIs below $10k, 9.3% for AGIs $10k-25k, 3.4% for AGIs $25k-50k, 3.3% for AGIs $50k-75k)
Profit/loss from farming: +$4,814 (reported on 13.6% of returns)
Here:
+$4,814
State:
-$74
(% of AGI for various income ranges: -43.7% for AGIs below $10k, 3.4% for AGIs $10k-25k, 3.1% for AGIs $25k-50k, 3.9% for AGIs $50k-75k, -0.6% for AGIs $75k-100k)
IRA payment deduction: $2,944 (reported on 2.5% of returns)
52218:
$2,944
Iowa:
$2,970
Total itemized deductions: $14,301 (25% of AGI, reported on 27.5% of returns)
Here:
$14,301
State:
$16,976
Here:
24.6% of AGI
State:
20.8% of AGI
(% of AGI for various income ranges: 14.1% for AGIs $10k-25k, 7.6% for AGIs $25k-50k, 10.5% for AGIs $50k-75k, 14.2% for AGIs $75k-100k, 14.3% for AGIs over 100k)
Charity contributions deductions: $1,894 (3% of AGI, reported on 22.6% of returns)
Here:
$1,894
State:
$3,089
Here:
3.1% of AGI
State:
3.6% of AGI
(% of AGI for various income ranges: 0.7% for AGIs $10k-25k, 0.9% for AGIs $25k-50k, 1.1% for AGIs $50k-75k, 1.4% for AGIs $75k-100k, 2.6% for AGIs over 100k)
Total tax: $3,746 (reported on 76.9% of returns)
52218:
$3,746
State:
$6,177
(% of AGI for various income ranges: 6.5% for AGIs below $10k, 4.6% for AGIs $10k-25k, 6.7% for AGIs $25k-50k, 7.9% for AGIs $50k-75k, 9.6% for AGIs $75k-100k, 13.2% for AGIs over 100k)
Earned income credit: $1,649 (reported on 10.8% of returns)
Here:
$1,649
State:
$1,540
Percentage of individuals using paid preparers for their 2004 taxes: 72.5%
Here:
73%
State:
70%
(% for various income ranges: 54.2% for AGIs below $10k, 79.1% for AGIs $10k-25k, 76.9% for AGIs $25k-50k, 78.4% for AGIs $50k-75k, 75.9% for AGIs $75k-100k, 57.9% for AGIs over 100k)
Household received Food Stamps/SNAP in the past 12 months: 27 Household did not receive Food Stamps/SNAP in the past 12 months: 649
Women who had a birth in the past 12 months: 13 (13 now married, 0 unmarried) Women who did not have a birth in the past 12 months: 290 (161 now married, 129 unmarried)
Housing units in zip code 52218 with a mortgage: 435 (52 second mortgage, 53 both second mortgage and home equity loan) Houses without a mortgage: 3
Median monthly owner costs for units with a mortgage: $1,414 Median monthly owner costs for units without a mortgage: $594
Residents with income below the poverty level in 2022:
This zip code:
2.1%
Whole state:
11.0%
Residents with income below 50% of the poverty level in 2022:
This zip code:
0.3%
Whole state:
5.5%
Median number of rooms in houses and condos:
Here:
6.4
State:
6.8
Median number of rooms in apartments:
Here:
6.1
State:
4.2
Notable locations in this zip code not listed on our city pages
Notable locations in zip code 52218: Coggon (A), Newtonville (B), Valley Farm (C), Coggon Police Department (D), Coggon Fire Department (E), Coggon City Town Hall (F), Coggon Public Library (G), Troy Mills Volunteer Fire Department (H). Display/hide their locations on the map
Churches in zip code 52218 include: Zion Presbyterian Church (A), United Parish (B), Saint John's Catholic Church (C), Calvary Baptist Church (D), Spring Grove Church (E). Display/hide their locations on the map
Cemeteries: Nugents Grove Cemetery (1), Saint Johns Cemetery (2), Saint Patricks Cemetery (3), Coggon Cemetery (4), Spring Grove Cemetery (5), Upper Spring Grove Cemetery (6). Display/hide their locations on the map
Size of family households: 223 2-persons, 101 3-persons, 55 4-persons, 48 5-persons, 58 6-persons
Size of nonfamily households: 142 1-person, 35 2-persons, 6 3-persons
309 married couples with children.
135 single-parent households (9 men, 126 women).
98.1% of residents of 52218 zip code speak English at home.
1.5% of residents speak Spanish at home (100% very well).
0.2% of residents speak other Indo-European language at home (100% very well).
Foreign born population: 2 (0.1%) (50.9% of them are naturalized citizens)
This zip code:
0.1%
Whole state:
6.0%
50%Serbia
44%German
14%Irish
10%American
7%Czech
4%English
4%Italian
3%Russian
Year of entry for the foreign-born population
12010 or later
02000 to 2009
01990 to 1999
0Before 1990
Facilities with environmental interests located in this zip code:
COGGON ELEMENTARY CENTER (408 E. LINN ST in COGGON, IA)
(National Center for Education Statistics) - STATE ID-574777 409 Organizations: NORTH LINN COMMUNITY SCHOOL DIST. (SCHOOL DISTRICT)
COGGON CITY OF STP (CITY CLERK, CITY HALL in COGGON, IA)
National Pollutant Discharge Elimination System NON-MAJOR (Tracking pollutant discharge elimination systems) - permit Business SIC classification: SEWERAGE SYSTEMS Organizations: CITY OF COGGON (CONTACT/OWNER)
COGGON MUNICIPAL UTILITIES (131 W. MAIN in COGGON, IA)
AIR SYNTHETIC MINOR (AIRS/AFS) AIR PROGRAM (Clean Air Markets Division Business System) COMPLIANCE ACTIVITY (Tracking inspections of insecticide, fungicide, and rodenticide, and toxic substances) Business SIC classification: ELECTRIC SERVICES Alternative names: COGGON MUNICIPAL LIGHT PLANT
BUFFALO BAY GRAIN (108 SOUTH RAILROAD in COGGON, IA)
AIR MINOR (AIRS/AFS) Business SIC classification: GRAIN AND FIELD BEANS
BUFFALO OIL & AUTO BODY (527 3RD STREET SOUTH in COGGON, IA)
AIR MINOR (AIRS/AFS) Business SIC classification: NONCLASSIFIABLE ESTABLISHMENTS
CUSTOM WOOD PRODUCTS (202 EAST LINN in COGGON, IA)
AIR MINOR (AIRS/AFS) Business SIC classification: WOOD KITCHEN CABINETS
NORTH LINN C S D (3033 LYNX in COGGON, IA)
COMPLIANCE ACTIVITY (Tracking inspections of insecticide, fungicide, and rodenticide, and toxic substances) Alternative names: NORTH LINN COMM SCHOOL DST
PHIL'S HOMETOWN TIRE & OIL (200 N RAILROAD ST. in COGGON, IA)
AIR MINOR (AIRS/AFS) Business SIC classification: GENERAL AUTOMOTIVE REPAIR SHOPS
COGGON CREAMERY (RAILROAD ST in COGGON, IA)
SUPERFUND (Superfund database) Alternative names: CARSON GRAIN
NORTH LINN C S D (IEA) (3033 LYNN DR in COGGON, IA)
COMPLIANCE ACTIVITY (Tracking inspections of insecticide, fungicide, and rodenticide, and toxic substances)
Housing units lacking complete plumbing facilities: 3.0% Housing units lacking complete kitchen facilities: 3.0%
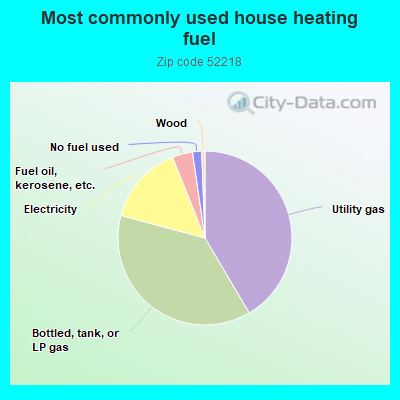
41.7%Utility gas
37.8%Bottled, tank, or LP gas
14.8%Electricity
3.8%Fuel oil, kerosene, etc.
1.7%No fuel used
0.6%Wood
Population in 1990: 1,053. Population change in the 1990s: +731 (+69.4%).
Place of birth for U.S.-born residents:
This state: 1,485
Northeast: 5
Midwest: 173
South: 26
West: 20
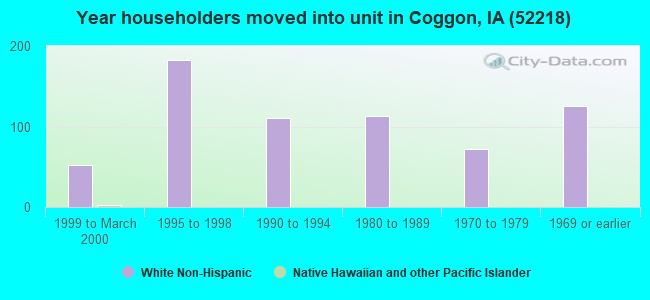
66% of the 52218 zip code residents lived in the same house 5 years ago. Out of people who lived in different houses, 54% lived in this county. Out of people who lived in different counties, 50% lived in Iowa.
87% of the 52218 zip code residents lived in the same house 1 year ago. Out of people who lived in different houses, 65% moved from this county. Out of people who lived in different houses, 28% moved from different county within same state. Out of people who lived in different houses, 3% moved from different state.
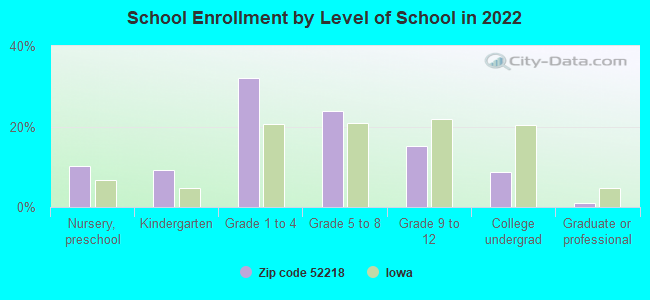
Private vs. public school enrollment:
Students in private schools in grades 1 to 8 (elementary and middle school):
Here:
0.0%
Iowa:
10.6%
Students in private schools in grades 9 to 12 (high school):
Here:
0.0%
Iowa:
7.9%
Students in private undergraduate colleges:
Here:
0.0%
Iowa:
23.9%
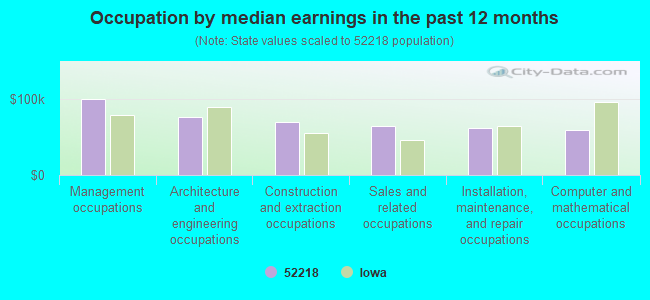
Occupation by median earnings in the past 12 months ($)
99,847Management occupations
75,561Architecture and engineering occupations
68,979Construction and extraction occupations
64,909Sales and related occupations
61,396Installation, maintenance, and repair occupations
59,676Computer and mathematical occupations
Top industries in this zip code by the number of employees in 2005:
Construction: New Single-Family Housing Construction (except Operative Builders) (5-9 employees: 1 establishment, 1-4 employees: 1 establishment)
Other Services (except Public Administration): Religious Organizations (1-4: 4)
Finance and Insurance: Commercial Banking (5-9: 1)
Accommodation and Food Services: Recreational and Vacation Camps (except Campgrounds) (5-9: 1)
Administrative and Support and Waste Management and Remediation Services: Landscaping Services (1-4: 2)
Wholesale Trade: Grain and Field Bean Merchant Wholesalers (1-4: 1)
Accommodation and Food Services: Full-Service Restaurants (1-4: 1)
Home Mortgage Disclosure Act Aggregated Statistics For Year 2009 (Based on 2 partial tracts)
A) FHA, FSA/RHS & VA Home Purchase Loans
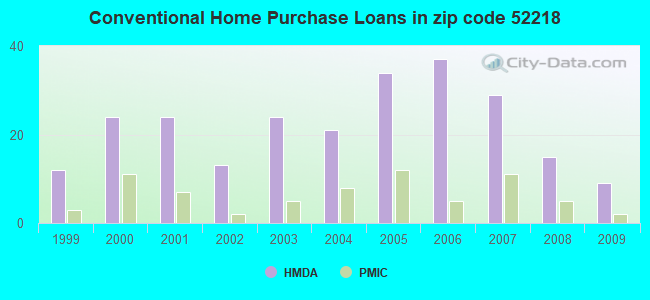
B) Conventional Home Purchase Loans
C) Refinancings
D) Home Improvement Loans
F) Non-occupant Loans on < 5 Family Dwellings (A B C & D)
G) Loans On Manufactured Home Dwelling (A B C & D)
Number
Average Value
Number
Average Value
Number
Average Value
Number
Average Value
Number
Average Value
Number
Average Value
LOANS ORIGINATED
12
$149,112
9
$135,792
55
$123,800
7
$64,369
2
$186,790
2
$99,495
APPLICATIONS APPROVED, NOT ACCEPTED
0
$0
0
$0
4
$127,512
2
$15,250
0
$0
0
$0
APPLICATIONS DENIED
2
$91,870
2
$93,775
10
$130,447
2
$19,820
1
$1,520
0
$0
APPLICATIONS WITHDRAWN
2
$134,945
3
$118,680
11
$150,609
0
$0
0
$0
0
$0
FILES CLOSED FOR INCOMPLETENESS
1
$101,400
1
$163,150
1
$54,130
0
$0
1
$54,130
0
$0
Aggregated Statistics For Year 2008 (Based on 2 partial tracts)
A) FHA, FSA/RHS & VA Home Purchase Loans
B) Conventional Home Purchase Loans
C) Refinancings
D) Home Improvement Loans
F) Non-occupant Loans on < 5 Family Dwellings (A B C & D)
G) Loans On Manufactured Home Dwelling (A B C & D)
Number
Average Value
Number
Average Value
Number
Average Value
Number
Average Value
Number
Average Value
Number
Average Value
LOANS ORIGINATED
5
$136,164
15
$124,983
39
$120,811
5
$23,024
2
$71,665
2
$132,660
APPLICATIONS APPROVED, NOT ACCEPTED
0
$0
3
$100,383
6
$156,800
1
$38,120
0
$0
1
$30,500
APPLICATIONS DENIED
1
$114,360
2
$33,545
16
$86,294
3
$60,483
1
$22,870
5
$57,790
APPLICATIONS WITHDRAWN
1
$58,700
2
$95,300
7
$89,963
1
$3,050
2
$78,525
0
$0
FILES CLOSED FOR INCOMPLETENESS
0
$0
0
$0
3
$108,770
0
$0
0
$0
0
$0
Aggregated Statistics For Year 2007 (Based on 2 partial tracts)
A) FHA, FSA/RHS & VA Home Purchase Loans
B) Conventional Home Purchase Loans
C) Refinancings
D) Home Improvement Loans
F) Non-occupant Loans on < 5 Family Dwellings (A B C & D)
G) Loans On Manufactured Home Dwelling (A B C & D)
Number
Average Value
Number
Average Value
Number
Average Value
Number
Average Value
Number
Average Value
Number
Average Value
LOANS ORIGINATED
3
$131,640
29
$107,209
27
$126,191
18
$47,481
3
$63,027
2
$141,805
APPLICATIONS APPROVED, NOT ACCEPTED
0
$0
4
$77,382
5
$80,204
3
$58,197
0
$0
1
$67,850
APPLICATIONS DENIED
2
$77,765
3
$73,700
15
$92,454
1
$19,060
0
$0
1
$38,880
APPLICATIONS WITHDRAWN
1
$85,390
5
$78,832
5
$145,770
1
$91,490
0
$0
1
$27,450
FILES CLOSED FOR INCOMPLETENESS
0
$0
0
$0
2
$49,935
0
$0
0
$0
0
$0
Aggregated Statistics For Year 2006 (Based on 2 partial tracts)
A) FHA, FSA/RHS & VA Home Purchase Loans
B) Conventional Home Purchase Loans
C) Refinancings
D) Home Improvement Loans
E) Loans on Dwellings For 5+ Families
F) Non-occupant Loans on < 5 Family Dwellings (A B C & D)
G) Loans On Manufactured Home Dwelling (A B C & D)
Number
Average Value
Number
Average Value
Number
Average Value
Number
Average Value
Number
Average Value
Number
Average Value
Number
Average Value
LOANS ORIGINATED
3
$89,710
37
$104,902
57
$86,700
17
$25,652
0
$0
3
$35,580
5
$47,726
APPLICATIONS APPROVED, NOT ACCEPTED
1
$38,880
5
$92,556
8
$152,956
2
$26,685
0
$0
0
$0
0
$0
APPLICATIONS DENIED
2
$124,270
3
$82,847
33
$118,449
5
$74,562
1
$79,290
2
$85,010
2
$56,420
APPLICATIONS WITHDRAWN
1
$64,040
4
$139,900
13
$108,495
0
$0
0
$0
2
$66,330
0
$0
FILES CLOSED FOR INCOMPLETENESS
0
$0
0
$0
8
$83,959
0
$0
0
$0
0
$0
0
$0
Aggregated Statistics For Year 2005 (Based on 2 partial tracts)
A) FHA, FSA/RHS & VA Home Purchase Loans
B) Conventional Home Purchase Loans
C) Refinancings
D) Home Improvement Loans
F) Non-occupant Loans on < 5 Family Dwellings (A B C & D)
G) Loans On Manufactured Home Dwelling (A B C & D)
Number
Average Value
Number
Average Value
Number
Average Value
Number
Average Value
Number
Average Value
Number
Average Value
LOANS ORIGINATED
3
$97,080
34
$95,322
50
$100,576
9
$27,362
4
$111,310
3
$32,783
APPLICATIONS APPROVED, NOT ACCEPTED
1
$38,120
3
$133,167
7
$94,101
1
$82,340
0
$0
0
$0
APPLICATIONS DENIED
0
$0
6
$82,847
23
$94,306
1
$85,390
0
$0
1
$57,180
APPLICATIONS WITHDRAWN
1
$96,060
5
$84,932
16
$109,881
2
$56,035
1
$38,120
0
$0
FILES CLOSED FOR INCOMPLETENESS
0
$0
1
$83,860
4
$122,365
0
$0
0
$0
0
$0
Aggregated Statistics For Year 2004 (Based on 2 partial tracts)
A) FHA, FSA/RHS & VA Home Purchase Loans
B) Conventional Home Purchase Loans
C) Refinancings
D) Home Improvement Loans
F) Non-occupant Loans on < 5 Family Dwellings (A B C & D)
G) Loans On Manufactured Home Dwelling (A B C & D)
Number
Average Value
Number
Average Value
Number
Average Value
Number
Average Value
Number
Average Value
Number
Average Value
LOANS ORIGINATED
4
$76,620
21
$94,647
56
$87,526
11
$57,249
8
$67,854
1
$82,340
APPLICATIONS APPROVED, NOT ACCEPTED
0
$0
3
$90,217
2
$51,460
0
$0
1
$38,120
0
$0
APPLICATIONS DENIED
0
$0
5
$87,524
13
$86,386
5
$30,800
3
$52,350
3
$67,347
APPLICATIONS WITHDRAWN
0
$0
6
$118,172
14
$95,191
2
$55,275
0
$0
0
$0
FILES CLOSED FOR INCOMPLETENESS
0
$0
1
$99,110
3
$146,380
1
$12,960
0
$0
0
$0
Aggregated Statistics For Year 2003 (Based on 2 partial tracts)
A) FHA, FSA/RHS & VA Home Purchase Loans
B) Conventional Home Purchase Loans
C) Refinancings
D) Home Improvement Loans
F) Non-occupant Loans on < 5 Family Dwellings (A B C & D)
Number
Average Value
Number
Average Value
Number
Average Value
Number
Average Value
Number
Average Value
LOANS ORIGINATED
2
$127,700
24
$115,059
98
$110,921
8
$18,965
4
$66,330
APPLICATIONS APPROVED, NOT ACCEPTED
0
$0
1
$76,240
3
$121,730
0
$0
0
$0
APPLICATIONS DENIED
0
$0
5
$107,346
24
$88,851
3
$33,037
0
$0
APPLICATIONS WITHDRAWN
0
$0
4
$109,405
21
$84,880
1
$19,060
1
$100,640
FILES CLOSED FOR INCOMPLETENESS
0
$0
2
$17,155
1
$114,360
0
$0
0
$0
Aggregated Statistics For Year 2002 (Based on 2 partial tracts)
A) FHA, FSA/RHS & VA Home Purchase Loans
B) Conventional Home Purchase Loans
C) Refinancings
D) Home Improvement Loans
F) Non-occupant Loans on < 5 Family Dwellings (A B C & D)
Number
Average Value
Number
Average Value
Number
Average Value
Number
Average Value
Number
Average Value
LOANS ORIGINATED
2
$107,500
13
$93,717
63
$99,160
11
$22,456
4
$48,222
APPLICATIONS APPROVED, NOT ACCEPTED
0
$0
2
$72,045
11
$104,033
2
$38,120
1
$45,740
APPLICATIONS DENIED
1
$55,660
2
$88,820
18
$91,912
2
$6,860
0
$0
APPLICATIONS WITHDRAWN
1
$29,730
2
$71,665
24
$96,031
1
$22,870
1
$57,940
FILES CLOSED FOR INCOMPLETENESS
0
$0
1
$14,490
3
$110,040
0
$0
0
$0
Aggregated Statistics For Year 2001 (Based on 2 partial tracts)
A) FHA, FSA/RHS & VA Home Purchase Loans
B) Conventional Home Purchase Loans
C) Refinancings
D) Home Improvement Loans
F) Non-occupant Loans on < 5 Family Dwellings (A B C & D)
Number
Average Value
Number
Average Value
Number
Average Value
Number
Average Value
Number
Average Value
LOANS ORIGINATED
3
$86,913
24
$104,480
47
$91,715
6
$14,867
2
$43,455
APPLICATIONS APPROVED, NOT ACCEPTED
0
$0
3
$108,007
5
$58,858
2
$11,435
0
$0
APPLICATIONS DENIED
1
$44,220
7
$43,457
27
$57,660
1
$2,290
2
$65,185
APPLICATIONS WITHDRAWN
1
$64,800
2
$46,125
8
$82,816
2
$63,280
0
$0
FILES CLOSED FOR INCOMPLETENESS
0
$0
1
$60,990
2
$61,755
0
$0
0
$0
Aggregated Statistics For Year 2000 (Based on 2 partial tracts)
A) FHA, FSA/RHS & VA Home Purchase Loans
B) Conventional Home Purchase Loans
C) Refinancings
D) Home Improvement Loans
F) Non-occupant Loans on < 5 Family Dwellings (A B C & D)
Number
Average Value
Number
Average Value
Number
Average Value
Number
Average Value
Number
Average Value
LOANS ORIGINATED
2
$67,855
24
$93,775
23
$76,704
10
$12,427
2
$20,205
APPLICATIONS APPROVED, NOT ACCEPTED
0
$0
4
$92,250
6
$104,068
0
$0
0
$0
APPLICATIONS DENIED
0
$0
7
$43,239
16
$76,145
2
$19,060
2
$75,480
APPLICATIONS WITHDRAWN
1
$54,890
2
$114,740
8
$67,281
0
$0
0
$0
FILES CLOSED FOR INCOMPLETENESS
0
$0
0
$0
0
$0
0
$0
0
$0
Aggregated Statistics For Year 1999 (Based on 1 partial tract)
A) FHA, FSA/RHS & VA Home Purchase Loans
B) Conventional Home Purchase Loans
C) Refinancings
D) Home Improvement Loans
F) Non-occupant Loans on < 5 Family Dwellings (A B C & D)
Detailed PMIC statistics for the following Tracts:0101.00
2002 - 2018 National Fire Incident Reporting System (NFIRS) incidents
Based on the data from the years 2002 - 2018 the average number of fire incidents per year is 10. The highest number of fires - 22 took place in 2014, and the least - 1 in 2002. The data has a rising trend.
When looking into fire subcategories, the most reports belonged to: Outside Fires (53.6%), and Structure Fires (35.1%).
Fire incident types reported to NFIRS in Zip Code 52218


+$4,814
-$74
(% of AGI for various income ranges: -43.7% for AGIs below $10k, 3.4% for AGIs $10k-25k, 3.1% for AGIs $25k-50k, 3.9% for AGIs $50k-75k, -0.6% for AGIs $75k-100k)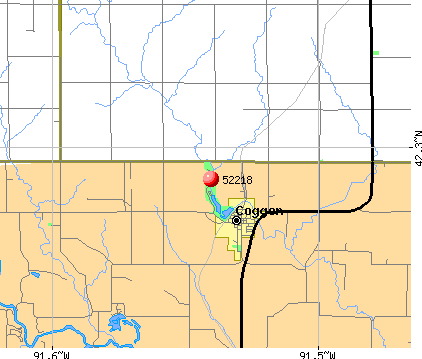 Nearest zip codes: 52330, 52214, 52219, 52202, 52057, 50682.
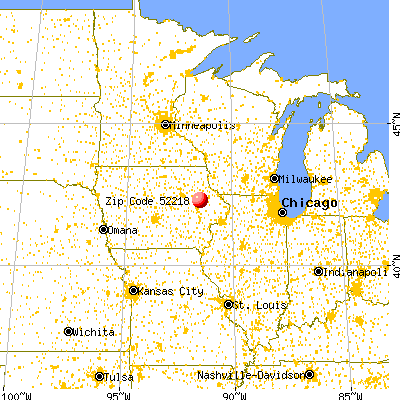


 Based on the data from the years 2002 - 2018 the average number of fire incidents per year is 10. The highest number of fires - 22 took place in 2014, and the least - 1 in 2002. The data has a rising trend.
 When looking into fire subcategories, the most reports belonged to: Outside Fires (53.6%), and Structure Fires (35.1%).