Estimated zip code population in 2022: 2,146 Zip code population in 2010: 1,890 Zip code population in 2000: 1,451
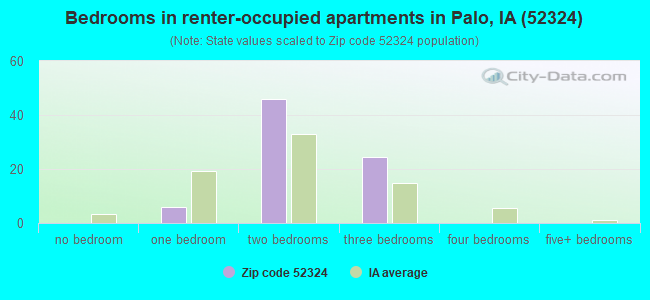
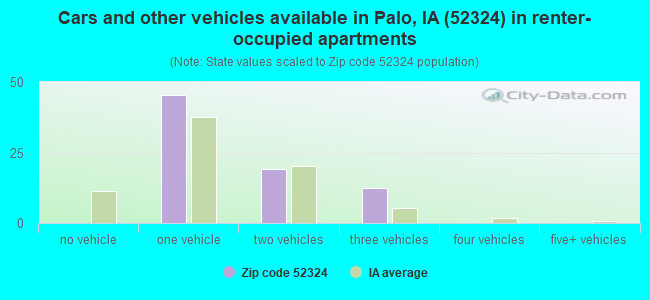
Houses and condos: 804 Renter-occupied apartments: 77
% of renters here:
9%
State:
28%
March 2022 cost of living index in zip code 52324: 83.6 (less than average, U.S. average is 100)
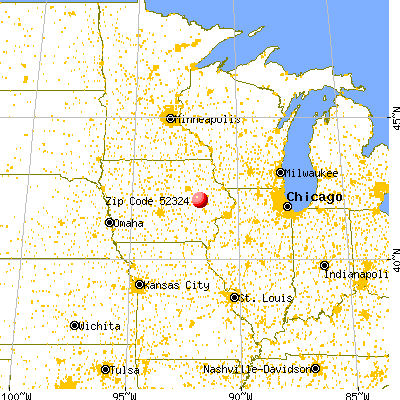
Land area: 40.1 sq. mi. Water area: 1.2 sq. mi.
Population density: 53 people per square mile
(very low).
OSM Map
General Map
Google Map
MSN Map
OSM Map
General Map
Google Map
MSN Map
OSM Map
General Map
Google Map
MSN Map
OSM Map
General Map
Google Map
MSN Map
Please wait while loading the map...
Real estate property taxes paid for housing units in 2022:
This zip code:
1.3% ($4,301)
Iowa:
1.4% ($2,724)
Median real estate property taxes paid for housing units with mortgages in 2022: $4,401 (1.3%) Median real estate property taxes paid for housing units with no mortgage in 2022: $3,242 (1.2%)
Business Search- 14 Million verified businesses
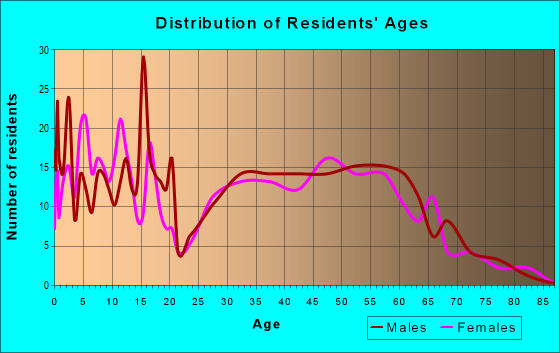
Males: 1,158
(54.0%)
Females: 988
(46.0%)
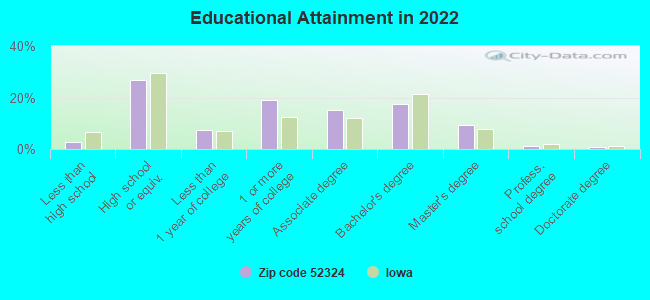
For population 25 years and over in 52324:
High school or higher: 97.8%
Bachelor's degree or higher: 28.8%
Graduate or professional degree: 11.2%
Unemployed: 1.9%
Mean travel time to work (commute): 23.2 minutes
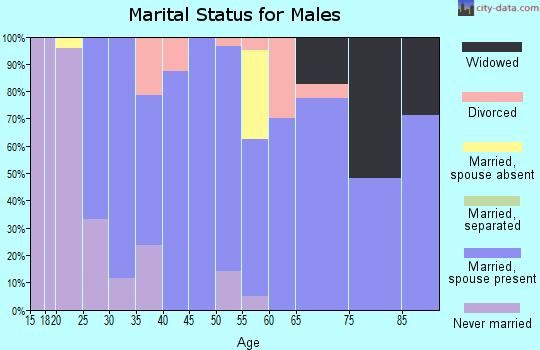
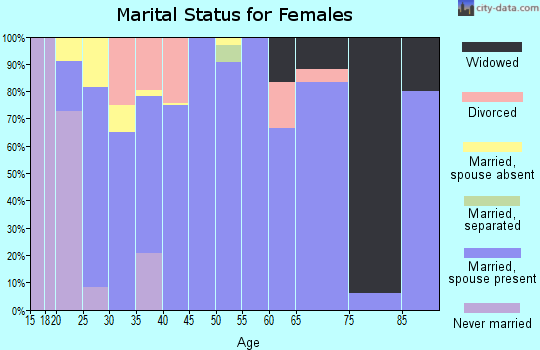
For population 15 years and over in 52324:
Never married: 22.5%
Now married: 69.2%
Separated: 0.1%
Widowed: 1.5%
Divorced: 6.7%
Zip code 52324 compared to state average:
Median household income above state average.
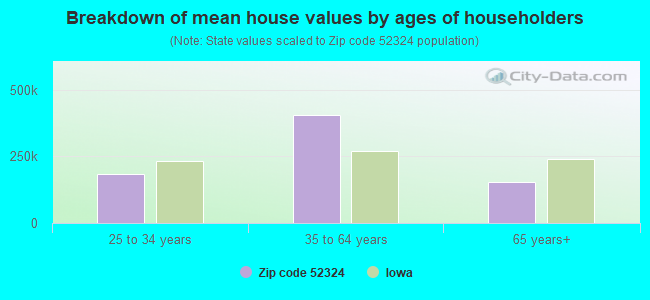
Median house value above state average.
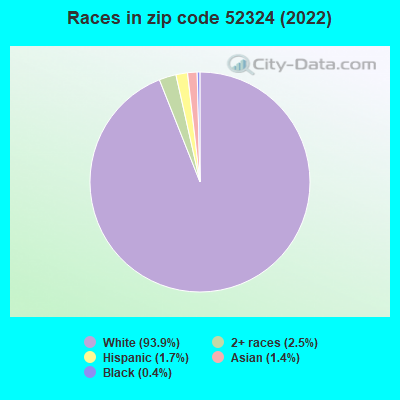
Black race population percentage significantly below state average.
Hispanic race population percentage significantly below state average.
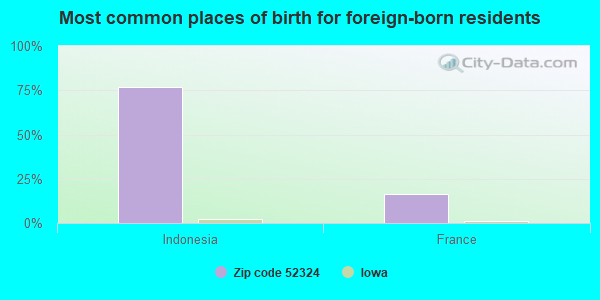
Foreign-born population percentage significantly below state average.
Renting percentage significantly below state average.
Estimated median house/condo value in 2022: $327,262
52324:
$327,262
Iowa:
$194,600
According to our research of Iowa and other state lists, there were 4 registered sex offenders living in 52324 zip code as of May 13, 2024. The ratio of all residents to sex offenders in zip code 52324 is 474 to 1. The ratio of registered sex offenders to all residents in this zip code is near the state average.
Median resident age:
This zip code:
38.0 years
Iowa median age:
38.9 years
Average household size:
This zip code:
2.6 people
Iowa:
2.3 people
Averages for the 2020 tax year for zip code 52324, filed in 2021:
Average Adjusted Gross Income (AGI) in 2020: $86,066 (Individual Income Tax Returns)
Here:
$86,066
State:
$71,087
Salary/wage: $77,948 (reported on 87.6% of returns)
Here:
$77,948
State:
$57,361
(% of AGI for various income ranges: 1324.7% for AGIs below $25k, 3391.8% for AGIs $25k-50k, 6361.5% for AGIs $50k-75k, 9575.8% for AGIs $75k-100k, 17978.2% for AGIs $100k-200k, 50096.7% for AGIs over 200k)
Taxable interest for individuals: $1,098 (reported on 43.0% of returns)
This zip code:
$1,098
Iowa:
$1,633
(% of AGI for various income ranges: 28.9% for AGIs below $25k, 36.5% for AGIs $25k-50k, 24.6% for AGIs $50k-75k, 80.0% for AGIs $75k-100k, 111.8% for AGIs $100k-200k, 266.7% for AGIs over 200k)
Ordinary dividends: $2,635 (reported on 21.5% of returns)
Here:
$2,635
State:
$5,432
(% of AGI for various income ranges: 9.5% for AGIs below $25k, 54.1% for AGIs $25k-50k, 143.1% for AGIs $50k-75k, 50.0% for AGIs $75k-100k, 120.5% for AGIs $100k-200k, 213.3% for AGIs over 200k)
Net capital gain/loss in AGI: +$7,392 (reported on 19.8% of returns)
Here:
+$7,392
State:
+$15,243
(% of AGI for various income ranges: 12.6% for AGIs below $25k, 34.1% for AGIs $25k-50k, 40.8% for AGIs $50k-75k, 40.0% for AGIs $75k-100k, 224.1% for AGIs $100k-200k, 3660.0% for AGIs over 200k)
Profit/loss from business: +$9,712 (reported on 13.2% of returns)
Here:
+$9,712
State:
+$11,763
(% of AGI for various income ranges: 40.0% for AGIs below $25k, 313.5% for AGIs $25k-50k, 290.8% for AGIs $75k-100k, 270.9% for AGIs $100k-200k)
Taxable individual retirement arrangement distribution: $20,633 (reported on 9.9% of returns)
52324:
$20,633
Iowa:
$17,324
(% of AGI for various income ranges: 375.3% for AGIs $25k-50k, 360.0% for AGIs $75k-100k, 639.1% for AGIs $100k-200k)
Total itemized deductions: $26,511 (reported on 15.7% of returns)
Here:
$26,511
State:
$33,775
(% of AGI for various income ranges: 275.8% for AGIs below $25k, 559.2% for AGIs $50k-75k, 770.0% for AGIs $75k-100k, 959.1% for AGIs $100k-200k, 2506.7% for AGIs over 200k)
Charity contributions: $6,167 (reported on 5.0% of returns)
Here:
$6,167
State:
$13,075
(% of AGI for various income ranges: 73.8% for AGIs $50k-75k, 124.5% for AGIs $100k-200k)
Taxes paid: $8,467 (reported on 7.4% of returns)
52324:
$8,467
State:
$7,704
(% of AGI for various income ranges: 109.4% for AGIs $25k-50k, 149.2% for AGIs $75k-100k, 180.5% for AGIs $100k-200k)
Earned income credit: $2,050 (reported on 8.3% of returns)
Here:
$2,050
State:
$2,195
(% of AGI for various income ranges: 56.3% for AGIs below $25k, 57.6% for AGIs $25k-50k)
Percentage of individuals using paid preparers for their 2020 taxes: 95.0%
Here:
95%
State:
95%
(% for various income ranges: 92.3% for AGIs below $25k, 95.0% for AGIs $25k-50k, 94.1% for AGIs $50k-75k, 93.8% for AGIs $75k-100k, 97.1% for AGIs $100k-200k, 100.0% for AGIs over 200k)
Averages for the 2012 tax year for zip code 52324, filed in 2013:
Average Adjusted Gross Income (AGI) in 2012: $64,686 (Individual Income Tax Returns)
Here:
$64,686
State:
$58,860
Salary/wage: $57,386 (reported on 87.8% of returns)
Here:
$57,386
State:
$46,659
(% of AGI for various income ranges: 73.2% for AGIs below $25k, 72.1% for AGIs $25k-50k, 82.0% for AGIs $50k-75k, 85.5% for AGIs $75k-100k, 93.2% for AGIs $100k-200k)
Taxable interest for individuals: $995 (reported on 46.7% of returns)
This zip code:
$995
Iowa:
$1,537
(% of AGI for various income ranges: 1.8% for AGIs below $25k, 2.1% for AGIs $25k-50k, 0.4% for AGIs $50k-75k, 0.2% for AGIs $75k-100k, 0.7% for AGIs $100k-200k)
Ordinary dividends: $2,030 (reported on 22.2% of returns)
Here:
$2,030
State:
$4,542
(% of AGI for various income ranges: 2.1% for AGIs $25k-50k, 0.5% for AGIs $50k-75k, 0.2% for AGIs $75k-100k, 0.8% for AGIs $100k-200k)
Net capital gain/loss in AGI: +$4,247 (reported on 16.7% of returns)
Here:
+$4,247
State:
+$11,802
(% of AGI for various income ranges: 0.2% for AGIs $25k-50k, 2.6% for AGIs $100k-200k)
Profit/loss from business: +$7,931 (reported on 14.4% of returns)
Here:
+$7,931
State:
+$10,509
(% of AGI for various income ranges: 6.7% for AGIs below $25k, 8.3% for AGIs $25k-50k, 1.3% for AGIs $75k-100k, 0.5% for AGIs $100k-200k)
Taxable individual retirement arrangement distribution: $11,238 (reported on 8.9% of returns)
52324:
$11,238
Iowa:
$11,773
(% of AGI for various income ranges: 7.8% for AGIs below $25k, 3.6% for AGIs $50k-75k, 1.6% for AGIs $100k-200k)
Total itemized deductions: $19,478 (19% of AGI, reported on 44.4% of returns)
Here:
$19,478
State:
$21,278
Here:
19.4% of AGI
State:
18.9% of AGI
(% of AGI for various income ranges: 14.1% for AGIs $25k-50k, 12.8% for AGIs $50k-75k, 16.2% for AGIs $75k-100k, 16.8% for AGIs $100k-200k)
Charity contributions: $2,420 (reported on 33.3% of returns)
Here:
$2,420
State:
$4,044
(% of AGI for various income ranges: 0.5% for AGIs $25k-50k, 1.4% for AGIs $50k-75k, 1.3% for AGIs $75k-100k, 1.8% for AGIs $100k-200k)
Taxes paid: $8,468 (reported on 44.4% of returns)
52324:
$8,468
State:
$8,846
(% of AGI for various income ranges: 3.7% for AGIs $25k-50k, 5.0% for AGIs $50k-75k, 6.6% for AGIs $75k-100k, 8.4% for AGIs $100k-200k)
Earned income credit: $1,778 (reported on 10.0% of returns)
Here:
$1,778
State:
$2,098
(% of AGI for various income ranges: 3.3% for AGIs below $25k, 1.0% for AGIs $25k-50k)
Percentage of individuals using paid preparers for their 2012 taxes: 61.1%
Here:
61%
State:
65%
(% for various income ranges: 52.0% for AGIs below $25k, 57.9% for AGIs $25k-50k, 61.5% for AGIs $50k-75k, 66.7% for AGIs $75k-100k, 78.9% for AGIs $100k-200k)
Averages for the 2004 tax year for zip code 52324, filed in 2005:
Average Adjusted Gross Income (AGI) in 2004: $49,207 (Individual Income Tax Returns)
Here:
$49,207
State:
$43,875
Salary/wage: $46,266 (reported on 86.5% of returns)
Here:
$46,266
State:
$38,265
(% of AGI for various income ranges: 117.1% for AGIs below $10k, 62.5% for AGIs $10k-25k, 83.6% for AGIs $25k-50k, 85.1% for AGIs $50k-75k, 90.3% for AGIs $75k-100k, 71.9% for AGIs over 100k)
Taxable interest for individuals: $1,514 (reported on 56.3% of returns)
This zip code:
$1,514
Iowa:
$1,768
(% of AGI for various income ranges: 5.1% for AGIs below $10k, 3.0% for AGIs $10k-25k, 3.7% for AGIs $25k-50k, 0.9% for AGIs $50k-75k, 0.9% for AGIs $75k-100k, 1.5% for AGIs over 100k)
Taxable dividends: $1,358 (reported on 30.8% of returns)
Here:
$1,358
State:
$2,510
(% of AGI for various income ranges: 1.3% for AGIs $10k-25k, 0.6% for AGIs $25k-50k, 1.0% for AGIs $50k-75k, 0.2% for AGIs $75k-100k, 1.3% for AGIs over 100k)
Net capital gain/loss: +$2,206 (reported on 21.5% of returns)
Here:
+$2,206
State:
+$6,139
(% of AGI for various income ranges: 0.5% for AGIs $10k-25k, 1.0% for AGIs $25k-50k, 0.4% for AGIs $50k-75k, -0.0% for AGIs $75k-100k, 2.5% for AGIs over 100k)
Profit/loss from business: +$3,143 (reported on 14.1% of returns)
Here:
+$3,143
State:
+$8,574
(% of AGI for various income ranges: 4.5% for AGIs $10k-25k, 0.8% for AGIs $25k-50k, 0.5% for AGIs $50k-75k, -0.5% for AGIs $75k-100k, 1.7% for AGIs over 100k)
IRA payment deduction: $3,333 (reported on 1.6% of returns)
52324:
$3,333
Iowa:
$2,970
Total itemized deductions: $16,357 (22% of AGI, reported on 41.9% of returns)
Here:
$16,357
State:
$16,976
Here:
22.0% of AGI
State:
20.8% of AGI
(% of AGI for various income ranges: 15.5% for AGIs $10k-25k, 11.7% for AGIs $25k-50k, 15.1% for AGIs $50k-75k, 14.2% for AGIs $75k-100k, 14.1% for AGIs over 100k)
Charity contributions deductions: $2,022 (3% of AGI, reported on 36.2% of returns)
Here:
$2,022
State:
$3,089
Here:
2.6% of AGI
State:
3.6% of AGI
(% of AGI for various income ranges: 1.5% for AGIs $10k-25k, 0.7% for AGIs $25k-50k, 1.6% for AGIs $50k-75k, 1.6% for AGIs $75k-100k, 1.8% for AGIs over 100k)
Total tax: $5,869 (reported on 83.0% of returns)
52324:
$5,869
State:
$6,177
(% of AGI for various income ranges: 3.5% for AGIs below $10k, 5.0% for AGIs $10k-25k, 7.3% for AGIs $25k-50k, 8.0% for AGIs $50k-75k, 9.8% for AGIs $75k-100k, 15.0% for AGIs over 100k)
Earned income credit: $1,510 (reported on 6.9% of returns)
Here:
$1,510
State:
$1,540
Percentage of individuals using paid preparers for their 2004 taxes: 64.3%
Here:
64%
State:
70%
(% for various income ranges: 41.9% for AGIs below $10k, 71.6% for AGIs $10k-25k, 69.5% for AGIs $25k-50k, 73.4% for AGIs $50k-75k, 61.1% for AGIs $75k-100k, 59.7% for AGIs over 100k)
Likely homosexual households (counted as self-reported same-sex unmarried-partner households)
Lesbian couples: 0.0% of all households
Gay men: 0.7% of all households
Household received Food Stamps/SNAP in the past 12 months: 21 Household did not receive Food Stamps/SNAP in the past 12 months: 793
Women who had a birth in the past 12 months: 66 (33 now married, 31 unmarried) Women who did not have a birth in the past 12 months: 408 (251 now married, 156 unmarried)
Housing units in zip code 52324 with a mortgage: 615 (67 second mortgage, 43 both second mortgage and home equity loan) Houses without a mortgage: 1
Median monthly owner costs for units with a mortgage: $1,924 Median monthly owner costs for units without a mortgage: $697
Residents with income below the poverty level in 2022:
This zip code:
3.4%
Whole state:
11.0%
Residents with income below 50% of the poverty level in 2022:
This zip code:
1.0%
Whole state:
5.5%
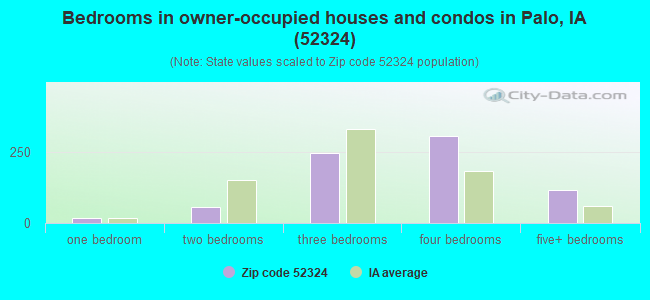
Median number of rooms in houses and condos:
Here:
7.5
State:
6.8
Median number of rooms in apartments:
Here:
4.3
State:
4.2
Notable locations in this zip code not listed on our city pages
Notable locations in zip code 52324: Palo (A), Duane Arnold Energy Center (B), Palo City Police Department (C), Palo City Hall (D), Palo Fire Department (E), Benton Linn Ambulance Service (F). Display/hide their locations on the map
Parks in zip code 52324 include: Hanging Bog State Preserve (1), Zeller Memorial Park (2), Lewis Bottoms Access County Park (3), Palo Marsh County Park (4). Display/hide their locations on the map
Size of family households: 334 2-persons, 117 3-persons, 126 4-persons, 34 5-persons, 23 6-persons, 14 7-or-more-persons
Size of nonfamily households: 97 1-person, 40 2-persons, 15 3-persons
438 married couples with children.
74 single-parent households (29 men, 45 women).
96.8% of residents of 52324 zip code speak English at home.
0.5% of residents speak Spanish at home (80% very well, 20% well).
0.4% of residents speak other Indo-European language at home (100% very well).
1.5% of residents speak Asian or Pacific Island language at home (28% very well, 38% well, 34% not well).
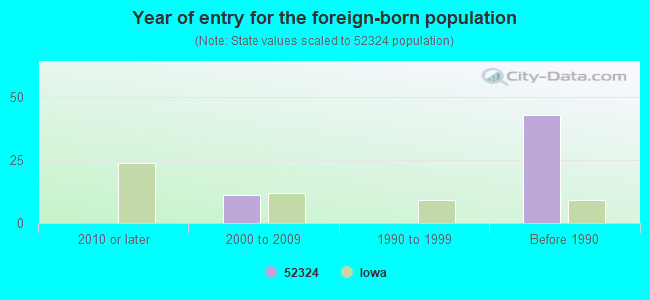
Foreign born population: 46 (2.1%) (54.4% of them are naturalized citizens)
This zip code:
2.1%
Whole state:
6.0%
77%Indonesia
16%France
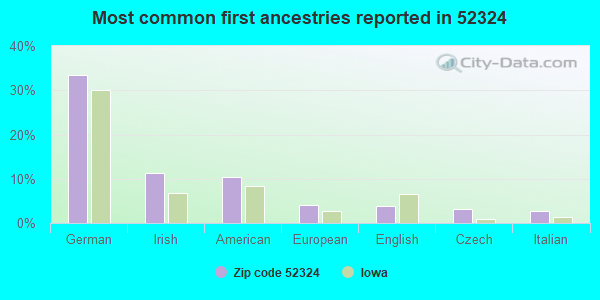
33%German
11%Irish
10%American
4%European
4%English
3%Czech
3%Italian
Year of entry for the foreign-born population
02010 or later
112000 to 2009
01990 to 1999
43Before 1990
Facilities with environmental interests located in this zip code:
DUANE ARNOLD ENERGY CTR (3277 DAEC RD in PALO, IA)
AIR SYNTHETIC MINOR (AIRS/AFS) STATE MASTER (Iowa emission factors information) - SDWIS-IA5715150, DRINKING WATER SYSTEM National Pollutant Discharge Elimination System MAJOR (Tracking pollutant discharge elimination systems) - permit HAZARDOUS WASTE BIENNIAL REPORTER (Resource Conservation and Recovery Act (tracking hazardous waste)) - ICIS-, ENFORCEMENT/COMPLIANCE ACTIVITY Small Quantity Generators, between 100 kg and 1000 kg of hazardous waste/month (Resource Conservation and Recovery Act (tracking hazardous waste)) - notification - ICIS-, ENFORCEMENT/COMPLIANCE ACTIVITY TSD (Resource Conservation and Recovery Act (tracking hazardous waste)) - ICIS-, ENFORCEMENT/COMPLIANCE ACTIVITY Business SIC classification: ELECTRIC SERVICES Organizations: DUANE ARNOLD ENERGY CENTER (CONTACT/GENERAL)
, DAEC IES UTILITY (CONTACT/OPERATOR)
, INTERSTATE POWER & LIGHT COMPA (CONTACT/OWNER)
, ALLIANT ENERGY (CONTACT/OWNER)
Alternative names: DAEC(DUANE ARNOLD ENERGY CNTR)IES UTILIT, IES UTILITIES, INC. DUANE ARNO, IP&L-DUANE ARNOLD ENERGY CENTE
DNR PLEASANT CREEK STATE RECRE (EAST LAGOON in PALO, IA)
National Pollutant Discharge Elimination System NON-MAJOR (Tracking pollutant discharge elimination systems) - permit Business SIC classification: SEWERAGE SYSTEMS
DNR PLEASANT CREEK STATE RECRE ((WEST LAGOON) in PALO, IA)
National Pollutant Discharge Elimination System NON-MAJOR (Tracking pollutant discharge elimination systems) - permit Business SIC classification: SEWERAGE SYSTEMS
PALO CITY OF STP (CITY CLERK in PALO, IA)
National Pollutant Discharge Elimination System NON-MAJOR (Tracking pollutant discharge elimination systems) - permit Business SIC classification: SEWERAGE SYSTEMS Organizations: CITY OF PALO (CONTACT/OWNER)
HAYES SALVAGE (3958 OLD FERRY ROAD in PALO, IA)
COMPLIANCE ACTIVITY (Tracking inspections of insecticide, fungicide, and rodenticide, and toxic substances)
ONE STOP AUTO BODY (125 DRY CREEK CT. in PALO, IA)
AIR SYNTHETIC MINOR (AIRS/AFS) Business SIC classification: TOP, BODY, AND UPHOLSTERY REPAIR SHOPS AND PAINT SHOPS
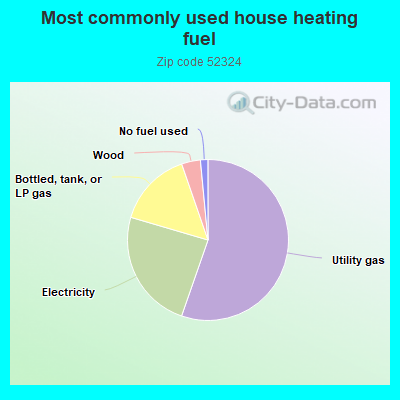
55.5%Utility gas
24.3%Electricity
15.2%Bottled, tank, or LP gas
3.8%Wood
1.5%No fuel used
Population in 1990: 1,528.
Place of birth for U.S.-born residents:
This state: 1,718
Northeast: 21
Midwest: 235
South: 45
West: 64
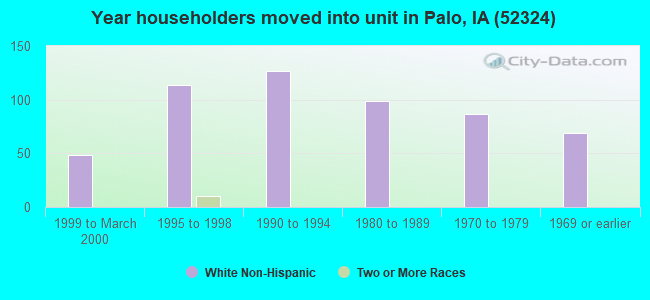
68% of the 52324 zip code residents lived in the same house 5 years ago. Out of people who lived in different houses, 74% lived in this county. Out of people who lived in different counties, 50% lived in Iowa.
91% of the 52324 zip code residents lived in the same house 1 year ago. Out of people who lived in different houses, 69% moved from this county. Out of people who lived in different houses, 16% moved from different county within same state. Out of people who lived in different houses, 13% moved from different state.
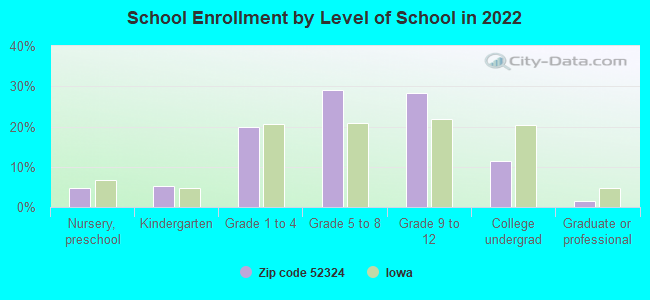
Private vs. public school enrollment:
Students in private schools in grades 1 to 8 (elementary and middle school): 35
Here:
18.0%
Iowa:
10.6%
Students in private schools in grades 9 to 12 (high school):
Here:
0.0%
Iowa:
7.9%
Students in private undergraduate colleges:
Here:
0.0%
Iowa:
23.9%
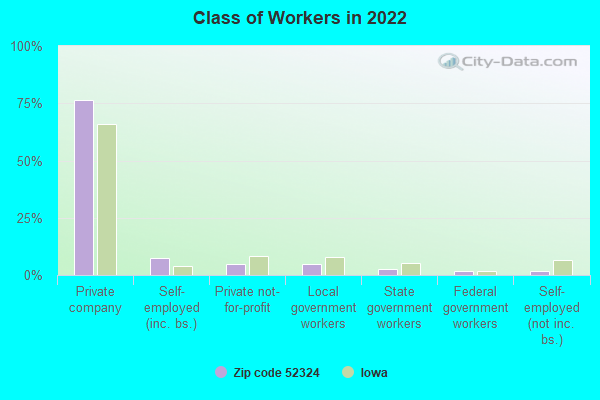
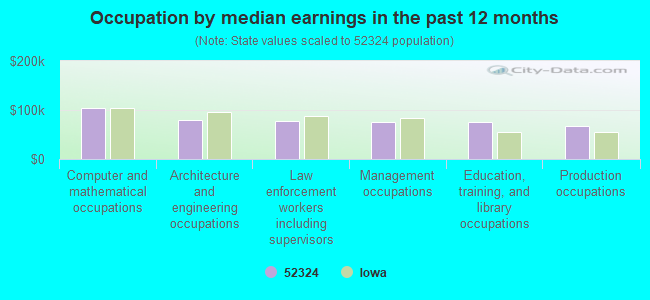
Occupation by median earnings in the past 12 months ($)
104,276Computer and mathematical occupations
80,528Architecture and engineering occupations
77,833Law enforcement workers including supervisors
76,163Management occupations
75,368Education, training, and library occupations
67,995Production occupations
Top industries in this zip code by the number of employees in 2005:
Other Services (except Public Administration): Labor Unions and Similar Labor Organizations (20-49 employees: 1 establishment)
Administrative and Support and Waste Management and Remediation Services: Landscaping Services (10-19: 1, 1-4: 1)
Professional, Scientific, and Technical Services: All Other Professional, Scientific, and Technical Services (10-19: 1)
Finance and Insurance: Commercial Banking (10-19: 1)
Information: Data Processing, Hosting, and Related Services (10-19: 1)
Finance and Insurance: Insurance Agencies and Brokerages (5-9: 2)
Fatal accident statistics in 2014:
Fatal accident count: 1
Vehicles involved in fatal accidents: 1
Fatal accidents caused by drunken drivers: 0
Fatalities: 1
Persons involved in fatal accidents: 1
Pedestrians involved in fatal accidents: 0
Fatal accident statistics in 2010:
Fatal accident count: 1
Vehicles involved in fatal accidents: 1
Fatal accidents caused by drunken drivers: 1
Fatalities: 1
Persons involved in fatal accidents: 1
Pedestrians involved in fatal accidents: 0
Home Mortgage Disclosure Act Aggregated Statistics For Year 2009 (Based on 4 partial tracts)
A) FHA, FSA/RHS & VA Home Purchase Loans
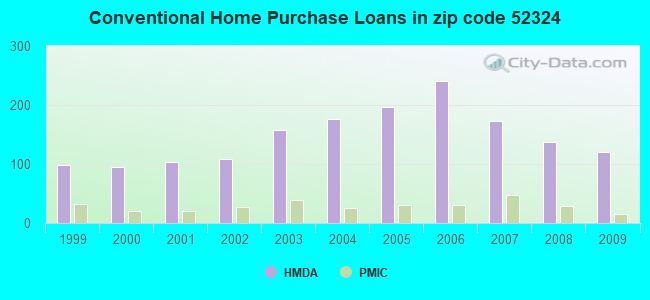
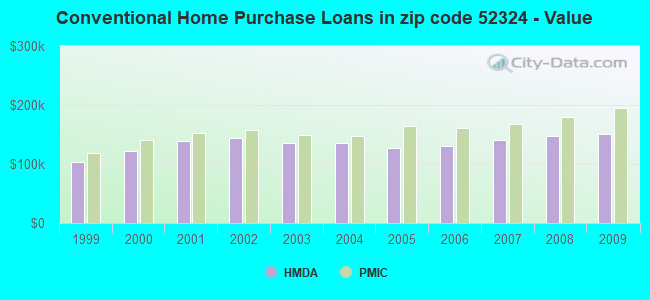
B) Conventional Home Purchase Loans
C) Refinancings
D) Home Improvement Loans
E) Loans on Dwellings For 5+ Families
F) Non-occupant Loans on < 5 Family Dwellings (A B C & D)
G) Loans On Manufactured Home Dwelling (A B C & D)
Number
Average Value
Number
Average Value
Number
Average Value
Number
Average Value
Number
Average Value
Number
Average Value
Number
Average Value
LOANS ORIGINATED
48
$167,497
121
$150,849
399
$160,172
24
$42,935
3
$47,610
8
$66,296
0
$0
APPLICATIONS APPROVED, NOT ACCEPTED
3
$91,510
11
$106,218
32
$143,968
3
$69,980
0
$0
1
$54,870
1
$57,730
APPLICATIONS DENIED
1
$177,150
10
$85,074
47
$174,002
3
$64,957
0
$0
0
$0
3
$37,580
APPLICATIONS WITHDRAWN
3
$138,400
10
$174,883
64
$159,795
1
$91,460
0
$0
1
$57,160
0
$0
FILES CLOSED FOR INCOMPLETENESS
0
$0
2
$77,350
12
$154,584
0
$0
0
$0
1
$94,110
0
$0
Aggregated Statistics For Year 2008 (Based on 4 partial tracts)
A) FHA, FSA/RHS & VA Home Purchase Loans
B) Conventional Home Purchase Loans
C) Refinancings
D) Home Improvement Loans
F) Non-occupant Loans on < 5 Family Dwellings (A B C & D)
G) Loans On Manufactured Home Dwelling (A B C & D)
Number
Average Value
Number
Average Value
Number
Average Value
Number
Average Value
Number
Average Value
Number
Average Value
LOANS ORIGINATED
26
$157,629
138
$147,883
157
$150,150
32
$22,291
16
$90,799
1
$77,500
APPLICATIONS APPROVED, NOT ACCEPTED
3
$156,593
13
$187,804
13
$138,648
2
$5,020
1
$138,400
0
$0
APPLICATIONS DENIED
1
$182,910
9
$83,894
48
$144,394
9
$20,947
0
$0
1
$11,070
APPLICATIONS WITHDRAWN
4
$183,190
15
$127,959
43
$165,694
6
$74,698
1
$75,290
1
$94,110
FILES CLOSED FOR INCOMPLETENESS
1
$127,470
2
$293,905
8
$186,728
2
$45,520
0
$0
0
$0
Aggregated Statistics For Year 2007 (Based on 4 partial tracts)
A) FHA, FSA/RHS & VA Home Purchase Loans
B) Conventional Home Purchase Loans
C) Refinancings
D) Home Improvement Loans
E) Loans on Dwellings For 5+ Families
F) Non-occupant Loans on < 5 Family Dwellings (A B C & D)
G) Loans On Manufactured Home Dwelling (A B C & D)
Number
Average Value
Number
Average Value
Number
Average Value
Number
Average Value
Number
Average Value
Number
Average Value
Number
Average Value
LOANS ORIGINATED
14
$166,947
173
$140,887
140
$115,815
40
$27,846
0
$0
12
$104,532
0
$0
APPLICATIONS APPROVED, NOT ACCEPTED
0
$0
14
$149,284
25
$136,982
3
$82,017
0
$0
1
$16,610
0
$0
APPLICATIONS DENIED
2
$119,555
20
$117,829
71
$146,154
11
$40,061
0
$0
4
$99,830
1
$56,470
APPLICATIONS WITHDRAWN
1
$141,720
12
$171,494
32
$160,674
1
$91,460
1
$4,458,480
1
$22,860
1
$211,480
FILES CLOSED FOR INCOMPLETENESS
0
$0
2
$104,630
7
$176,520
1
$27,680
0
$0
0
$0
0
$0
Aggregated Statistics For Year 2006 (Based on 4 partial tracts)
A) FHA, FSA/RHS & VA Home Purchase Loans
B) Conventional Home Purchase Loans
C) Refinancings
D) Home Improvement Loans
E) Loans on Dwellings For 5+ Families
F) Non-occupant Loans on < 5 Family Dwellings (A B C & D)
G) Loans On Manufactured Home Dwelling (A B C & D)
Number
Average Value
Number
Average Value
Number
Average Value
Number
Average Value
Number
Average Value
Number
Average Value
Number
Average Value
LOANS ORIGINATED
11
$149,406
241
$129,889
139
$113,158
41
$36,224
2
$892,675
19
$105,069
3
$121,177
APPLICATIONS APPROVED, NOT ACCEPTED
1
$54,870
20
$119,804
27
$131,931
2
$55,975
0
$0
1
$36,580
0
$0
APPLICATIONS DENIED
1
$200,400
17
$119,791
82
$110,499
12
$64,528
1
$2,057,760
3
$25,537
1
$79,720
APPLICATIONS WITHDRAWN
1
$117,360
13
$129,792
40
$134,176
2
$33,770
0
$0
0
$0
1
$341,020
FILES CLOSED FOR INCOMPLETENESS
0
$0
1
$106,890
16
$197,094
1
$102,890
0
$0
0
$0
1
$222,550
Aggregated Statistics For Year 2005 (Based on 4 partial tracts)
A) FHA, FSA/RHS & VA Home Purchase Loans
B) Conventional Home Purchase Loans
C) Refinancings
D) Home Improvement Loans
F) Non-occupant Loans on < 5 Family Dwellings (A B C & D)
G) Loans On Manufactured Home Dwelling (A B C & D)
Number
Average Value
Number
Average Value
Number
Average Value
Number
Average Value
Number
Average Value
Number
Average Value
LOANS ORIGINATED
13
$132,372
197
$126,298
205
$136,064
27
$27,980
20
$69,638
2
$69,045
APPLICATIONS APPROVED, NOT ACCEPTED
1
$178,260
16
$128,447
27
$164,485
1
$11,430
0
$0
0
$0
APPLICATIONS DENIED
1
$86,360
19
$92,569
77
$138,088
3
$66,197
3
$143,277
1
$35,440
APPLICATIONS WITHDRAWN
1
$107,400
12
$113,838
55
$129,696
7
$49,241
3
$123,747
0
$0
FILES CLOSED FOR INCOMPLETENESS
0
$0
6
$92,368
22
$136,365
0
$0
0
$0
0
$0
Aggregated Statistics For Year 2004 (Based on 4 partial tracts)
A) FHA, FSA/RHS & VA Home Purchase Loans
B) Conventional Home Purchase Loans
C) Refinancings
D) Home Improvement Loans
F) Non-occupant Loans on < 5 Family Dwellings (A B C & D)
G) Loans On Manufactured Home Dwelling (A B C & D)
Number
Average Value
Number
Average Value
Number
Average Value
Number
Average Value
Number
Average Value
Number
Average Value
LOANS ORIGINATED
10
$134,423
177
$136,391
224
$121,070
37
$33,285
7
$84,577
1
$40,580
APPLICATIONS APPROVED, NOT ACCEPTED
0
$0
18
$108,724
27
$123,554
3
$54,433
2
$128,875
0
$0
APPLICATIONS DENIED
0
$0
20
$103,210
59
$124,842
6
$40,445
2
$171,775
1
$16,580
APPLICATIONS WITHDRAWN
2
$83,565
14
$115,166
67
$112,582
1
$21,040
1
$62,000
0
$0
FILES CLOSED FOR INCOMPLETENESS
0
$0
0
$0
16
$139,859
0
$0
0
$0
0
$0
Aggregated Statistics For Year 2003 (Based on 4 partial tracts)
A) FHA, FSA/RHS & VA Home Purchase Loans
B) Conventional Home Purchase Loans
C) Refinancings
D) Home Improvement Loans
F) Non-occupant Loans on < 5 Family Dwellings (A B C & D)
Number
Average Value
Number
Average Value
Number
Average Value
Number
Average Value
Number
Average Value
LOANS ORIGINATED
9
$126,553
158
$135,217
683
$125,624
36
$24,919
14
$100,285
APPLICATIONS APPROVED, NOT ACCEPTED
1
$68,590
6
$115,093
50
$122,182
2
$36,255
0
$0
APPLICATIONS DENIED
1
$77,170
8
$125,841
88
$114,585
12
$11,270
4
$47,605
APPLICATIONS WITHDRAWN
0
$0
9
$158,694
94
$121,847
0
$0
1
$63,110
FILES CLOSED FOR INCOMPLETENESS
0
$0
4
$155,438
14
$109,420
1
$57,160
0
$0
Aggregated Statistics For Year 2002 (Based on 2 partial tracts)
A) FHA, FSA/RHS & VA Home Purchase Loans
B) Conventional Home Purchase Loans
C) Refinancings
D) Home Improvement Loans
F) Non-occupant Loans on < 5 Family Dwellings (A B C & D)
Number
Average Value
Number
Average Value
Number
Average Value
Number
Average Value
Number
Average Value
LOANS ORIGINATED
4
$168,018
109
$144,647
273
$136,644
33
$24,157
4
$119,025
APPLICATIONS APPROVED, NOT ACCEPTED
0
$0
7
$77,504
32
$111,343
1
$48,720
1
$73,080
APPLICATIONS DENIED
0
$0
12
$69,569
40
$105,959
3
$11,073
3
$81,193
APPLICATIONS WITHDRAWN
0
$0
7
$115,149
44
$113,740
1
$343,230
1
$57,570
FILES CLOSED FOR INCOMPLETENESS
0
$0
2
$59,790
8
$103,524
0
$0
0
$0
Aggregated Statistics For Year 2001 (Based on 2 partial tracts)
A) FHA, FSA/RHS & VA Home Purchase Loans
B) Conventional Home Purchase Loans
C) Refinancings
D) Home Improvement Loans
F) Non-occupant Loans on < 5 Family Dwellings (A B C & D)
Number
Average Value
Number
Average Value
Number
Average Value
Number
Average Value
Number
Average Value
LOANS ORIGINATED
10
$113,045
103
$139,604
218
$126,607
19
$18,239
7
$58,999
APPLICATIONS APPROVED, NOT ACCEPTED
0
$0
8
$121,654
11
$100,454
6
$15,132
1
$7,750
APPLICATIONS DENIED
0
$0
7
$82,566
33
$108,372
1
$8,860
0
$0
APPLICATIONS WITHDRAWN
1
$131,760
6
$114,410
21
$110,878
1
$11,070
0
$0
FILES CLOSED FOR INCOMPLETENESS
0
$0
4
$94,942
3
$89,683
0
$0
1
$55,360
Aggregated Statistics For Year 2000 (Based on 2 partial tracts)
A) FHA, FSA/RHS & VA Home Purchase Loans
B) Conventional Home Purchase Loans
C) Refinancings
D) Home Improvement Loans
F) Non-occupant Loans on < 5 Family Dwellings (A B C & D)
Number
Average Value
Number
Average Value
Number
Average Value
Number
Average Value
Number
Average Value
LOANS ORIGINATED
11
$121,087
95
$122,013
64
$81,189
25
$13,375
1
$109,610
APPLICATIONS APPROVED, NOT ACCEPTED
0
$0
9
$93,989
12
$84,517
0
$0
1
$27,680
APPLICATIONS DENIED
1
$98,540
11
$72,572
9
$93,373
2
$24,360
0
$0
APPLICATIONS WITHDRAWN
0
$0
8
$85,392
13
$121,622
1
$11,070
0
$0
FILES CLOSED FOR INCOMPLETENESS
0
$0
1
$137,290
3
$88,207
0
$0
0
$0
Aggregated Statistics For Year 1999 (Based on 2 partial tracts)
A) FHA, FSA/RHS & VA Home Purchase Loans
B) Conventional Home Purchase Loans
C) Refinancings
D) Home Improvement Loans
F) Non-occupant Loans on < 5 Family Dwellings (A B C & D)
Detailed PMIC statistics for the following Tracts:0010.01
, 0106.00
2002 - 2018 National Fire Incident Reporting System (NFIRS) incidents
Based on the data from the years 2002 - 2018 the average number of fire incidents per year is 10. The highest number of fire incidents - 18 took place in 2018, and the least - 1 in 2013. The data has an increasing trend.
When looking into fire subcategories, the most reports belonged to: Outside Fires (50.8%), and Structure Fires (31.1%).
Fire incident types reported to NFIRS in Zip Code 52324


 Nearest zip codes: 52411, 52341, 52332, 52405, 52206, 52233.


 Based on the data from the years 2002 - 2018 the average number of fire incidents per year is 10. The highest number of fire incidents - 18 took place in 2018, and the least - 1 in 2013. The data has an increasing trend.
 When looking into fire subcategories, the most reports belonged to: Outside Fires (50.8%), and Structure Fires (31.1%).