Estimated zip code population in 2022: 3,900 Zip code population in 2010: 3,283 Zip code population in 2000: 2,857
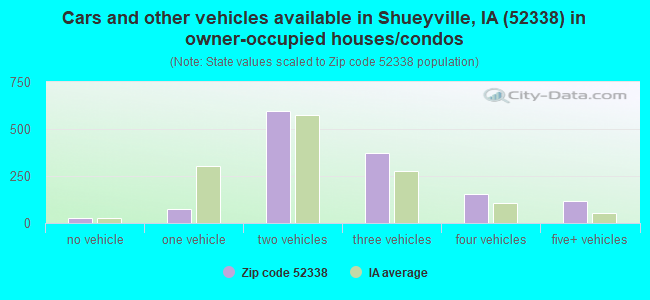
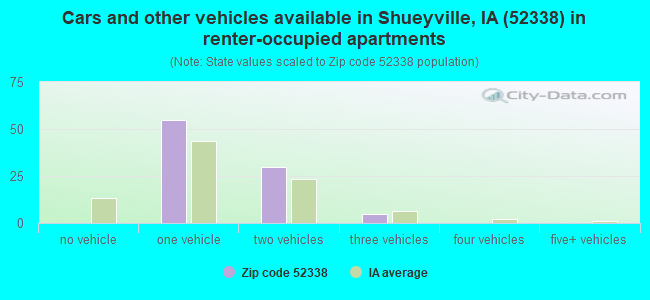
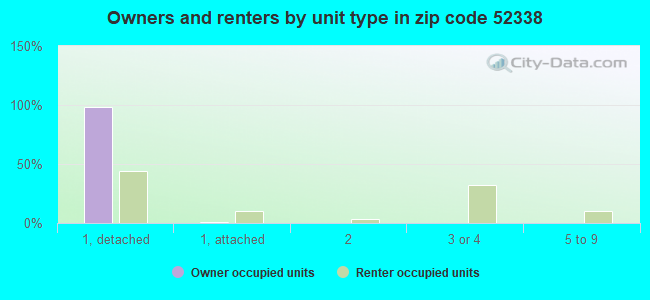
Houses and condos: 1,416 Renter-occupied apartments: 89
% of renters here:
6%
State:
28%
March 2022 cost of living index in zip code 52338: 84.7 (less than average, U.S. average is 100)
Land area: 33.8 sq. mi. Water area: 0.5 sq. mi.
Population density: 116 people per square mile
(very low).
OSM Map
General Map
Google Map
MSN Map
OSM Map
General Map
Google Map
MSN Map
OSM Map
General Map
Google Map
MSN Map
OSM Map
General Map
Google Map
MSN Map
Please wait while loading the map...
Real estate property taxes paid for housing units in 2022:
This zip code:
1.2% ($4,773)
Iowa:
1.4% ($2,724)
Median real estate property taxes paid for housing units with mortgages in 2022: $4,954 (1.2%) Median real estate property taxes paid for housing units with no mortgage in 2022: $4,342 (1.4%)
Estimated median house/condo value in 2022: $383,521
52338:
$383,521
Iowa:
$194,600
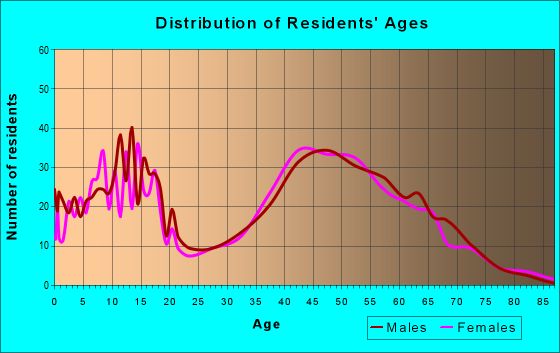
Median resident age:
This zip code:
44.8 years
Iowa median age:
38.9 years
Average household size:
This zip code:
2.7 people
Iowa:
2.3 people
Averages for the 2020 tax year for zip code 52338, filed in 2021:
Average Adjusted Gross Income (AGI) in 2020: $124,773 (Individual Income Tax Returns)
Here:
$124,773
State:
$71,087
Salary/wage: $98,210 (reported on 83.9% of returns)
Here:
$98,210
State:
$57,361
(% of AGI for various income ranges: 1198.7% for AGIs below $25k, 3374.7% for AGIs $25k-50k, 6893.1% for AGIs $50k-75k, 10023.3% for AGIs $75k-100k, 19430.4% for AGIs $100k-200k, 65403.3% for AGIs over 200k)
Taxable interest for individuals: $1,950 (reported on 60.7% of returns)
This zip code:
$1,950
Iowa:
$1,633
(% of AGI for various income ranges: 26.1% for AGIs below $25k, 65.8% for AGIs $25k-50k, 160.0% for AGIs $50k-75k, 235.6% for AGIs $75k-100k, 263.3% for AGIs $100k-200k, 747.8% for AGIs over 200k)
Ordinary dividends: $6,859 (reported on 37.5% of returns)
Here:
$6,859
State:
$5,432
(% of AGI for various income ranges: 38.3% for AGIs below $25k, 62.6% for AGIs $25k-50k, 106.9% for AGIs $50k-75k, 487.8% for AGIs $75k-100k, 397.4% for AGIs $100k-200k, 2736.7% for AGIs over 200k)
Net capital gain/loss in AGI: +$14,102 (reported on 35.1% of returns)
Here:
+$14,102
State:
+$15,243
(% of AGI for various income ranges: 27.8% for AGIs below $25k, 94.7% for AGIs $25k-50k, 150.8% for AGIs $50k-75k, 443.3% for AGIs $75k-100k, 596.3% for AGIs $100k-200k, 6523.3% for AGIs over 200k)
Profit/loss from business: +$15,974 (reported on 16.1% of returns)
Here:
+$15,974
State:
+$11,763
(% of AGI for various income ranges: 74.3% for AGIs below $25k, 206.3% for AGIs $25k-50k, 196.2% for AGIs $50k-75k, 443.3% for AGIs $75k-100k, 354.4% for AGIs $100k-200k, 2376.7% for AGIs over 200k)
Taxable individual retirement arrangement distribution: $22,981 (reported on 15.5% of returns)
52338:
$22,981
Iowa:
$17,324
(% of AGI for various income ranges: 58.7% for AGIs below $25k, 250.0% for AGIs $25k-50k, 402.3% for AGIs $50k-75k, 450.0% for AGIs $75k-100k, 1093.7% for AGIs $100k-200k, 1648.9% for AGIs over 200k)
Total itemized deductions: $40,655 (reported on 17.3% of returns)
Here:
$40,655
State:
$33,775
(% of AGI for various income ranges: 313.0% for AGIs below $25k, 510.8% for AGIs $50k-75k, 967.8% for AGIs $75k-100k, 1229.3% for AGIs $100k-200k, 6906.7% for AGIs over 200k)
Charity contributions: $14,611 (reported on 11.3% of returns)
Here:
$14,611
State:
$13,075
(% of AGI for various income ranges: 58.5% for AGIs $50k-75k, 211.5% for AGIs $100k-200k, 2365.6% for AGIs over 200k)
Taxes paid: $9,691 (reported on 13.1% of returns)
52338:
$9,691
State:
$7,704
(% of AGI for various income ranges: 119.5% for AGIs $25k-50k, 208.9% for AGIs $75k-100k, 293.0% for AGIs $100k-200k, 1028.9% for AGIs over 200k)
Earned income credit: $1,429 (reported on 4.2% of returns)
Here:
$1,429
State:
$2,195
(% of AGI for various income ranges: 24.8% for AGIs below $25k, 22.6% for AGIs $25k-50k)
Percentage of individuals using paid preparers for their 2020 taxes: 96.4%
Here:
96%
State:
95%
(% for various income ranges: 93.9% for AGIs below $25k, 96.2% for AGIs $25k-50k, 95.0% for AGIs $50k-75k, 100.0% for AGIs $75k-100k, 98.0% for AGIs $100k-200k, 95.8% for AGIs over 200k)
Averages for the 2012 tax year for zip code 52338, filed in 2013:
Average Adjusted Gross Income (AGI) in 2012: $99,834 (Individual Income Tax Returns)
Here:
$99,834
State:
$58,860
Salary/wage: $78,594 (reported on 88.0% of returns)
Here:
$78,594
State:
$46,659
(% of AGI for various income ranges: 71.7% for AGIs below $25k, 74.8% for AGIs $25k-50k, 75.2% for AGIs $50k-75k, 77.4% for AGIs $75k-100k, 81.5% for AGIs $100k-200k, 53.6% for AGIs over 200k)
Taxable interest for individuals: $1,454 (reported on 62.7% of returns)
This zip code:
$1,454
Iowa:
$1,537
(% of AGI for various income ranges: 2.9% for AGIs below $25k, 1.8% for AGIs $25k-50k, 1.5% for AGIs $50k-75k, 1.1% for AGIs $75k-100k, 0.6% for AGIs $100k-200k, 0.7% for AGIs over 200k)
Ordinary dividends: $2,657 (reported on 38.0% of returns)
Here:
$2,657
State:
$4,542
(% of AGI for various income ranges: 2.5% for AGIs below $25k, 1.5% for AGIs $25k-50k, 1.2% for AGIs $50k-75k, 0.9% for AGIs $75k-100k, 0.8% for AGIs $100k-200k, 1.0% for AGIs over 200k)
Net capital gain/loss in AGI: +$7,113 (reported on 29.1% of returns)
Here:
+$7,113
State:
+$11,802
(% of AGI for various income ranges: 0.2% for AGIs $50k-75k, 1.3% for AGIs $100k-200k, 4.3% for AGIs over 200k)
Profit/loss from business: +$13,018 (reported on 17.7% of returns)
Here:
+$13,018
State:
+$10,509
(% of AGI for various income ranges: 6.9% for AGIs below $25k, 3.4% for AGIs $25k-50k, 2.9% for AGIs $50k-75k, 0.4% for AGIs $75k-100k, 2.9% for AGIs $100k-200k, 1.7% for AGIs over 200k)
Taxable individual retirement arrangement distribution: $13,686 (reported on 13.3% of returns)
52338:
$13,686
Iowa:
$11,773
(% of AGI for various income ranges: 3.1% for AGIs below $25k, 2.6% for AGIs $25k-50k, 4.5% for AGIs $50k-75k, 2.3% for AGIs $75k-100k, 2.8% for AGIs $100k-200k)
Self-employment retirement plans: $13,833 (reported on 1.9% of returns)
52338:
$13,833
Iowa:
$18,614
Total itemized deductions: $25,794 (17% of AGI, reported on 53.8% of returns)
Here:
$25,794
State:
$21,278
Here:
16.7% of AGI
State:
18.9% of AGI
(% of AGI for various income ranges: 17.8% for AGIs below $25k, 11.4% for AGIs $25k-50k, 13.4% for AGIs $50k-75k, 14.4% for AGIs $75k-100k, 15.7% for AGIs $100k-200k, 12.4% for AGIs over 200k)
Charity contributions: $4,365 (reported on 45.6% of returns)
Here:
$4,365
State:
$4,044
(% of AGI for various income ranges: 1.1% for AGIs $25k-50k, 1.1% for AGIs $50k-75k, 1.2% for AGIs $75k-100k, 1.8% for AGIs $100k-200k, 2.9% for AGIs over 200k)
Taxes paid: $12,422 (reported on 53.8% of returns)
52338:
$12,422
State:
$8,846
(% of AGI for various income ranges: 2.6% for AGIs below $25k, 3.8% for AGIs $25k-50k, 5.3% for AGIs $50k-75k, 6.4% for AGIs $75k-100k, 8.0% for AGIs $100k-200k, 6.6% for AGIs over 200k)
Earned income credit: $1,875 (reported on 5.1% of returns)
Here:
$1,875
State:
$2,098
(% of AGI for various income ranges: 2.5% for AGIs below $25k, 0.5% for AGIs $25k-50k)
Percentage of individuals using paid preparers for their 2012 taxes: 65.2%
Here:
65%
State:
65%
(% for various income ranges: 52.5% for AGIs below $25k, 62.5% for AGIs $25k-50k, 75.0% for AGIs $50k-75k, 76.2% for AGIs $75k-100k, 64.1% for AGIs $100k-200k, 78.6% for AGIs over 200k)
Averages for the 2004 tax year for zip code 52338, filed in 2005:
Average Adjusted Gross Income (AGI) in 2004: $76,156 (Individual Income Tax Returns)
Here:
$76,156
State:
$43,875
Salary/wage: $66,021 (reported on 90.2% of returns)
Here:
$66,021
State:
$38,265
(% of AGI for various income ranges: 126.9% for AGIs below $10k, 70.2% for AGIs $10k-25k, 77.6% for AGIs $25k-50k, 85.3% for AGIs $50k-75k, 88.1% for AGIs $75k-100k, 73.2% for AGIs over 100k)
Taxable interest for individuals: $1,864 (reported on 68.4% of returns)
This zip code:
$1,864
Iowa:
$1,768
(% of AGI for various income ranges: 6.4% for AGIs below $10k, 3.7% for AGIs $10k-25k, 3.2% for AGIs $25k-50k, 1.0% for AGIs $50k-75k, 1.0% for AGIs $75k-100k, 1.7% for AGIs over 100k)
Taxable dividends: $2,282 (reported on 42.8% of returns)
Here:
$2,282
State:
$2,510
(% of AGI for various income ranges: 4.2% for AGIs below $10k, 2.2% for AGIs $10k-25k, 1.6% for AGIs $25k-50k, 0.8% for AGIs $50k-75k, 0.6% for AGIs $75k-100k, 1.5% for AGIs over 100k)
Net capital gain/loss: +$8,948 (reported on 30.9% of returns)
Here:
+$8,948
State:
+$6,139
(% of AGI for various income ranges: 3.2% for AGIs below $10k, -0.6% for AGIs $10k-25k, 0.7% for AGIs $25k-50k, 0.0% for AGIs $50k-75k, 0.4% for AGIs $75k-100k, 6.3% for AGIs over 100k)
Profit/loss from business: +$7,765 (reported on 18.7% of returns)
Here:
+$7,765
State:
+$8,574
(% of AGI for various income ranges: 7.9% for AGIs below $10k, 1.0% for AGIs $10k-25k, 2.1% for AGIs $25k-50k, 2.8% for AGIs $50k-75k, 2.0% for AGIs $75k-100k, 1.6% for AGIs over 100k)
IRA payment deduction: $3,194 (reported on 2.5% of returns)
52338:
$3,194
Iowa:
$2,970
(% of AGI for various income ranges: 1.0% for AGIs $10k-25k, 0.2% for AGIs $50k-75k, 0.1% for AGIs over 100k)
Self-employed pension: $15,273 (reported on 0.8% of returns)
Here:
$15,273
Iowa:
$11,928
Total itemized deductions: $22,943 (20% of AGI, reported on 55.4% of returns)
Here:
$22,943
State:
$16,976
Here:
20.0% of AGI
State:
20.8% of AGI
(% of AGI for various income ranges: 14.3% for AGIs below $10k, 21.9% for AGIs $10k-25k, 14.9% for AGIs $25k-50k, 15.8% for AGIs $50k-75k, 17.1% for AGIs $75k-100k, 16.8% for AGIs over 100k)
Charity contributions deductions: $2,806 (2% of AGI, reported on 49.0% of returns)
Here:
$2,806
State:
$3,089
Here:
2.3% of AGI
State:
3.6% of AGI
(% of AGI for various income ranges: 1.8% for AGIs $10k-25k, 0.9% for AGIs $25k-50k, 1.7% for AGIs $50k-75k, 1.8% for AGIs $75k-100k, 2.0% for AGIs over 100k)
Total tax: $12,134 (reported on 85.4% of returns)
52338:
$12,134
State:
$6,177
(% of AGI for various income ranges: 3.6% for AGIs below $10k, 4.1% for AGIs $10k-25k, 7.2% for AGIs $25k-50k, 8.1% for AGIs $50k-75k, 9.6% for AGIs $75k-100k, 17.9% for AGIs over 100k)
Earned income credit: $1,554 (reported on 3.9% of returns)
Here:
$1,554
State:
$1,540
Percentage of individuals using paid preparers for their 2004 taxes: 65.6%
Here:
66%
State:
70%
(% for various income ranges: 48.2% for AGIs below $10k, 67.5% for AGIs $10k-25k, 69.2% for AGIs $25k-50k, 75.2% for AGIs $50k-75k, 69.6% for AGIs $75k-100k, 63.0% for AGIs over 100k)
Household received Food Stamps/SNAP in the past 12 months: 20 Household did not receive Food Stamps/SNAP in the past 12 months: 1,414
Women who had a birth in the past 12 months: 22 (23 now married, 0 unmarried) Women who did not have a birth in the past 12 months: 746 (443 now married, 301 unmarried)
Housing units in zip code 52338 with a mortgage: 945 (127 second mortgage, 1 home equity loan, 87 both second mortgage and home equity loan) Houses without a mortgage: 15
Median monthly owner costs for units with a mortgage: $2,056 Median monthly owner costs for units without a mortgage: $671
Residents with income below the poverty level in 2022:
This zip code:
5.7%
Whole state:
11.0%
Residents with income below 50% of the poverty level in 2022:
This zip code:
3.3%
Whole state:
5.5%
Median number of rooms in houses and condos:
Here:
8.4
State:
6.8
Median number of rooms in apartments:
Here:
4.3
State:
4.2
Notable locations in this zip code not listed on our city pages
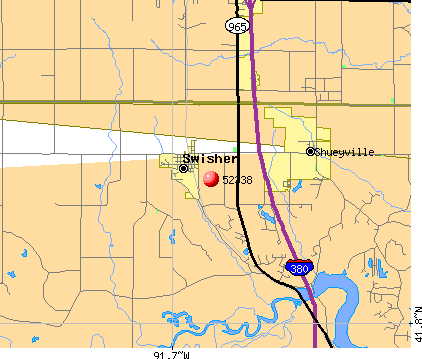
Notable locations in zip code 52338: Cou Falls (A), Swisher (B), Jefferson Monroe Fire Department (C), Shueyville Civic Center (D), Curtis Hill Indian Museum (E), Dance-Mor Ballroom (F), Swisher City Hall (G), Monroe Townhall (H). Display/hide their locations on the map
Size of family households: 610 2-persons, 160 3-persons, 208 4-persons, 109 5-persons, 26 6-persons, 15 7-or-more-persons
Size of nonfamily households: 221 1-person, 64 2-persons, 2 5-persons
889 married couples with children.
58 single-parent households (30 men, 28 women).
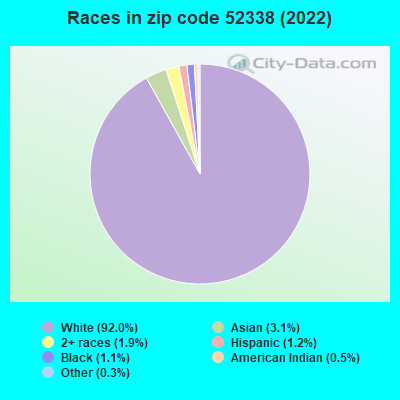
95.3% of residents of 52338 zip code speak English at home.
1.5% of residents speak Spanish at home (36% very well, 64% not well).
0.7% of residents speak other Indo-European language at home (74% very well, 26% well).
1.9% of residents speak Asian or Pacific Island language at home (56% very well, 44% well).
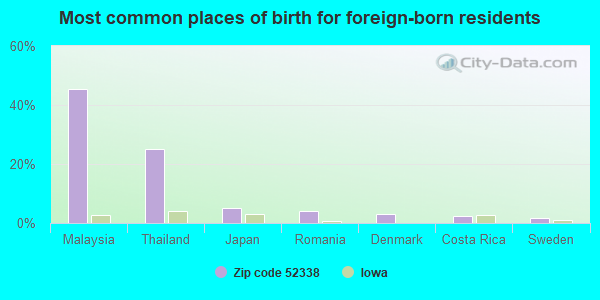
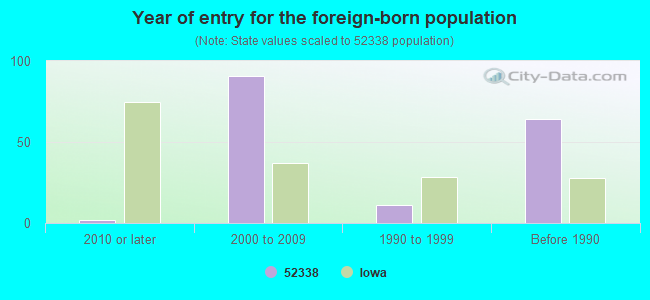
Foreign born population: 183 (4.7%) (92.6% of them are naturalized citizens)
This zip code:
4.7%
Whole state:
6.0%
45%Malaysia
25%Thailand
5%Japan
4%Romania
3%Denmark
2%Costa Rica
2%Sweden
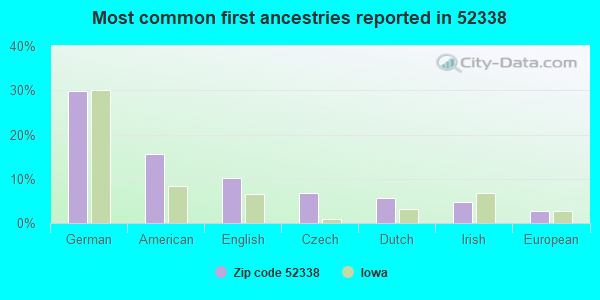
30%German
16%American
10%English
7%Czech
6%Dutch
5%Irish
3%European
Year of entry for the foreign-born population
22010 or later
912000 to 2009
111990 to 1999
64Before 1990
Facilities with environmental interests located in this zip code:
SWISHER CITY OF STP (CITY CLERK in SWISHER, IA)
National Pollutant Discharge Elimination System NON-MAJOR (Tracking pollutant discharge elimination systems) - permit Business SIC classification: SEWERAGE SYSTEMS Organizations: CITY OF SWISHER (CONTACT/OWNER)
National Pollutant Discharge Elimination System NON-MAJOR (Tracking pollutant discharge elimination systems) - permit Business SIC classification: SEWERAGE SYSTEMS Alternative names: TIMBER LAKE SUBDIVISION, TIMBER LAKE SUBDIVISION SEWER PLANT
HORTON READY MIX (I-380 & SWISHER INTERCHANGE in SWISHER, IA)
AIR MINOR (AIRS/AFS) Business SIC classification: READY-MIXED CONCRETE
Housing units lacking complete plumbing facilities: 0.1% Housing units lacking complete kitchen facilities: 0.1%
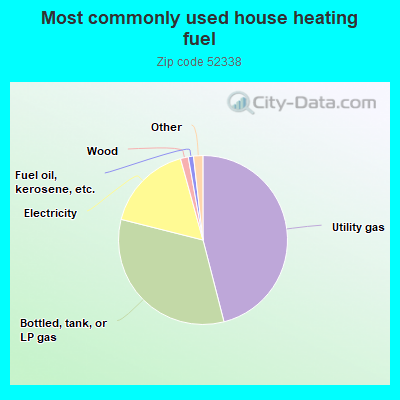
46.1%Utility gas
33.0%Bottled, tank, or LP gas
16.8%Electricity
1.5%Wood
1.0%Fuel oil, kerosene, etc.
0.8%No fuel used
0.6%Solar energy
Population in 1990: 3,101.
Place of birth for U.S.-born residents:
This state: 3,174
Northeast: 90
Midwest: 266
South: 126
West: 58
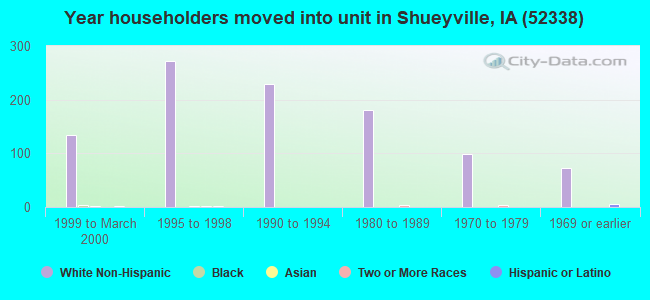
63% of the 52338 zip code residents lived in the same house 5 years ago. Out of people who lived in different houses, 31% lived in this county. Out of people who lived in different counties, 50% lived in Iowa.
93% of the 52338 zip code residents lived in the same house 1 year ago. Out of people who lived in different houses, 43% moved from this county. Out of people who lived in different houses, 60% moved from different county within same state. Out of people who lived in different houses, 1% moved from different state.
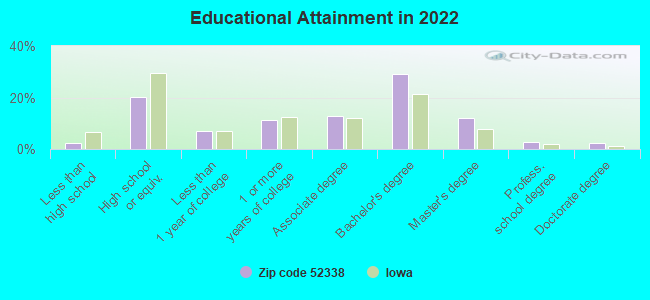
Private vs. public school enrollment:
Students in private schools in grades 1 to 8 (elementary and middle school): 67
Here:
11.6%
Iowa:
10.6%
Students in private schools in grades 9 to 12 (high school): 5
Here:
1.9%
Iowa:
7.9%
Students in private undergraduate colleges: 5
Here:
6.7%
Iowa:
23.9%
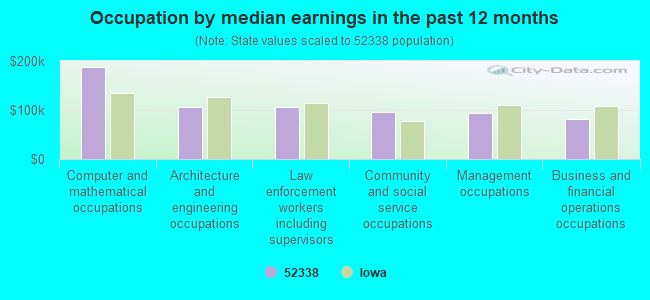
Occupation by median earnings in the past 12 months ($)
188,548Computer and mathematical occupations
106,652Architecture and engineering occupations
105,597Law enforcement workers including supervisors
96,771Community and social service occupations
93,030Management occupations
80,934Business and financial operations occupations
Companies with federal contracts located in this zip code:
BERNS BROTHER'S SNOW REMOVAL (1475 CURTIS BRIDGE RD NE in SWISHER, IA; small business) : $28,999 in 8 contractsfrom 2005 to 2006
Contracts for Landscaping/Groundskeeping Services by Army, U.S. Army Corps of Engineers - civil program financing only Signed by year:2000: $0; 2001: $0; 2002: $0; 2003: $0; 2004: $0; 2005: $16,500; 2006: $12,499.
Biggest contracts:
$14,000 with Army for Landscaping/Groundskeeping Services. Signed on 2005-02-17. Completion date: 2006-03-31.
$6,400, same as above.Signed on 2005-02-17. Completion date: 2006-03-31.
$4,299, same as above.Signed on 2006-03-28. Completion date: 2007-03-31.
$4,200, same as above.Signed on 2006-02-01. Completion date: 2006-03-31.
Top industries in this zip code by the number of employees in 2005:
Construction: Power and Communication Line and Related Structures Construction (50-99 employees: 1 establishment, 5-9 employees: 1 establishment)
Professional, Scientific, and Technical Services: Tax Preparation Services (50-99: 1)
Other Services (except Public Administration): Religious Organizations (20-49: 1)
Professional, Scientific, and Technical Services: Payroll Services (20-49: 1)
Finance and Insurance: Commercial Banking (10-19: 1, 1-4: 1)
Construction: New Single-Family Housing Construction (except Operative Builders) (1-4: 8)
Construction: Framing Contractors (10-19: 1)
Administrative and Support and Waste Management and Remediation Services: Landscaping Services (1-4: 5)
Fatal accident statistics in 2014:
Fatal accident count: 1
Vehicles involved in fatal accidents: 1
Fatal accidents caused by drunken drivers: 0
Fatalities: 1
Persons involved in fatal accidents: 1
Pedestrians involved in fatal accidents: 0
Fatal accident statistics in 2011:
Fatal accident count: 1
Vehicles involved in fatal accidents: 1
Fatal accidents caused by drunken drivers: 1
Fatalities: 1
Persons involved in fatal accidents: 2
Pedestrians involved in fatal accidents: 0
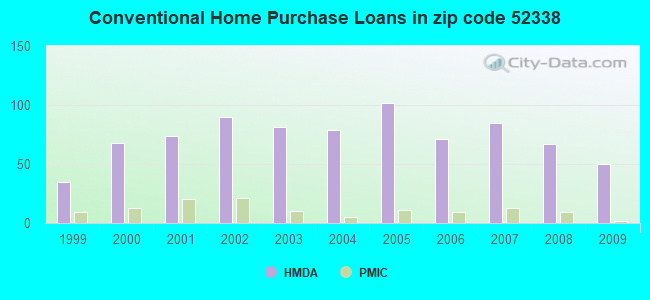
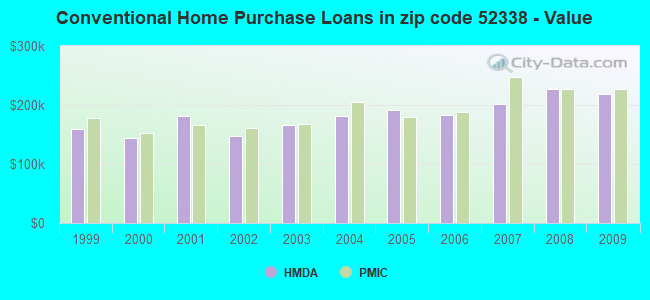
Home Mortgage Disclosure Act Aggregated Statistics For Year 2009 (Based on 2 partial tracts)
A) FHA, FSA/RHS & VA Home Purchase Loans
B) Conventional Home Purchase Loans
C) Refinancings
D) Home Improvement Loans
F) Non-occupant Loans on < 5 Family Dwellings (A B C & D)
G) Loans On Manufactured Home Dwelling (A B C & D)
Number
Average Value
Number
Average Value
Number
Average Value
Number
Average Value
Number
Average Value
Number
Average Value
LOANS ORIGINATED
12
$187,342
50
$218,217
239
$211,278
26
$98,395
5
$90,992
0
$0
APPLICATIONS APPROVED, NOT ACCEPTED
0
$0
2
$298,855
17
$213,858
2
$667,550
0
$0
0
$0
APPLICATIONS DENIED
2
$169,970
4
$269,330
26
$206,230
7
$88,176
2
$63,675
1
$19,510
APPLICATIONS WITHDRAWN
1
$83,190
4
$466,772
37
$209,869
4
$147,888
0
$0
0
$0
FILES CLOSED FOR INCOMPLETENESS
2
$221,320
2
$362,530
8
$230,048
0
$0
0
$0
0
$0
Aggregated Statistics For Year 2008 (Based on 2 partial tracts)
A) FHA, FSA/RHS & VA Home Purchase Loans
B) Conventional Home Purchase Loans
C) Refinancings
D) Home Improvement Loans
E) Loans on Dwellings For 5+ Families
F) Non-occupant Loans on < 5 Family Dwellings (A B C & D)
Number
Average Value
Number
Average Value
Number
Average Value
Number
Average Value
Number
Average Value
Number
Average Value
LOANS ORIGINATED
6
$208,652
67
$226,477
89
$192,153
12
$86,525
1
$220,810
3
$218,067
APPLICATIONS APPROVED, NOT ACCEPTED
0
$0
3
$299,543
9
$232,672
0
$0
0
$0
0
$0
APPLICATIONS DENIED
1
$128,380
2
$87,810
22
$260,391
4
$45,445
0
$0
0
$0
APPLICATIONS WITHDRAWN
0
$0
5
$176,234
14
$234,743
1
$12,320
0
$0
0
$0
FILES CLOSED FOR INCOMPLETENESS
0
$0
1
$135,560
4
$103,985
1
$15,410
0
$0
0
$0
Aggregated Statistics For Year 2007 (Based on 2 partial tracts)
A) FHA, FSA/RHS & VA Home Purchase Loans
B) Conventional Home Purchase Loans
C) Refinancings
D) Home Improvement Loans
F) Non-occupant Loans on < 5 Family Dwellings (A B C & D)
G) Loans On Manufactured Home Dwelling (A B C & D)
Number
Average Value
Number
Average Value
Number
Average Value
Number
Average Value
Number
Average Value
Number
Average Value
LOANS ORIGINATED
3
$134,537
85
$201,111
88
$176,317
21
$63,234
14
$138,279
1
$50,320
APPLICATIONS APPROVED, NOT ACCEPTED
0
$0
13
$159,501
11
$268,981
1
$89,350
1
$17,460
0
$0
APPLICATIONS DENIED
0
$0
5
$283,658
22
$207,874
3
$17,800
0
$0
0
$0
APPLICATIONS WITHDRAWN
0
$0
2
$125,295
24
$214,386
0
$0
0
$0
0
$0
FILES CLOSED FOR INCOMPLETENESS
0
$0
0
$0
2
$342,505
2
$55,970
0
$0
0
$0
Aggregated Statistics For Year 2006 (Based on 2 partial tracts)
A) FHA, FSA/RHS & VA Home Purchase Loans
B) Conventional Home Purchase Loans
C) Refinancings
D) Home Improvement Loans
F) Non-occupant Loans on < 5 Family Dwellings (A B C & D)
G) Loans On Manufactured Home Dwelling (A B C & D)
Number
Average Value
Number
Average Value
Number
Average Value
Number
Average Value
Number
Average Value
Number
Average Value
LOANS ORIGINATED
1
$143,780
71
$183,645
105
$148,455
15
$48,611
8
$173,691
2
$96,540
APPLICATIONS APPROVED, NOT ACCEPTED
0
$0
5
$152,202
13
$393,578
2
$118,105
1
$285,510
1
$48,270
APPLICATIONS DENIED
0
$0
5
$129,608
37
$202,846
6
$106,980
0
$0
0
$0
APPLICATIONS WITHDRAWN
0
$0
3
$105,097
21
$218,653
3
$78,737
0
$0
0
$0
FILES CLOSED FOR INCOMPLETENESS
0
$0
1
$49,300
8
$358,038
1
$71,890
0
$0
1
$49,300
Aggregated Statistics For Year 2005 (Based on 2 partial tracts)
A) FHA, FSA/RHS & VA Home Purchase Loans
B) Conventional Home Purchase Loans
C) Refinancings
D) Home Improvement Loans
F) Non-occupant Loans on < 5 Family Dwellings (A B C & D)
G) Loans On Manufactured Home Dwelling (A B C & D)
Number
Average Value
Number
Average Value
Number
Average Value
Number
Average Value
Number
Average Value
Number
Average Value
LOANS ORIGINATED
1
$157,130
102
$192,049
200
$163,781
21
$28,316
9
$125,637
2
$114,510
APPLICATIONS APPROVED, NOT ACCEPTED
0
$0
13
$147,256
24
$153,708
1
$22,590
1
$55,460
1
$55,460
APPLICATIONS DENIED
0
$0
5
$178,904
36
$179,211
5
$56,690
1
$255,720
4
$84,985
APPLICATIONS WITHDRAWN
0
$0
10
$147,272
45
$211,859
1
$41,080
0
$0
0
$0
FILES CLOSED FOR INCOMPLETENESS
0
$0
0
$0
13
$205,479
0
$0
0
$0
0
$0
Aggregated Statistics For Year 2004 (Based on 2 partial tracts)
A) FHA, FSA/RHS & VA Home Purchase Loans
B) Conventional Home Purchase Loans
C) Refinancings
D) Home Improvement Loans
F) Non-occupant Loans on < 5 Family Dwellings (A B C & D)
G) Loans On Manufactured Home Dwelling (A B C & D)
Number
Average Value
Number
Average Value
Number
Average Value
Number
Average Value
Number
Average Value
Number
Average Value
LOANS ORIGINATED
5
$186,708
79
$181,220
143
$167,035
23
$23,755
2
$48,270
1
$20,540
APPLICATIONS APPROVED, NOT ACCEPTED
0
$0
7
$161,239
24
$122,470
1
$225,940
0
$0
0
$0
APPLICATIONS DENIED
0
$0
6
$266,678
39
$132,378
6
$77,197
0
$0
0
$0
APPLICATIONS WITHDRAWN
0
$0
5
$269,896
29
$156,069
2
$95,000
0
$0
0
$0
FILES CLOSED FOR INCOMPLETENESS
0
$0
0
$0
14
$196,891
1
$154,050
0
$0
0
$0
Aggregated Statistics For Year 2003 (Based on 2 partial tracts)
A) FHA, FSA/RHS & VA Home Purchase Loans
B) Conventional Home Purchase Loans
C) Refinancings
D) Home Improvement Loans
F) Non-occupant Loans on < 5 Family Dwellings (A B C & D)
Number
Average Value
Number
Average Value
Number
Average Value
Number
Average Value
Number
Average Value
LOANS ORIGINATED
2
$127,860
81
$165,284
458
$160,871
21
$24,257
13
$108,309
APPLICATIONS APPROVED, NOT ACCEPTED
0
$0
5
$160,622
32
$140,828
3
$27,387
2
$93,455
APPLICATIONS DENIED
0
$0
2
$253,670
61
$141,305
3
$41,763
0
$0
APPLICATIONS WITHDRAWN
0
$0
10
$187,530
49
$119,174
2
$15,405
0
$0
FILES CLOSED FOR INCOMPLETENESS
0
$0
1
$262,910
11
$148,542
1
$44,160
0
$0
Aggregated Statistics For Year 2002 (Based on 2 partial tracts)
A) FHA, FSA/RHS & VA Home Purchase Loans
B) Conventional Home Purchase Loans
C) Refinancings
D) Home Improvement Loans
F) Non-occupant Loans on < 5 Family Dwellings (A B C & D)
Number
Average Value
Number
Average Value
Number
Average Value
Number
Average Value
Number
Average Value
LOANS ORIGINATED
2
$131,970
90
$147,751
274
$162,491
12
$33,463
5
$42,928
APPLICATIONS APPROVED, NOT ACCEPTED
0
$0
6
$178,013
33
$107,773
2
$21,565
0
$0
APPLICATIONS DENIED
0
$0
6
$94,655
32
$128,054
2
$24,650
1
$164,320
APPLICATIONS WITHDRAWN
0
$0
6
$198,725
23
$150,120
0
$0
0
$0
FILES CLOSED FOR INCOMPLETENESS
0
$0
1
$431,340
8
$132,226
0
$0
0
$0
Aggregated Statistics For Year 2001 (Based on 2 partial tracts)
A) FHA, FSA/RHS & VA Home Purchase Loans
B) Conventional Home Purchase Loans
C) Refinancings
D) Home Improvement Loans
F) Non-occupant Loans on < 5 Family Dwellings (A B C & D)
Number
Average Value
Number
Average Value
Number
Average Value
Number
Average Value
Number
Average Value
LOANS ORIGINATED
2
$113,995
74
$181,404
200
$141,336
15
$30,605
4
$98,078
APPLICATIONS APPROVED, NOT ACCEPTED
0
$0
8
$88,964
23
$98,860
2
$51,865
0
$0
APPLICATIONS DENIED
0
$0
10
$114,202
41
$151,720
3
$20,883
1
$64,700
APPLICATIONS WITHDRAWN
0
$0
5
$140,494
32
$116,276
2
$46,215
1
$249,560
FILES CLOSED FOR INCOMPLETENESS
0
$0
1
$1,155,380
6
$198,725
0
$0
0
$0
Aggregated Statistics For Year 2000 (Based on 2 partial tracts)
A) FHA, FSA/RHS & VA Home Purchase Loans
B) Conventional Home Purchase Loans
C) Refinancings
D) Home Improvement Loans
F) Non-occupant Loans on < 5 Family Dwellings (A B C & D)
Number
Average Value
Number
Average Value
Number
Average Value
Number
Average Value
Number
Average Value
LOANS ORIGINATED
4
$104,755
68
$143,946
58
$95,210
20
$50,066
2
$176,645
APPLICATIONS APPROVED, NOT ACCEPTED
0
$0
4
$173,050
7
$56,631
6
$35,090
1
$11,300
APPLICATIONS DENIED
1
$80,110
4
$433,908
11
$76,092
4
$5,135
0
$0
APPLICATIONS WITHDRAWN
0
$0
5
$194,924
5
$105,782
1
$51,350
0
$0
FILES CLOSED FOR INCOMPLETENESS
0
$0
0
$0
1
$133,510
0
$0
0
$0
Aggregated Statistics For Year 1999 (Based on 1 partial tract)
A) FHA, FSA/RHS & VA Home Purchase Loans
B) Conventional Home Purchase Loans
C) Refinancings
D) Home Improvement Loans
F) Non-occupant Loans on < 5 Family Dwellings (A B C & D)
Detailed PMIC statistics for the following Tracts:0102.00
2002 - 2018 National Fire Incident Reporting System (NFIRS) incidents
Based on the data from the years 2002 - 2018 the average number of fire incidents per year is 13. The highest number of fire incidents - 39 took place in 2003, and the least - 1 in 2002. The data has an increasing trend.
When looking into fire subcategories, the most reports belonged to: Outside Fires (46.2%), and Structure Fires (40.8%).
Fire incident types reported to NFIRS in Zip Code 52338


 Nearest zip codes: 52317, 52404, 52340, 52228, 52322, 52351.


 Based on the data from the years 2002 - 2018 the average number of fire incidents per year is 13. The highest number of fire incidents - 39 took place in 2003, and the least - 1 in 2002. The data has an increasing trend.
 When looking into fire subcategories, the most reports belonged to: Outside Fires (46.2%), and Structure Fires (40.8%).