Estimated zip code population in 2022: 5,131 Zip code population in 2010: 4,468 Zip code population in 2000: 4,505
Houses and condos: 2,392 Renter-occupied apartments: 190
% of renters here:
8%
State:
28%
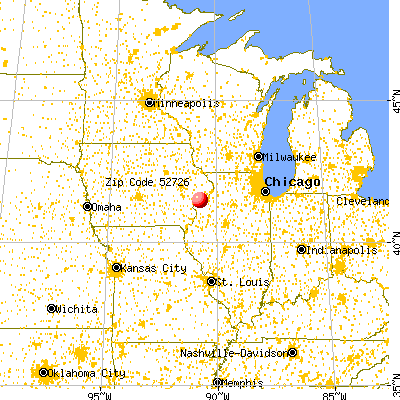
March 2022 cost of living index in zip code 52726: 84.3 (less than average, U.S. average is 100)
Land area: 36.1 sq. mi. Water area: 0.5 sq. mi.
Population density: 142 people per square mile
(very low).
OSM Map
General Map
Google Map
MSN Map
OSM Map
General Map
Google Map
MSN Map
OSM Map
General Map
Google Map
MSN Map
OSM Map
General Map
Google Map
MSN Map
Please wait while loading the map...
Real estate property taxes paid for housing units in 2022:
This zip code:
1.1% ($3,211)
Iowa:
1.4% ($2,724)
Median real estate property taxes paid for housing units with mortgages in 2022: $2,912 (1.0%) Median real estate property taxes paid for housing units with no mortgage in 2022: $3,607 (1.4%)
Estimated median house/condo value in 2022: $290,185
52726:
$290,185
Iowa:
$194,600
According to our research of Iowa and other state lists, there were 5 registered sex offenders living in 52726 zip code as of May 28, 2024. The ratio of all residents to sex offenders in zip code 52726 is 1,075 to 1. The ratio of registered sex offenders to all residents in this zip code is lower than the state average.
Median resident age:
This zip code:
51.5 years
Iowa median age:
38.9 years
Average household size:
This zip code:
2.2 people
Iowa:
2.3 people
Averages for the 2020 tax year for zip code 52726, filed in 2021:
Average Adjusted Gross Income (AGI) in 2020: $81,098 (Individual Income Tax Returns)
Here:
$81,098
State:
$71,087
Salary/wage: $70,537 (reported on 79.5% of returns)
Here:
$70,537
State:
$57,361
(% of AGI for various income ranges: 1147.3% for AGIs below $25k, 3135.8% for AGIs $25k-50k, 5560.4% for AGIs $50k-75k, 8445.0% for AGIs $75k-100k, 16428.9% for AGIs $100k-200k, 51585.0% for AGIs over 200k)
Taxable interest for individuals: $1,202 (reported on 48.0% of returns)
This zip code:
$1,202
Iowa:
$1,633
(% of AGI for various income ranges: 29.2% for AGIs below $25k, 64.8% for AGIs $25k-50k, 68.5% for AGIs $50k-75k, 91.5% for AGIs $75k-100k, 136.3% for AGIs $100k-200k, 335.0% for AGIs over 200k)
Ordinary dividends: $3,938 (reported on 26.2% of returns)
Here:
$3,938
State:
$5,432
(% of AGI for various income ranges: 28.9% for AGIs below $25k, 57.4% for AGIs $25k-50k, 106.9% for AGIs $50k-75k, 222.5% for AGIs $75k-100k, 238.4% for AGIs $100k-200k, 1122.5% for AGIs over 200k)
Net capital gain/loss in AGI: +$10,193 (reported on 23.6% of returns)
Here:
+$10,193
State:
+$15,243
(% of AGI for various income ranges: 12.7% for AGIs below $25k, 56.1% for AGIs $25k-50k, 132.3% for AGIs $50k-75k, 229.0% for AGIs $75k-100k, 425.3% for AGIs $100k-200k, 7162.5% for AGIs over 200k)
Profit/loss from business: +$9,010 (reported on 12.7% of returns)
Here:
+$9,010
State:
+$11,763
(% of AGI for various income ranges: 53.5% for AGIs below $25k, 10.6% for AGIs $25k-50k, 227.3% for AGIs $50k-75k, 146.5% for AGIs $75k-100k, 290.3% for AGIs $100k-200k, 987.5% for AGIs over 200k)
Taxable individual retirement arrangement distribution: $18,151 (reported on 16.2% of returns)
52726:
$18,151
Iowa:
$17,324
(% of AGI for various income ranges: 106.2% for AGIs below $25k, 281.0% for AGIs $25k-50k, 370.4% for AGIs $50k-75k, 508.0% for AGIs $75k-100k, 669.2% for AGIs $100k-200k, 2325.0% for AGIs over 200k)
Total itemized deductions: $30,128 (reported on 7.9% of returns)
Here:
$30,128
State:
$33,775
(% of AGI for various income ranges: 149.7% for AGIs below $25k, 218.1% for AGIs $50k-75k, 458.0% for AGIs $75k-100k, 602.6% for AGIs $100k-200k, 2740.0% for AGIs over 200k)
Charity contributions: $7,785 (reported on 5.7% of returns)
Here:
$7,785
State:
$13,075
(% of AGI for various income ranges: 8.1% for AGIs $25k-50k, 102.5% for AGIs $75k-100k, 132.6% for AGIs $100k-200k, 695.0% for AGIs over 200k)
Taxes paid: $8,111 (reported on 7.9% of returns)
52726:
$8,111
State:
$7,704
(% of AGI for various income ranges: 17.3% for AGIs below $25k, 49.2% for AGIs $50k-75k, 114.5% for AGIs $75k-100k, 189.2% for AGIs $100k-200k, 800.0% for AGIs over 200k)
Earned income credit: $2,100 (reported on 6.6% of returns)
Here:
$2,100
State:
$2,195
(% of AGI for various income ranges: 52.2% for AGIs below $25k, 39.4% for AGIs $25k-50k)
Percentage of individuals using paid preparers for their 2020 taxes: 94.8%
Here:
95%
State:
95%
(% for various income ranges: 94.0% for AGIs below $25k, 95.0% for AGIs $25k-50k, 91.9% for AGIs $50k-75k, 93.1% for AGIs $75k-100k, 96.8% for AGIs $100k-200k, 100.0% for AGIs over 200k)
Averages for the 2012 tax year for zip code 52726, filed in 2013:
Average Adjusted Gross Income (AGI) in 2012: $71,220 (Individual Income Tax Returns)
Here:
$71,220
State:
$58,860
Salary/wage: $60,421 (reported on 83.6% of returns)
Here:
$60,421
State:
$46,659
(% of AGI for various income ranges: 70.5% for AGIs below $25k, 66.8% for AGIs $25k-50k, 67.7% for AGIs $50k-75k, 75.0% for AGIs $75k-100k, 77.9% for AGIs $100k-200k, 56.0% for AGIs over 200k)
Taxable interest for individuals: $1,142 (reported on 53.9% of returns)
This zip code:
$1,142
Iowa:
$1,537
(% of AGI for various income ranges: 2.0% for AGIs below $25k, 1.5% for AGIs $25k-50k, 1.1% for AGIs $50k-75k, 0.8% for AGIs $75k-100k, 0.5% for AGIs $100k-200k, 0.8% for AGIs over 200k)
Ordinary dividends: $2,495 (reported on 28.8% of returns)
Here:
$2,495
State:
$4,542
(% of AGI for various income ranges: 1.8% for AGIs below $25k, 2.2% for AGIs $25k-50k, 1.2% for AGIs $50k-75k, 0.8% for AGIs $75k-100k, 0.8% for AGIs $100k-200k, 0.7% for AGIs over 200k)
Net capital gain/loss in AGI: +$8,439 (reported on 21.0% of returns)
Here:
+$8,439
State:
+$11,802
(% of AGI for various income ranges: 0.7% for AGIs $25k-50k, 1.0% for AGIs $75k-100k, 0.9% for AGIs $100k-200k, 11.4% for AGIs over 200k)
Profit/loss from business: +$11,194 (reported on 15.1% of returns)
Here:
+$11,194
State:
+$10,509
(% of AGI for various income ranges: 6.4% for AGIs below $25k, 1.4% for AGIs $25k-50k, 2.1% for AGIs $50k-75k, 1.2% for AGIs $75k-100k, 4.0% for AGIs $100k-200k)
Taxable individual retirement arrangement distribution: $14,194 (reported on 14.6% of returns)
52726:
$14,194
Iowa:
$11,773
(% of AGI for various income ranges: 3.5% for AGIs below $25k, 4.8% for AGIs $25k-50k, 3.0% for AGIs $50k-75k, 2.7% for AGIs $75k-100k, 3.8% for AGIs $100k-200k)
Total itemized deductions: $20,074 (19% of AGI, reported on 46.1% of returns)
Here:
$20,074
State:
$21,278
Here:
18.7% of AGI
State:
18.9% of AGI
(% of AGI for various income ranges: 11.6% for AGIs below $25k, 12.7% for AGIs $25k-50k, 12.5% for AGIs $50k-75k, 14.3% for AGIs $75k-100k, 13.7% for AGIs $100k-200k, 11.1% for AGIs over 200k)
Charity contributions: $2,811 (reported on 37.9% of returns)
Here:
$2,811
State:
$4,044
(% of AGI for various income ranges: 1.0% for AGIs below $25k, 0.9% for AGIs $25k-50k, 1.1% for AGIs $50k-75k, 2.0% for AGIs $75k-100k, 1.6% for AGIs $100k-200k, 1.6% for AGIs over 200k)
Taxes paid: $8,760 (reported on 46.1% of returns)
52726:
$8,760
State:
$8,846
(% of AGI for various income ranges: 2.7% for AGIs below $25k, 3.6% for AGIs $25k-50k, 4.5% for AGIs $50k-75k, 5.7% for AGIs $75k-100k, 6.7% for AGIs $100k-200k, 6.3% for AGIs over 200k)
Earned income credit: $1,950 (reported on 8.2% of returns)
Here:
$1,950
State:
$2,098
(% of AGI for various income ranges: 3.7% for AGIs below $25k, 0.6% for AGIs $25k-50k)
Percentage of individuals using paid preparers for their 2012 taxes: 62.6%
Here:
63%
State:
65%
(% for various income ranges: 53.4% for AGIs below $25k, 60.0% for AGIs $25k-50k, 66.7% for AGIs $50k-75k, 69.4% for AGIs $75k-100k, 65.9% for AGIs $100k-200k, 75.0% for AGIs over 200k)
Averages for the 2004 tax year for zip code 52726, filed in 2005:
Average Adjusted Gross Income (AGI) in 2004: $56,456 (Individual Income Tax Returns)
Here:
$56,456
State:
$43,875
Salary/wage: $49,856 (reported on 88.3% of returns)
Here:
$49,856
State:
$38,265
(% of AGI for various income ranges: 100.7% for AGIs below $10k, 67.1% for AGIs $10k-25k, 76.9% for AGIs $25k-50k, 79.6% for AGIs $50k-75k, 85.1% for AGIs $75k-100k, 73.2% for AGIs over 100k)
Taxable interest for individuals: $1,072 (reported on 63.6% of returns)
This zip code:
$1,072
Iowa:
$1,768
(% of AGI for various income ranges: 3.7% for AGIs below $10k, 3.4% for AGIs $10k-25k, 1.5% for AGIs $25k-50k, 1.0% for AGIs $50k-75k, 0.9% for AGIs $75k-100k, 1.1% for AGIs over 100k)
Taxable dividends: $1,628 (reported on 30.7% of returns)
Here:
$1,628
State:
$2,510
(% of AGI for various income ranges: 1.3% for AGIs below $10k, 1.6% for AGIs $10k-25k, 1.2% for AGIs $25k-50k, 1.0% for AGIs $50k-75k, 0.4% for AGIs $75k-100k, 0.9% for AGIs over 100k)
Net capital gain/loss: +$3,640 (reported on 23.9% of returns)
Here:
+$3,640
State:
+$6,139
(% of AGI for various income ranges: -2.3% for AGIs below $10k, -0.1% for AGIs $10k-25k, 1.7% for AGIs $25k-50k, 1.0% for AGIs $50k-75k, 0.8% for AGIs $75k-100k, 2.6% for AGIs over 100k)
Profit/loss from business: +$10,777 (reported on 15.8% of returns)
Here:
+$10,777
State:
+$8,574
(% of AGI for various income ranges: -3.9% for AGIs below $10k, 2.9% for AGIs $10k-25k, 1.1% for AGIs $25k-50k, 2.6% for AGIs $50k-75k, 3.5% for AGIs $75k-100k, 3.9% for AGIs over 100k)
IRA payment deduction: $2,830 (reported on 2.6% of returns)
52726:
$2,830
Iowa:
$2,970
Self-employed pension: $12,185 (reported on 1.3% of returns)
Here:
$12,185
Iowa:
$11,928
Total itemized deductions: $17,249 (20% of AGI, reported on 48.4% of returns)
Here:
$17,249
State:
$16,976
Here:
19.7% of AGI
State:
20.8% of AGI
(% of AGI for various income ranges: 8.1% for AGIs below $10k, 15.8% for AGIs $10k-25k, 12.6% for AGIs $25k-50k, 16.2% for AGIs $50k-75k, 16.5% for AGIs $75k-100k, 13.7% for AGIs over 100k)
Charity contributions deductions: $2,235 (2% of AGI, reported on 42.3% of returns)
Here:
$2,235
State:
$3,089
Here:
2.4% of AGI
State:
3.6% of AGI
(% of AGI for various income ranges: 0.9% for AGIs $10k-25k, 1.1% for AGIs $25k-50k, 1.8% for AGIs $50k-75k, 1.8% for AGIs $75k-100k, 1.9% for AGIs over 100k)
Total tax: $7,938 (reported on 82.9% of returns)
52726:
$7,938
State:
$6,177
(% of AGI for various income ranges: 3.5% for AGIs below $10k, 4.2% for AGIs $10k-25k, 6.7% for AGIs $25k-50k, 8.3% for AGIs $50k-75k, 10.2% for AGIs $75k-100k, 17.5% for AGIs over 100k)
Earned income credit: $1,420 (reported on 6.9% of returns)
Here:
$1,420
State:
$1,540
Percentage of individuals using paid preparers for their 2004 taxes: 63.5%
Here:
64%
State:
70%
(% for various income ranges: 46.9% for AGIs below $10k, 65.7% for AGIs $10k-25k, 67.0% for AGIs $25k-50k, 70.4% for AGIs $50k-75k, 64.9% for AGIs $75k-100k, 68.3% for AGIs over 100k)
Household received Food Stamps/SNAP in the past 12 months: 100 Household did not receive Food Stamps/SNAP in the past 12 months: 2,246
Women who had a birth in the past 12 months: 32 (30 now married, 2 unmarried) Women who did not have a birth in the past 12 months: 968 (548 now married, 419 unmarried)
Housing units in zip code 52726 with a mortgage: 1,258 (69 second mortgage, 61 both second mortgage and home equity loan) Houses without a mortgage: 47
Median monthly owner costs for units with a mortgage: $1,710 Median monthly owner costs for units without a mortgage: $642
Residents with income below the poverty level in 2022:
This zip code:
5.2%
Whole state:
11.0%
Residents with income below 50% of the poverty level in 2022:
This zip code:
1.9%
Whole state:
5.5%
Median number of rooms in houses and condos:
Here:
7.2
State:
6.8
Median number of rooms in apartments:
Here:
4.6
State:
4.2
Notable locations in this zip code not listed on our city pages
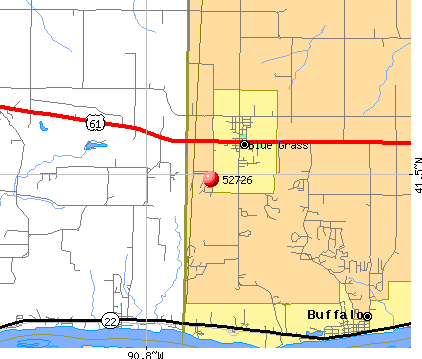
Notable locations in zip code 52726: Camp Abe Lincoln (A), Blue Grass Library (B), Blue Grass City Hall (C), Blue Grass Police Department (D), Blue Grass Fire Department (E), Buffalo Volunteer Ambulance Service (F). Display/hide their locations on the map
Churches in zip code 52726 include: Community Church (A), Spirit of God Baptist Church (B), Victory Life Church (C), Saint Andrew Church (D), Blue Grass Presbyterian Church (E). Display/hide their locations on the map
625 married couples with children.
192 single-parent households (14 men, 178 women).
97.4% of residents of 52726 zip code speak English at home.
2.5% of residents speak Spanish at home (44% very well, 56% not well).
0.7% of residents speak other Indo-European language at home (52% very well, 48% well).
Foreign born population: 112 (2.2%) (65.6% of them are naturalized citizens)
This zip code:
2.2%
Whole state:
6.0%
53%Honduras
23%Sweden
13%Nepal
5%Japan
1%El Salvador
27%German
26%American
7%Swedish
7%English
5%Polish
5%Irish
2%Dutch
Year of entry for the foreign-born population
02010 or later
82000 to 2009
261990 to 1999
64Before 1990
Facilities with environmental interests located in this zip code:
CAMP ABE LINCOLN (1624 W. FRONT STREET in BLUE GRASS, IA)
STATE MASTER (Iowa emission factors information) - SDWIS-IA8215448, DRINKING WATER SYSTEM National Pollutant Discharge Elimination System NON-MAJOR (Tracking pollutant discharge elimination systems) - permit Business SIC classification: RECREATIONAL VEHICLE PARKS AND CAMPSITES Organizations: CAMP ABE LINCOLN/SCOTT CO FAMILY YMCA
BAYLISS ROY (102 S NEISSE in BLUE GRASS, IA)
(Integrated Compliance Information System) - ICIS-07-1995-0085, FORMAL ENFORCEMENT ACTION COMPLIANCE ACTIVITY (Tracking inspections of insecticide, fungicide, and rodenticide, and toxic substances) Business SIC classification: NONCLASSIFIABLE ESTABLISHMENTS Alternative names: ROY BAYLISS
BLUE GRASS ELEMENTARY SCHOOL (226 SYCAMORE ST in BLUE GRASS, IA)
(National Center for Education Statistics) - STATE ID-821611 412 Organizations: DAVENPORT COMM SCHOOL DISTRICT (SCHOOL DISTRICT)
T C AUTO (129 W MAYNE ST in BLUE GRASS, IA)
(Resource Conservation and Recovery Act (tracking hazardous waste)) Business NAICS classification: OTHER AUTOMOTIVE MECHANICAL AND ELECTRICAL REPAIR AND MAINTENANCE. Organizations: BLUE GRASS CONOCO (CONTACT/OPERATOR)
, TODD CONWAY (CONTACT/OPERATOR)
, TC AUTO (CONTACT/OWNER)
BLUE GRASS CITY OF STP (CITY CLERK in BLUE GRASS, IA)
National Pollutant Discharge Elimination System NON-MAJOR (Tracking pollutant discharge elimination systems) - permit Business SIC classification: SEWERAGE SYSTEMS Organizations: CITY OF BLUE GRASS (CONTACT/OWNER)
BLUE GRASS TANK WASH INCORPORATED GLESS BROTHERS INCORPORATED (550 W MAYNE ST in BLUE GRASS, IA)
HAZARDOUS WASTE BIENNIAL REPORTER (Resource Conservation and Recovery Act (tracking hazardous waste)) Small Quantity Generators, between 100 kg and 1000 kg of hazardous waste/month (Resource Conservation and Recovery Act (tracking hazardous waste)) Business NAICS classification: GENERAL FREIGHT TRUCKING, LONG-DISTANCE, TRUCKLOAD.; CAR WASHES. Organizations: STEVE BERGER (CONTACT/OPERATOR)
, BLUE GRASS TANK WASH INC/GLESS BROS INC (CONTACT/OWNER)
BLUE GRASS STEEL (210 TERRACE DRIVE in BLUE GRASS, IA)
AIR SYNTHETIC MINOR (AIRS/AFS) Small Quantity Generators, between 100 kg and 1000 kg of hazardous waste/month (Resource Conservation and Recovery Act (tracking hazardous waste)) Business SIC classification: FABRICATED STRUCTURAL METAL Alternative names: BLUE GRASS STEEL COMPANY BLUE GRASS INDUSTRIAL PK
ROY H. BAYLISS (102 S. NIESSE in BLUE GRASS, IA)
COMPLIANCE ACTIVITY (Tracking inspections of insecticide, fungicide, and rodenticide, and toxic substances)
Housing units lacking complete plumbing facilities: 0.4% Housing units lacking complete kitchen facilities: 0.4%
72.9%Utility gas
15.4%Electricity
7.7%Bottled, tank, or LP gas
2.9%Wood
0.8%No fuel used
Population in 1990: 7,536.
Place of birth for U.S.-born residents:
This state: 3,432
Northeast: 146
Midwest: 736
South: 567
West: 125
63% of the 52726 zip code residents lived in the same house 5 years ago. Out of people who lived in different houses, 65% lived in this county. Out of people who lived in different counties, 50% lived in Iowa.
94% of the 52726 zip code residents lived in the same house 1 year ago. Out of people who lived in different houses, 62% moved from this county. Out of people who lived in different houses, 28% moved from different county within same state. Out of people who lived in different houses, 12% moved from different state. Out of people who lived in different houses, 2% moved from abroad.
Private vs. public school enrollment:
Students in private schools in grades 1 to 8 (elementary and middle school): 10
Here:
3.0%
Iowa:
10.6%
Students in private schools in grades 9 to 12 (high school): 55
Here:
23.3%
Iowa:
7.9%
Students in private undergraduate colleges: 19
Here:
32.4%
Iowa:
23.9%
Occupation by median earnings in the past 12 months ($)
89,633Management occupations
84,594Computer and mathematical occupations
82,685Architecture and engineering occupations
80,587Law enforcement workers including supervisors
80,573Installation, maintenance, and repair occupations
72,732Sales and related occupations
Companies with federal contracts located in this zip code (BLUE GRASS, IA):
RICHARD PEEK (519 PROGRESS DR; small business) : $68,340 in 13 contractsfrom 2003 to 2006
Contracts for Trash/Garbage Collection Services - Including Portable Sanitation Services, Waste Treatment and Storage by Army, U.S. Army Corps of Engineers - civil program financing only Signed by year:2000: $0; 2001: $0; 2002: $0; 2003: $10,840; 2004: $21,400; 2005: $23,500; 2006: $12,600.
Biggest contracts:
$12,600 with Army for Trash/Garbage Collection Services - Including Portable Sanitation Services. Signed on 2006-02-28. Completion date: 2004-12-15.
$12,600 with U.S. Army Corps of Engineers - civil program financing only for Trash/Garbage Collection Services - Including Portable Sanitation Services. Signed on 2005-03-14. Completion date: 2004-12-15.
$12,600 with Army for Trash/Garbage Collection Services - Including Portable Sanitation Services. Signed on 2005-03-14. Completion date: 2004-12-15.
$7,700 with Army for Waste Treatment and Storage. Signed on 2004-01-23. Completion date: 2004-03-31.
ILLOWA INVESTMENTS (315 MEUSE CT; small business)
$27,200 with Department of Veterans Affairs for Construction of Structures and Facilities -- Highways, Roads, Streets, Bridges, and Railways (includes resurfacing). Taking place in IL. Signed on 2003-05-15. Completion date: 2003-09-15.
GLESS BROS INC (550 W MAYNE ST; small business)
$8,200 with Army for Maintenance, Repair and Rebuilding of Equipment -- Ground Effect Vehicles, Motor Vehicles, Trailers, and Cycles. Signed on 2003-11-21. Completion date: 2003-12-05.
NORMA JEAN ATHA (602 W SCOTT; small business) : $7,505 in 7 contractsfrom 2002 to 2004
Contracts for Other Housekeeping Services by U.S. Army Corps of Engineers - civil program financing only, Army Signed by year:2000: $0; 2001: $0; 2002: $3,685; 2003: $3,820; 2004: $0; 2005: $0; 2006: $0.
Biggest contracts:
$3,685 with U.S. Army Corps of Engineers - civil program financing only for Other Housekeeping Services. Signed on 2004-02-26. Completion date: 2002-09-15.
$3,685 with Army for Other Housekeeping Services. Signed on 2004-02-26. Completion date: 2002-09-15.
$3,685 with U.S. Army Corps of Engineers - civil program financing only for Other Housekeeping Services. Signed on 2003-01-15. Completion date: 2002-09-15.
$3,685, same as above.Signed on 2002-01-04. Completion date: 2002-09-15.
Top industries in this zip code by the number of employees in 2005:
Construction: Poured Concrete Foundation and Structure Contractors (20-49 employees: 1 establishment, 10-19 employees: 1 establishment, 1-4 employees: 1 establishment)
Construction: Site Preparation Contractors (10-19: 1, 5-9: 1, 1-4: 1)
Administrative and Support and Waste Management and Remediation Services: Landscaping Services (10-19: 1, 1-4: 4)
Construction: Painting and Wall Covering Contractors (10-19: 1, 1-4: 1)
Wholesale Trade: Recyclable Material Merchant Wholesalers (10-19: 1)
Wholesale Trade: Industrial Machinery and Equipment Merchant Wholesalers (10-19: 1)
Fatal accident statistics in 2013:
Fatal accident count: 1
Vehicles involved in fatal accidents: 1
Fatal accidents caused by drunken drivers: 0
Fatalities: 1
Persons involved in fatal accidents: 1
Pedestrians involved in fatal accidents: 0
Fatal accident statistics in 2012:
Fatal accident count: 1
Vehicles involved in fatal accidents: 1
Fatal accidents caused by drunken drivers: 0
Fatalities: 1
Persons involved in fatal accidents: 1
Pedestrians involved in fatal accidents: 0
Home Mortgage Disclosure Act Aggregated Statistics For Year 2009 (Based on 2 partial tracts)
A) FHA, FSA/RHS & VA Home Purchase Loans
B) Conventional Home Purchase Loans
C) Refinancings
D) Home Improvement Loans
E) Loans on Dwellings For 5+ Families
F) Non-occupant Loans on < 5 Family Dwellings (A B C & D)
G) Loans On Manufactured Home Dwelling (A B C & D)
Number
Average Value
Number
Average Value
Number
Average Value
Number
Average Value
Number
Average Value
Number
Average Value
Number
Average Value
LOANS ORIGINATED
35
$137,002
52
$146,374
249
$144,738
36
$50,741
1
$222,460
11
$75,022
1
$17,620
APPLICATIONS APPROVED, NOT ACCEPTED
3
$137,050
2
$39,280
21
$151,210
1
$41,850
0
$0
0
$0
1
$52,860
APPLICATIONS DENIED
4
$140,600
4
$62,222
48
$147,176
7
$16,153
0
$0
2
$92,875
4
$32,487
APPLICATIONS WITHDRAWN
1
$44,790
5
$138,616
46
$158,268
3
$41,850
0
$0
3
$77,337
0
$0
FILES CLOSED FOR INCOMPLETENESS
0
$0
2
$109,765
10
$151,539
1
$36,710
0
$0
0
$0
0
$0
Aggregated Statistics For Year 2008 (Based on 2 partial tracts)
A) FHA, FSA/RHS & VA Home Purchase Loans
B) Conventional Home Purchase Loans
C) Refinancings
D) Home Improvement Loans
E) Loans on Dwellings For 5+ Families
F) Non-occupant Loans on < 5 Family Dwellings (A B C & D)
G) Loans On Manufactured Home Dwelling (A B C & D)
Number
Average Value
Number
Average Value
Number
Average Value
Number
Average Value
Number
Average Value
Number
Average Value
Number
Average Value
LOANS ORIGINATED
27
$143,468
62
$130,628
151
$132,506
48
$37,765
1
$31,570
10
$168,205
7
$27,166
APPLICATIONS APPROVED, NOT ACCEPTED
1
$102,050
6
$107,927
28
$121,117
4
$16,335
0
$0
1
$11,010
0
$0
APPLICATIONS DENIED
5
$129,512
9
$56,697
39
$153,523
15
$68,574
0
$0
1
$30,100
7
$47,829
APPLICATIONS WITHDRAWN
6
$129,953
7
$147,154
31
$144,211
4
$97,465
0
$0
1
$65,340
1
$32,300
FILES CLOSED FOR INCOMPLETENESS
1
$180,610
1
$251,830
8
$169,784
0
$0
0
$0
1
$70,480
0
$0
Aggregated Statistics For Year 2007 (Based on 2 partial tracts)
A) FHA, FSA/RHS & VA Home Purchase Loans
B) Conventional Home Purchase Loans
C) Refinancings
D) Home Improvement Loans
E) Loans on Dwellings For 5+ Families
F) Non-occupant Loans on < 5 Family Dwellings (A B C & D)
G) Loans On Manufactured Home Dwelling (A B C & D)
Number
Average Value
Number
Average Value
Number
Average Value
Number
Average Value
Number
Average Value
Number
Average Value
Number
Average Value
LOANS ORIGINATED
12
$141,089
108
$122,809
133
$109,479
38
$31,377
0
$0
18
$97,567
6
$30,958
APPLICATIONS APPROVED, NOT ACCEPTED
1
$226,870
7
$67,441
26
$157,683
2
$22,025
0
$0
0
$0
3
$30,103
APPLICATIONS DENIED
1
$71,220
18
$116,534
56
$128,551
16
$45,108
0
$0
5
$70,190
4
$36,710
APPLICATIONS WITHDRAWN
0
$0
16
$135,919
23
$128,549
3
$26,187
1
$86,640
1
$50,660
0
$0
FILES CLOSED FOR INCOMPLETENESS
0
$0
1
$179,880
7
$180,823
0
$0
0
$0
0
$0
0
$0
Aggregated Statistics For Year 2006 (Based on 2 partial tracts)
A) FHA, FSA/RHS & VA Home Purchase Loans
B) Conventional Home Purchase Loans
C) Refinancings
D) Home Improvement Loans
E) Loans on Dwellings For 5+ Families
F) Non-occupant Loans on < 5 Family Dwellings (A B C & D)
G) Loans On Manufactured Home Dwelling (A B C & D)
Number
Average Value
Number
Average Value
Number
Average Value
Number
Average Value
Number
Average Value
Number
Average Value
Number
Average Value
LOANS ORIGINATED
8
$132,890
95
$120,764
134
$98,942
40
$28,156
1
$209,980
12
$96,853
13
$28,634
APPLICATIONS APPROVED, NOT ACCEPTED
0
$0
6
$82,720
27
$125,086
2
$29,735
0
$0
1
$61,670
1
$52,860
APPLICATIONS DENIED
1
$69,750
20
$88,030
68
$114,470
16
$49,375
0
$0
3
$31,327
4
$42,950
APPLICATIONS WITHDRAWN
0
$0
15
$96,963
30
$130,272
8
$39,004
0
$0
1
$35,240
1
$44,790
FILES CLOSED FOR INCOMPLETENESS
1
$93,240
3
$106,703
18
$133,788
0
$0
0
$0
0
$0
0
$0
Aggregated Statistics For Year 2005 (Based on 2 partial tracts)
A) FHA, FSA/RHS & VA Home Purchase Loans
B) Conventional Home Purchase Loans
C) Refinancings
D) Home Improvement Loans
E) Loans on Dwellings For 5+ Families
F) Non-occupant Loans on < 5 Family Dwellings (A B C & D)
G) Loans On Manufactured Home Dwelling (A B C & D)
Number
Average Value
Number
Average Value
Number
Average Value
Number
Average Value
Number
Average Value
Number
Average Value
Number
Average Value
LOANS ORIGINATED
7
$126,493
98
$109,373
167
$100,023
37
$30,142
1
$173,270
12
$76,418
4
$42,582
APPLICATIONS APPROVED, NOT ACCEPTED
0
$0
8
$125,640
24
$83,087
5
$32,158
0
$0
1
$123,350
3
$47,477
APPLICATIONS DENIED
1
$125,550
18
$61,673
86
$103,573
7
$69,749
0
$0
2
$153,080
10
$30,910
APPLICATIONS WITHDRAWN
1
$58,740
23
$109,715
57
$118,438
6
$61,673
0
$0
3
$65,343
1
$27,170
FILES CLOSED FOR INCOMPLETENESS
0
$0
1
$89,570
21
$118,975
3
$24,717
0
$0
1
$36,710
1
$36,710
Aggregated Statistics For Year 2004 (Based on 2 partial tracts)
A) FHA, FSA/RHS & VA Home Purchase Loans
B) Conventional Home Purchase Loans
C) Refinancings
D) Home Improvement Loans
E) Loans on Dwellings For 5+ Families
F) Non-occupant Loans on < 5 Family Dwellings (A B C & D)
G) Loans On Manufactured Home Dwelling (A B C & D)
Number
Average Value
Number
Average Value
Number
Average Value
Number
Average Value
Number
Average Value
Number
Average Value
Number
Average Value
LOANS ORIGINATED
9
$94,793
92
$104,767
203
$110,383
39
$27,918
1
$52,130
9
$61,264
10
$30,029
APPLICATIONS APPROVED, NOT ACCEPTED
1
$71,950
7
$69,749
40
$108,808
4
$27,532
0
$0
3
$59,470
4
$45,705
APPLICATIONS DENIED
1
$70,480
15
$64,218
72
$88,848
15
$28,781
0
$0
2
$14,685
9
$31,408
APPLICATIONS WITHDRAWN
1
$53,600
12
$66,812
56
$116,790
7
$37,340
0
$0
0
$0
1
$3,670
FILES CLOSED FOR INCOMPLETENESS
1
$68,280
6
$92,632
22
$112,032
3
$29,613
0
$0
2
$103,520
0
$0
Aggregated Statistics For Year 2003 (Based on 2 partial tracts)
A) FHA, FSA/RHS & VA Home Purchase Loans
B) Conventional Home Purchase Loans
C) Refinancings
D) Home Improvement Loans
E) Loans on Dwellings For 5+ Families
F) Non-occupant Loans on < 5 Family Dwellings (A B C & D)
Number
Average Value
Number
Average Value
Number
Average Value
Number
Average Value
Number
Average Value
Number
Average Value
LOANS ORIGINATED
7
$127,751
93
$107,691
384
$109,287
40
$20,136
1
$154,180
21
$61,183
APPLICATIONS APPROVED, NOT ACCEPTED
1
$212,920
10
$74,521
30
$97,086
5
$46,988
0
$0
1
$36,710
APPLICATIONS DENIED
2
$211,450
23
$56,055
101
$100,651
9
$27,573
0
$0
1
$61,670
APPLICATIONS WITHDRAWN
0
$0
11
$93,110
79
$104,786
2
$30,470
0
$0
1
$104,990
FILES CLOSED FOR INCOMPLETENESS
1
$46,250
1
$116,000
21
$102,858
0
$0
0
$0
1
$44,050
Aggregated Statistics For Year 2002 (Based on 2 partial tracts)
A) FHA, FSA/RHS & VA Home Purchase Loans
B) Conventional Home Purchase Loans
C) Refinancings
D) Home Improvement Loans
E) Loans on Dwellings For 5+ Families
F) Non-occupant Loans on < 5 Family Dwellings (A B C & D)
Number
Average Value
Number
Average Value
Number
Average Value
Number
Average Value
Number
Average Value
Number
Average Value
LOANS ORIGINATED
2
$107,195
70
$92,803
303
$105,453
50
$20,440
1
$122,610
13
$48,739
APPLICATIONS APPROVED, NOT ACCEPTED
4
$70,115
7
$98,593
37
$94,335
6
$28,267
0
$0
2
$74,520
APPLICATIONS DENIED
0
$0
29
$54,027
65
$90,736
11
$19,623
0
$0
5
$37,298
APPLICATIONS WITHDRAWN
1
$95,450
12
$100,096
42
$101,564
2
$14,685
0
$0
1
$61,670
FILES CLOSED FOR INCOMPLETENESS
0
$0
1
$52,130
10
$102,494
0
$0
0
$0
0
$0
Aggregated Statistics For Year 2001 (Based on 2 partial tracts)
A) FHA, FSA/RHS & VA Home Purchase Loans
B) Conventional Home Purchase Loans
C) Refinancings
D) Home Improvement Loans
E) Loans on Dwellings For 5+ Families
F) Non-occupant Loans on < 5 Family Dwellings (A B C & D)
Number
Average Value
Number
Average Value
Number
Average Value
Number
Average Value
Number
Average Value
Number
Average Value
LOANS ORIGINATED
4
$96,362
73
$96,190
217
$95,859
35
$21,963
0
$0
4
$65,710
APPLICATIONS APPROVED, NOT ACCEPTED
1
$36,710
13
$66,191
23
$73,324
4
$8,628
0
$0
0
$0
APPLICATIONS DENIED
1
$93,980
34
$42,368
68
$70,192
15
$12,188
0
$0
2
$50,660
APPLICATIONS WITHDRAWN
0
$0
12
$160,973
41
$88,247
1
$11,010
0
$0
1
$58,740
FILES CLOSED FOR INCOMPLETENESS
0
$0
1
$68,280
8
$80,670
0
$0
1
$60,940
1
$37,440
Aggregated Statistics For Year 2000 (Based on 2 partial tracts)
A) FHA, FSA/RHS & VA Home Purchase Loans
B) Conventional Home Purchase Loans
C) Refinancings
D) Home Improvement Loans
F) Non-occupant Loans on < 5 Family Dwellings (A B C & D)
Number
Average Value
Number
Average Value
Number
Average Value
Number
Average Value
Number
Average Value
LOANS ORIGINATED
13
$93,413
98
$88,037
82
$66,105
57
$23,469
10
$48,531
APPLICATIONS APPROVED, NOT ACCEPTED
0
$0
14
$59,680
15
$62,065
6
$11,135
0
$0
APPLICATIONS DENIED
0
$0
21
$36,500
37
$75,722
20
$12,555
1
$30,840
APPLICATIONS WITHDRAWN
1
$93,240
6
$116,983
32
$67,753
1
$21,290
0
$0
FILES CLOSED FOR INCOMPLETENESS
0
$0
1
$92,510
3
$116,003
0
$0
0
$0
Aggregated Statistics For Year 1999 (Based on 1 partial tract)
A) FHA, FSA/RHS & VA Home Purchase Loans
B) Conventional Home Purchase Loans
C) Refinancings
D) Home Improvement Loans
F) Non-occupant Loans on < 5 Family Dwellings (A B C & D)
Detailed PMIC statistics for the following Tracts:0104.00
2002 - 2018 National Fire Incident Reporting System (NFIRS) incidents
According to the data from the years 2002 - 2018 the average number of fires per year is 12. The highest number of reported fires - 21 took place in 2005, and the least - 0 in 2010. The data has a growing trend.
When looking into fire subcategories, the most reports belonged to: Outside Fires (45.8%), and Structure Fires (38.9%).
Fire incident types reported to NFIRS in Zip Code 52726


 Nearest zip codes: 52728, 61232, 52804, 61284, 52773, 52769.


 According to the data from the years 2002 - 2018 the average number of fires per year is 12. The highest number of reported fires - 21 took place in 2005, and the least - 0 in 2010. The data has a growing trend.
 When looking into fire subcategories, the most reports belonged to: Outside Fires (45.8%), and Structure Fires (38.9%).