Estimated zip code population in 2022: 523 Zip code population in 2010: 671 Zip code population in 2000: 740
Houses and condos: 246 Renter-occupied apartments: 42
% of renters here:
19%
State:
28%
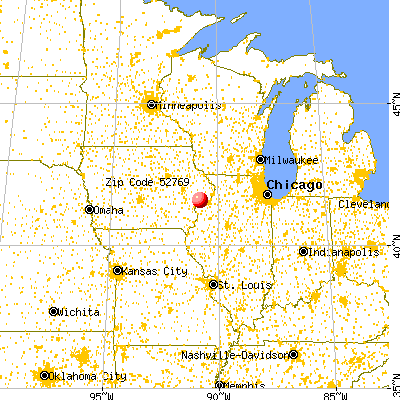
March 2022 cost of living index in zip code 52769: 82.6 (low, U.S. average is 100)
Land area: 41.2 sq. mi. Water area: 0.0 sq. mi.
Population density: 13 people per square mile
(very low).
OSM Map
General Map
Google Map
MSN Map
OSM Map
General Map
Google Map
MSN Map
OSM Map
General Map
Google Map
MSN Map
OSM Map
General Map
Google Map
MSN Map
Please wait while loading the map...
Real estate property taxes paid for housing units in 2022:
This zip code:
1.0% ($2,669)
Iowa:
1.4% ($2,724)
Median real estate property taxes paid for housing units with mortgages in 2022: $2,213 (1.0%) Median real estate property taxes paid for housing units with no mortgage in 2022: $4,114 (1.4%)
Business Search- 14 Million verified businesses
Males: 265
(50.7%)
Females: 258
(49.3%)
For population 25 years and over in 52769:
High school or higher: 93.8%
Bachelor's degree or higher: 21.4%
Graduate or professional degree: 5.0%
Unemployed: 6.0%
Mean travel time to work (commute): 24.8 minutes
For population 15 years and over in 52769:
Never married: 30.0%
Now married: 50.1%
Separated: 3.1%
Widowed: 5.1%
Divorced: 11.8%
Zip code 52769 compared to state average:
Unemployed percentage above state average.
Black race population percentage significantly below state average.
Hispanic race population percentage significantly below state average.
Foreign-born population percentage below state average.
Length of stay since moving in significantly above state average.
Number of rooms per house above state average.
Percentage of population with a bachelor's degree or higher below state average.
Estimated median house/condo value in 2022: $279,684
52769:
$279,684
Iowa:
$194,600
Median resident age:
This zip code:
39.5 years
Iowa median age:
38.9 years
Average household size:
This zip code:
2.4 people
Iowa:
2.3 people
Averages for the 2020 tax year for zip code 52769, filed in 2021:
Average Adjusted Gross Income (AGI) in 2020: $71,069 (Individual Income Tax Returns)
Here:
$71,069
State:
$71,087
Salary/wage: $55,114 (reported on 80.8% of returns)
Here:
$55,114
State:
$57,361
(% of AGI for various income ranges: 1342.5% for AGIs below $25k, 3828.0% for AGIs $25k-50k, 3952.0% for AGIs $50k-75k, 27555.0% for AGIs $100k-200k)
Taxable interest for individuals: $1,267 (reported on 46.2% of returns)
This zip code:
$1,267
Iowa:
$1,633
(% of AGI for various income ranges: 36.0% for AGIs $25k-50k, 228.0% for AGIs $50k-75k, 100.0% for AGIs $100k-200k)
Ordinary dividends: $2,100 (reported on 23.1% of returns)
Here:
$2,100
State:
$5,432
(% of AGI for various income ranges: 162.0% for AGIs $25k-50k, 225.0% for AGIs $100k-200k)
Net capital gain/loss in AGI: +$5,120 (reported on 19.2% of returns)
Here:
+$5,120
State:
+$15,243
(% of AGI for various income ranges: 118.0% for AGIs $25k-50k)
Taxable individual retirement arrangement distribution: $16,975 (reported on 15.4% of returns)
52769:
$16,975
Iowa:
$17,324
(% of AGI for various income ranges: 1358.0% for AGIs $50k-75k)
Earned income credit: $2,333 (reported on 11.5% of returns)
Here:
$2,333
State:
$2,195
(% of AGI for various income ranges: 175.0% for AGIs below $25k)
Percentage of individuals using paid preparers for their 2020 taxes: 100.0%
Here:
100%
State:
95%
(% for various income ranges: 100.0% for AGIs below $25k, 100.0% for AGIs $25k-50k, 100.0% for AGIs $50k-75k, 100.0% for AGIs $75k-100k, 100.0% for AGIs $100k-200k)
Averages for the 2012 tax year for zip code 52769, filed in 2013:
Average Adjusted Gross Income (AGI) in 2012: $58,883 (Individual Income Tax Returns)
Here:
$58,883
State:
$58,860
Salary/wage: $38,346 (reported on 89.7% of returns)
Here:
$38,346
State:
$46,659
(% of AGI for various income ranges: 70.6% for AGIs below $25k, 75.0% for AGIs $25k-50k, 65.6% for AGIs $50k-75k, 65.5% for AGIs $75k-100k, 40.2% for AGIs $100k-200k)
Taxable interest for individuals: $862 (reported on 44.8% of returns)
This zip code:
$862
Iowa:
$1,537
(% of AGI for various income ranges: 1.5% for AGIs below $25k, 0.6% for AGIs $25k-50k, 0.5% for AGIs $50k-75k, 0.8% for AGIs $75k-100k, 0.5% for AGIs $100k-200k)
Ordinary dividends: $1,150 (reported on 27.6% of returns)
Here:
$1,150
State:
$4,542
Net capital gain/loss in AGI: +$600 (reported on 13.8% of returns)
Here:
+$600
State:
+$11,802
Profit/loss from business: +$6,600 (reported on 17.2% of returns)
Here:
+$6,600
State:
+$10,509
Total itemized deductions: $15,514 (16% of AGI, reported on 24.1% of returns)
Here:
$15,514
State:
$21,278
Here:
15.7% of AGI
State:
18.9% of AGI
Charity contributions: $1,625 (reported on 13.8% of returns)
Here:
$1,625
State:
$4,044
Taxes paid: $7,086 (reported on 24.1% of returns)
52769:
$7,086
State:
$8,846
Earned income credit: $2,033 (reported on 10.3% of returns)
Here:
$2,033
State:
$2,098
(% of AGI for various income ranges: 5.6% for AGIs below $25k)
Percentage of individuals using paid preparers for their 2012 taxes: 82.8%
Here:
83%
State:
65%
(% for various income ranges: 77.8% for AGIs below $25k, 85.7% for AGIs $25k-50k, 66.7% for AGIs $50k-75k, 100.0% for AGIs $75k-100k, 100.0% for AGIs $100k-200k)
Averages for the 2004 tax year for zip code 52769, filed in 2005:
Average Adjusted Gross Income (AGI) in 2004: $37,968 (Individual Income Tax Returns)
Here:
$37,968
State:
$43,875
Salary/wage: $33,782 (reported on 82.9% of returns)
Here:
$33,782
State:
$38,265
(% of AGI for various income ranges: 102.3% for AGIs below $10k, 74.7% for AGIs $10k-25k, 67.2% for AGIs $25k-50k, 81.7% for AGIs $50k-75k, 82.8% for AGIs $75k-100k, 57.0% for AGIs over 100k)
Taxable interest for individuals: $1,000 (reported on 55.1% of returns)
This zip code:
$1,000
Iowa:
$1,768
(% of AGI for various income ranges: 4.6% for AGIs below $10k, 4.4% for AGIs $10k-25k, 2.3% for AGIs $25k-50k, 0.7% for AGIs $50k-75k, 0.2% for AGIs $75k-100k, 0.4% for AGIs over 100k)
Taxable dividends: $1,012 (reported on 26.9% of returns)
Here:
$1,012
State:
$2,510
(% of AGI for various income ranges: 0.5% for AGIs below $10k, 0.4% for AGIs $10k-25k, 1.3% for AGIs $25k-50k, 0.7% for AGIs $50k-75k, 0.8% for AGIs over 100k)
Net capital gain/loss: +$3,621 (reported on 18.4% of returns)
Here:
+$3,621
State:
+$6,139
Profit/loss from business: +$3,075 (reported on 12.7% of returns)
Here:
+$3,075
State:
+$8,574
Profit/loss from farming: +$714 (reported on 15.5% of returns)
Here:
+$714
State:
-$74
Total itemized deductions: $16,910 (24% of AGI, reported on 21.2% of returns)
Here:
$16,910
State:
$16,976
Here:
24.4% of AGI
State:
20.8% of AGI
Charity contributions deductions: $1,365 (2% of AGI, reported on 16.5% of returns)
Here:
$1,365
State:
$3,089
Here:
2.0% of AGI
State:
3.6% of AGI
(% of AGI for various income ranges: 0.5% for AGIs $10k-25k, 0.3% for AGIs $50k-75k, 2.5% for AGIs $75k-100k)
Total tax: $4,176 (reported on 79.1% of returns)
52769:
$4,176
State:
$6,177
(% of AGI for various income ranges: 5.5% for AGIs below $10k, 4.9% for AGIs $10k-25k, 8.1% for AGIs $25k-50k, 8.4% for AGIs $50k-75k, 9.7% for AGIs $75k-100k, 12.1% for AGIs over 100k)
Earned income credit: $1,533 (reported on 9.5% of returns)
Here:
$1,533
State:
$1,540
Percentage of individuals using paid preparers for their 2004 taxes: 77.8%
Here:
78%
State:
70%
(% for various income ranges: 67.2% for AGIs below $10k, 74.0% for AGIs $10k-25k, 77.5% for AGIs $25k-50k, 84.9% for AGIs $50k-75k, 92.6% for AGIs $75k-100k, 92.3% for AGIs over 100k)
Household received Food Stamps/SNAP in the past 12 months: 10 Household did not receive Food Stamps/SNAP in the past 12 months: 212
Women who did not have a birth in the past 12 months: 135 (53 now married, 82 unmarried)
Housing units in zip code 52769 with a mortgage: 88 (12 second mortgage, 9 both second mortgage and home equity loan) Median monthly owner costs for units with a mortgage: $1,561 Median monthly owner costs for units without a mortgage: $700
Residents with income below the poverty level in 2022:
This zip code:
4.8%
Whole state:
11.0%
Residents with income below 50% of the poverty level in 2022:
This zip code:
3.2%
Whole state:
5.5%
Median number of rooms in houses and condos:
Here:
8.0
State:
6.8
Median number of rooms in apartments:
Here:
5.9
State:
4.2
Notable locations in this zip code not listed on our city pages
Size of family households: 65 2-persons, 17 3-persons, 25 4-persons, 1 5-persons, 16 6-persons, 2 7-or-more-persons
Size of nonfamily households: 82 1-person, 11 2-persons
71 married couples with children.
57 single-parent households (53 men, 4 women).
97.8% of residents of 52769 zip code speak English at home.
2.0% of residents speak Spanish at home (100% very well).
Foreign born population: 19 (3.7%) (100.0% of them are naturalized citizens)
This zip code:
3.7%
Whole state:
6.0%
44%France
39%Poland
6%Japan
64%German
8%Polish
6%American
6%European
4%Romanian
1%French
1%Irish
Year of entry for the foreign-born population
02010 or later
02000 to 2009
01990 to 1999
15Before 1990
Facilities with environmental interests located in this zip code:
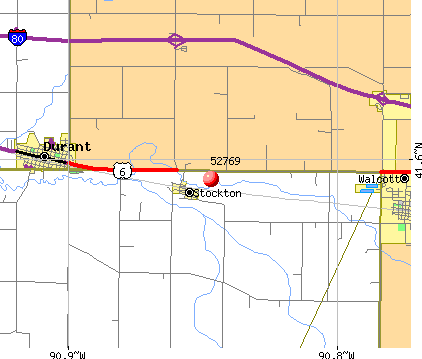
QUALITY FOUNDRY COMPANY (207 COMMERCE STREET in STOCKTON, IA)
AIR SYNTHETIC MINOR (AIRS/AFS) ENFORCEMENT/COMPLIANCE ACTIVITY (Integrated Compliance Information System) COMPLIANCE ACTIVITY (Tracking inspections of insecticide, fungicide, and rodenticide, and toxic substances) (Resource Conservation and Recovery Act (tracking hazardous waste)) Business SIC classification: GRAY AND DUCTILE IRON FOUNDRIES Business NAICS classification: STEEL FOUNDRIES (EXCEPT INVESTMENT).
RIVERSTONE GROUP INC (2700 NEW LIBERTY ROAD in STOCKTON, IA)
National Pollutant Discharge Elimination System NON-MAJOR (Tracking pollutant discharge elimination systems) - permit Business SIC classification: CRUSHED AND BROKEN LIMESTONE Alternative names: MOLINE CONSUMERS CO. (NEW LIBE, NEW LIBERTY QUARRY (MC41)
RIVER VALLEY COOPERATIVE (414 CENTER STREET in STOCKTON, IA)
AIR MINOR (AIRS/AFS) COMPLIANCE ACTIVITY (Tracking inspections of insecticide, fungicide, and rodenticide, and toxic substances) Business SIC classification: NONCLASSIFIABLE ESTABLISHMENTS Alternative names: STOCKTON F.COOP.ELEV
STOCKTON CITY OF STP (1/4 MILE SOUTH OF TOWN ON NEBR in STOCKTON, IA)
National Pollutant Discharge Elimination System NON-MAJOR (Tracking pollutant discharge elimination systems) - permit Business SIC classification: SEWERAGE SYSTEMS Organizations: CITY OF STOCKTON (CONTACT/OWNER)
S C H (1 SMITH DR in STOCKTON, IA)
(Resource Conservation and Recovery Act (tracking hazardous waste)) Alternative names: TUBETECH INC
RIVERSTONE GROUP INC-NEW LIBERTY QUARRY (MC41 - 2700 NEW LIBERTY RD in STOCKTON, IA)
AIR SYNTHETIC MINOR (AIRS/AFS) Business SIC classification: CRUSHED AND BROKEN LIMESTONE
80.7%Bottled, tank, or LP gas
14.1%Electricity
6.1%Solar energy
Population in 1990: 777.
Place of birth for U.S.-born residents:
This state: 441
Midwest: 36
South: 21
West: 6
71% of the 52769 zip code residents lived in the same house 5 years ago. Out of people who lived in different houses, 22% lived in this county. Out of people who lived in different counties, 50% lived in Iowa.
91% of the 52769 zip code residents lived in the same house 1 year ago. Out of people who lived in different houses, 39% moved from this county. Out of people who lived in different houses, 58% moved from different county within same state.
Private vs. public school enrollment:
Students in private schools in grades 1 to 8 (elementary and middle school):
Here:
0.0%
Iowa:
10.6%
Students in private schools in grades 9 to 12 (high school):
Here:
0.0%
Iowa:
7.9%
Students in private undergraduate colleges:
Here:
0.0%
Iowa:
23.9%
Occupation by median earnings in the past 12 months ($)
109,581Construction and extraction occupations
106,142Installation, maintenance, and repair occupations
90,182Business and financial operations occupations
70,287Sales and related occupations
48,432Material moving occupations
45,472Transportation occupations
Top industries in this zip code by the number of employees in 2005:
Real Estate and Rental and Leasing: Offices of Real Estate Agents and Brokers (10-19 employees: 1 establishment)
Construction: Water and Sewer Line and Related Structures Construction (5-9: 1)
Construction: Plumbing, Heating, and Air-Conditioning Contractors (1-4: 2)
Construction: Framing Contractors (1-4: 1)
Other Services (except Public Administration): Commercial and Industrial Machinery and Equipment (except Automotive and Electronic) Repair and Maintenance (1-4: 1)
Other Services (except Public Administration): All Other Personal Services (1-4: 1)
Other Services (except Public Administration): Labor Unions and Similar Labor Organizations (1-4: 1)
Wholesale Trade: Grain and Field Bean Merchant Wholesalers (1-4: 1)
Mining: Crushed and Broken Limestone Mining and Quarrying (1-4: 1)
Home Mortgage Disclosure Act Aggregated Statistics For Year 2009 (Based on 2 partial tracts)
A) FHA, FSA/RHS & VA Home Purchase Loans
B) Conventional Home Purchase Loans
C) Refinancings
D) Home Improvement Loans
F) Non-occupant Loans on < 5 Family Dwellings (A B C & D)
Number
Average Value
Number
Average Value
Number
Average Value
Number
Average Value
Number
Average Value
LOANS ORIGINATED
3
$146,007
3
$200,820
21
$142,248
4
$39,942
1
$221,220
APPLICATIONS APPROVED, NOT ACCEPTED
0
$0
0
$0
1
$155,100
0
$0
0
$0
APPLICATIONS DENIED
1
$100,040
1
$218,760
4
$160,630
0
$0
0
$0
APPLICATIONS WITHDRAWN
0
$0
1
$92,670
3
$153,707
0
$0
0
$0
FILES CLOSED FOR INCOMPLETENESS
0
$0
0
$0
0
$0
0
$0
0
$0
Aggregated Statistics For Year 2008 (Based on 2 partial tracts)
A) FHA, FSA/RHS & VA Home Purchase Loans
B) Conventional Home Purchase Loans
C) Refinancings
D) Home Improvement Loans
F) Non-occupant Loans on < 5 Family Dwellings (A B C & D)
Number
Average Value
Number
Average Value
Number
Average Value
Number
Average Value
Number
Average Value
LOANS ORIGINATED
1
$92,170
4
$207,025
10
$143,080
4
$29,435
1
$288,080
APPLICATIONS APPROVED, NOT ACCEPTED
0
$0
0
$0
1
$86,770
0
$0
0
$0
APPLICATIONS DENIED
0
$0
0
$0
3
$144,693
1
$59,240
0
$0
APPLICATIONS WITHDRAWN
0
$0
0
$0
1
$187,050
0
$0
0
$0
FILES CLOSED FOR INCOMPLETENESS
0
$0
0
$0
0
$0
0
$0
0
$0
Aggregated Statistics For Year 2007 (Based on 2 partial tracts)
A) FHA, FSA/RHS & VA Home Purchase Loans
B) Conventional Home Purchase Loans
C) Refinancings
D) Home Improvement Loans
F) Non-occupant Loans on < 5 Family Dwellings (A B C & D)
Number
Average Value
Number
Average Value
Number
Average Value
Number
Average Value
Number
Average Value
LOANS ORIGINATED
1
$90,950
6
$141,377
12
$104,138
3
$61,287
2
$209,300
APPLICATIONS APPROVED, NOT ACCEPTED
0
$0
0
$0
2
$115,405
1
$100,530
0
$0
APPLICATIONS DENIED
0
$0
1
$62,680
3
$154,033
1
$26,790
0
$0
APPLICATIONS WITHDRAWN
0
$0
1
$216,550
2
$123,145
0
$0
1
$86,520
FILES CLOSED FOR INCOMPLETENESS
0
$0
0
$0
0
$0
0
$0
0
$0
Aggregated Statistics For Year 2006 (Based on 2 partial tracts)
A) FHA, FSA/RHS & VA Home Purchase Loans
B) Conventional Home Purchase Loans
C) Refinancings
D) Home Improvement Loans
F) Non-occupant Loans on < 5 Family Dwellings (A B C & D)
Number
Average Value
Number
Average Value
Number
Average Value
Number
Average Value
Number
Average Value
LOANS ORIGINATED
1
$115,770
8
$99,610
14
$91,771
5
$58,942
3
$75,133
APPLICATIONS APPROVED, NOT ACCEPTED
0
$0
1
$85,780
2
$86,520
0
$0
0
$0
APPLICATIONS DENIED
0
$0
1
$146,990
7
$129,783
1
$72,020
0
$0
APPLICATIONS WITHDRAWN
0
$0
1
$222,450
2
$132,485
0
$0
0
$0
FILES CLOSED FOR INCOMPLETENESS
0
$0
0
$0
1
$125,850
0
$0
0
$0
Aggregated Statistics For Year 2005 (Based on 2 partial tracts)
B) Conventional Home Purchase Loans
C) Refinancings
D) Home Improvement Loans
F) Non-occupant Loans on < 5 Family Dwellings (A B C & D)
G) Loans On Manufactured Home Dwelling (A B C & D)
Number
Average Value
Number
Average Value
Number
Average Value
Number
Average Value
Number
Average Value
LOANS ORIGINATED
8
$98,412
14
$104,079
5
$38,640
1
$51,620
0
$0
APPLICATIONS APPROVED, NOT ACCEPTED
1
$65,630
1
$89,720
0
$0
0
$0
0
$0
APPLICATIONS DENIED
2
$57,025
5
$174,666
2
$49,650
0
$0
1
$22,120
APPLICATIONS WITHDRAWN
1
$105,690
5
$111,888
0
$0
0
$0
0
$0
FILES CLOSED FOR INCOMPLETENESS
0
$0
1
$90,210
0
$0
0
$0
0
$0
Aggregated Statistics For Year 2004 (Based on 2 partial tracts)
B) Conventional Home Purchase Loans
C) Refinancings
D) Home Improvement Loans
F) Non-occupant Loans on < 5 Family Dwellings (A B C & D)
Number
Average Value
Number
Average Value
Number
Average Value
Number
Average Value
LOANS ORIGINATED
8
$104,802
19
$98,825
2
$43,385
2
$74,110
APPLICATIONS APPROVED, NOT ACCEPTED
1
$104,710
2
$84,185
1
$10,320
0
$0
APPLICATIONS DENIED
2
$68,210
7
$109,521
1
$27,780
1
$36,870
APPLICATIONS WITHDRAWN
1
$161,490
3
$123,147
0
$0
0
$0
FILES CLOSED FOR INCOMPLETENESS
0
$0
1
$136,660
0
$0
0
$0
Aggregated Statistics For Year 2003 (Based on 2 partial tracts)
B) Conventional Home Purchase Loans
C) Refinancings
D) Home Improvement Loans
F) Non-occupant Loans on < 5 Family Dwellings (A B C & D)
Number
Average Value
Number
Average Value
Number
Average Value
Number
Average Value
LOANS ORIGINATED
6
$111,060
32
$96,415
1
$59,980
1
$80,130
APPLICATIONS APPROVED, NOT ACCEPTED
0
$0
4
$107,968
1
$14,010
0
$0
APPLICATIONS DENIED
1
$86,770
11
$87,014
2
$31,830
1
$104,220
APPLICATIONS WITHDRAWN
1
$95,620
8
$95,709
0
$0
1
$21,880
FILES CLOSED FOR INCOMPLETENESS
0
$0
1
$110,610
0
$0
0
$0
Aggregated Statistics For Year 2002 (Based on 2 partial tracts)
B) Conventional Home Purchase Loans
C) Refinancings
D) Home Improvement Loans
F) Non-occupant Loans on < 5 Family Dwellings (A B C & D)
Number
Average Value
Number
Average Value
Number
Average Value
Number
Average Value
LOANS ORIGINATED
3
$84,720
26
$87,618
3
$35,970
0
$0
APPLICATIONS APPROVED, NOT ACCEPTED
0
$0
2
$86,155
0
$0
0
$0
APPLICATIONS DENIED
2
$35,640
6
$62,720
2
$16,590
1
$28,020
APPLICATIONS WITHDRAWN
1
$127,320
3
$109,380
0
$0
0
$0
FILES CLOSED FOR INCOMPLETENESS
0
$0
1
$77,430
0
$0
0
$0
Aggregated Statistics For Year 2001 (Based on 2 partial tracts)
A) FHA, FSA/RHS & VA Home Purchase Loans
B) Conventional Home Purchase Loans
C) Refinancings
D) Home Improvement Loans
F) Non-occupant Loans on < 5 Family Dwellings (A B C & D)
Number
Average Value
Number
Average Value
Number
Average Value
Number
Average Value
Number
Average Value
LOANS ORIGINATED
1
$63,660
6
$93,813
14
$87,804
3
$18,437
1
$93,900
APPLICATIONS APPROVED, NOT ACCEPTED
0
$0
1
$43,510
1
$97,830
0
$0
0
$0
APPLICATIONS DENIED
0
$0
2
$63,415
5
$79,148
1
$6,640
0
$0
APPLICATIONS WITHDRAWN
0
$0
1
$97,580
2
$104,590
0
$0
0
$0
FILES CLOSED FOR INCOMPLETENESS
0
$0
0
$0
0
$0
0
$0
0
$0
Aggregated Statistics For Year 2000 (Based on 2 partial tracts)
B) Conventional Home Purchase Loans
C) Refinancings
D) Home Improvement Loans
F) Non-occupant Loans on < 5 Family Dwellings (A B C & D)
Number
Average Value
Number
Average Value
Number
Average Value
Number
Average Value
LOANS ORIGINATED
7
$70,474
7
$63,276
4
$21,200
1
$42,520
APPLICATIONS APPROVED, NOT ACCEPTED
1
$125,600
1
$20,890
0
$0
0
$0
APPLICATIONS DENIED
3
$29,660
2
$42,280
2
$14,625
0
$0
APPLICATIONS WITHDRAWN
0
$0
2
$126,835
0
$0
0
$0
FILES CLOSED FOR INCOMPLETENESS
0
$0
0
$0
0
$0
0
$0
Aggregated Statistics For Year 1999 (Based on 1 partial tract)


+$714
-$74
 Nearest zip codes: 52747, 52773, 52765, 52726, 52745, 52778.


