Estimated zip code population in 2022: 1,139 Zip code population in 2010: 1,262 Zip code population in 2000: 1,209
Houses and condos: 512 Renter-occupied apartments: 105
% of renters here:
22%
State:
32%
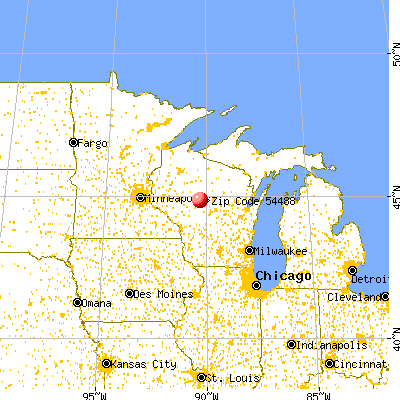
March 2022 cost of living index in zip code 54488: 85.7 (less than average, U.S. average is 100)
Land area: 40.0 sq. mi. Water area: 0.1 sq. mi.
Population density: 28 people per square mile
(very low).
OSM Map
General Map
Google Map
MSN Map
OSM Map
General Map
Google Map
MSN Map
OSM Map
General Map
Google Map
MSN Map
OSM Map
General Map
Google Map
MSN Map
Please wait while loading the map...
Real estate property taxes paid for housing units in 2022:
This zip code:
1.3% ($1,831)
Wisconsin:
1.4% ($3,497)
Median real estate property taxes paid for housing units with mortgages in 2022: $1,850 (1.3%) Median real estate property taxes paid for housing units with no mortgage in 2022: $1,793 (1.4%)
Business Search- 14 Million verified businesses
Males: 616
(54.1%)
Females: 523
(45.9%)
For population 25 years and over in 54488:
High school or higher: 81.6%
Bachelor's degree or higher: 12.0%
Graduate or professional degree: 2.9%
Unemployed: 2.1%
Mean travel time to work (commute): 23.3 minutes
For population 15 years and over in 54488:
Never married: 27.8%
Now married: 57.0%
Separated: 0.4%
Widowed: 4.2%
Divorced: 10.5%
Zip code 54488 compared to state average:
Median house value below state average.
Black race population percentage significantly below state average.
Length of stay since moving in significantly above state average.
Number of college students below state average.
Percentage of population with a bachelor's degree or higher significantly below state average.
Averages for the 2020 tax year for zip code 54488, filed in 2021:
Average Adjusted Gross Income (AGI) in 2020: $55,172 (Individual Income Tax Returns)
Here:
$55,172
State:
$72,319
Salary/wage: $43,560 (reported on 75.5% of returns)
Here:
$43,560
State:
$59,242
(% of AGI for various income ranges: 1810.0% for AGIs below $25k, 4785.6% for AGIs $25k-50k, 8468.0% for AGIs $50k-75k, 12526.7% for AGIs $75k-100k, 18385.0% for AGIs $100k-200k)
Taxable interest for individuals: $1,218 (reported on 41.5% of returns)
This zip code:
$1,218
Wisconsin:
$1,431
(% of AGI for various income ranges: 11.2% for AGIs below $25k, 31.1% for AGIs $25k-50k, 202.0% for AGIs $50k-75k, 66.7% for AGIs $75k-100k, 550.0% for AGIs $100k-200k)
Ordinary dividends: $1,129 (reported on 13.2% of returns)
Here:
$1,129
State:
$6,481
(% of AGI for various income ranges: 45.6% for AGIs $25k-50k, 126.7% for AGIs $75k-100k)
Net capital gain/loss in AGI: +$18,030 (reported on 18.9% of returns)
Here:
+$18,030
State:
+$18,329
(% of AGI for various income ranges: 60.0% for AGIs $25k-50k, 1188.0% for AGIs $50k-75k, 5775.0% for AGIs $100k-200k)
Profit/loss from business: +$11,730 (reported on 18.9% of returns)
Here:
+$11,730
State:
+$14,562
(% of AGI for various income ranges: 291.2% for AGIs below $25k, 542.2% for AGIs $25k-50k, 904.0% for AGIs $50k-75k)
Taxable individual retirement arrangement distribution: $7,680 (reported on 9.4% of returns)
54488:
$7,680
Wisconsin:
$19,348
(% of AGI for various income ranges: 155.0% for AGIs below $25k, 520.0% for AGIs $50k-75k)
Earned income credit: $2,171 (reported on 13.2% of returns)
Here:
$2,171
State:
$2,155
(% of AGI for various income ranges: 115.0% for AGIs below $25k, 66.7% for AGIs $25k-50k)
Percentage of individuals using paid preparers for their 2020 taxes: 92.5%
Here:
92%
State:
94%
(% for various income ranges: 93.3% for AGIs below $25k, 87.5% for AGIs $25k-50k, 100.0% for AGIs $50k-75k, 85.7% for AGIs $75k-100k, 100.0% for AGIs $100k-200k)
Averages for the 2012 tax year for zip code 54488, filed in 2013:
Average Adjusted Gross Income (AGI) in 2012: $43,744 (Individual Income Tax Returns)
Here:
$43,744
State:
$57,939
Salary/wage: $35,189 (reported on 83.3% of returns)
Here:
$35,189
State:
$48,248
(% of AGI for various income ranges: 77.0% for AGIs below $25k, 74.7% for AGIs $25k-50k, 77.7% for AGIs $50k-75k, 69.0% for AGIs $75k-100k, 40.3% for AGIs $100k-200k)
Taxable interest for individuals: $995 (reported on 38.9% of returns)
This zip code:
$995
Wisconsin:
$1,224
(% of AGI for various income ranges: 2.0% for AGIs below $25k, 1.1% for AGIs $25k-50k, 0.3% for AGIs $50k-75k, 0.9% for AGIs $75k-100k, 0.7% for AGIs $100k-200k)
Ordinary dividends: $757 (reported on 13.0% of returns)
Here:
$757
State:
$5,137
(% of AGI for various income ranges: 0.3% for AGIs below $25k, 0.3% for AGIs $25k-50k, 0.5% for AGIs $50k-75k)
Net capital gain/loss in AGI: +$11,560 (reported on 18.5% of returns)
Here:
+$11,560
State:
+$11,137
(% of AGI for various income ranges: 5.1% for AGIs $25k-50k, 3.0% for AGIs $50k-75k, 16.3% for AGIs $75k-100k)
Profit/loss from business: +$10,289 (reported on 16.7% of returns)
Here:
+$10,289
State:
+$11,943
(% of AGI for various income ranges: 4.1% for AGIs below $25k, 3.4% for AGIs $25k-50k, 10.8% for AGIs $50k-75k)
Taxable individual retirement arrangement distribution: $5,567 (reported on 5.6% of returns)
54488:
$5,567
Wisconsin:
$14,087
Total itemized deductions: $19,433 (21% of AGI, reported on 16.7% of returns)
Here:
$19,433
State:
$22,257
Here:
20.8% of AGI
State:
20.1% of AGI
(% of AGI for various income ranges: 7.8% for AGIs $25k-50k, 5.8% for AGIs $50k-75k, 11.2% for AGIs $75k-100k, 9.3% for AGIs $100k-200k)
Charity contributions: $3,833 (reported on 11.1% of returns)
Here:
$3,833
State:
$3,370
Taxes paid: $7,522 (reported on 16.7% of returns)
54488:
$7,522
State:
$10,731
(% of AGI for various income ranges: 1.7% for AGIs $25k-50k, 2.3% for AGIs $50k-75k, 4.0% for AGIs $75k-100k, 5.2% for AGIs $100k-200k)
Earned income credit: $2,075 (reported on 14.8% of returns)
Here:
$2,075
State:
$2,094
(% of AGI for various income ranges: 4.2% for AGIs below $25k, 1.0% for AGIs $25k-50k)
Percentage of individuals using paid preparers for their 2012 taxes: 66.7%
Here:
67%
State:
54%
(% for various income ranges: 57.1% for AGIs below $25k, 62.5% for AGIs $25k-50k, 77.8% for AGIs $50k-75k, 80.0% for AGIs $75k-100k, 100.0% for AGIs $100k-200k)
Averages for the 2004 tax year for zip code 54488, filed in 2005:
Average Adjusted Gross Income (AGI) in 2004: $42,755 (Individual Income Tax Returns)
Here:
$42,755
State:
$47,735
Salary/wage: $35,753 (reported on 87.7% of returns)
Here:
$35,753
State:
$41,540
(% of AGI for various income ranges: 72.7% for AGIs $10k-25k, 80.0% for AGIs $25k-50k, 78.3% for AGIs $50k-75k, 73.5% for AGIs $75k-100k, 45.5% for AGIs over 100k)
Taxable interest for individuals: $974 (reported on 55.5% of returns)
This zip code:
$974
Wisconsin:
$1,420
(% of AGI for various income ranges: 2.5% for AGIs $10k-25k, 1.1% for AGIs $25k-50k, 1.5% for AGIs $50k-75k, 0.5% for AGIs $75k-100k, 0.7% for AGIs over 100k)
Taxable dividends: $889 (reported on 21.6% of returns)
Here:
$889
State:
$2,869
(% of AGI for various income ranges: 1.2% for AGIs $10k-25k, 0.6% for AGIs $25k-50k, 0.3% for AGIs $50k-75k, 0.2% for AGIs $75k-100k)
Net capital gain/loss: +$6,611 (reported on 21.6% of returns)
Here:
+$6,611
State:
+$9,569
(% of AGI for various income ranges: 4.2% for AGIs $10k-25k, 2.0% for AGIs $25k-50k, 1.8% for AGIs $50k-75k, 12.2% for AGIs $75k-100k)
Profit/loss from business: +$8,831 (reported on 17.1% of returns)
Here:
+$8,831
State:
+$10,417
Profit/loss from farming: +$3,635 (reported on 17.8% of returns)
Here:
+$3,635
State:
-$2,654
(% of AGI for various income ranges: 7.4% for AGIs $10k-25k, 3.2% for AGIs $25k-50k, -1.3% for AGIs $50k-75k, -1.1% for AGIs $75k-100k)
IRA payment deduction: $2,290 (reported on 7.5% of returns)
54488:
$2,290
Wisconsin:
$2,900
Total itemized deductions: $14,011 (21% of AGI, reported on 22.8% of returns)
Here:
$14,011
State:
$18,160
Here:
21.4% of AGI
State:
21.1% of AGI
(% of AGI for various income ranges: 6.4% for AGIs $25k-50k, 8.4% for AGIs $50k-75k, 12.0% for AGIs $75k-100k, 11.1% for AGIs over 100k)
Charity contributions deductions: $3,545 (5% of AGI, reported on 15.9% of returns)
Here:
$3,545
State:
$2,711
Here:
4.8% of AGI
State:
3.0% of AGI
Total tax: $4,257 (reported on 81.2% of returns)
54488:
$4,257
State:
$7,114
(% of AGI for various income ranges: 5.4% for AGIs $10k-25k, 5.9% for AGIs $25k-50k, 7.8% for AGIs $50k-75k, 10.6% for AGIs $75k-100k, 14.3% for AGIs over 100k)
Earned income credit: $1,698 (reported on 10.3% of returns)
Here:
$1,698
State:
$1,544
Percentage of individuals using paid preparers for their 2004 taxes: 69.2%
Here:
69%
State:
57%
(% for various income ranges: 64.3% for AGIs $10k-25k, 69.3% for AGIs $25k-50k, 75.6% for AGIs $50k-75k, 67.9% for AGIs $75k-100k, 78.6% for AGIs over 100k)
Household received Food Stamps/SNAP in the past 12 months: 59 Household did not receive Food Stamps/SNAP in the past 12 months: 422
Women who had a birth in the past 12 months: 18 (16 now married, 1 unmarried) Women who did not have a birth in the past 12 months: 200 (102 now married, 97 unmarried)
Housing units in zip code 54488 with a mortgage: 224 (29 second mortgage, 3 home equity loan, 25 both second mortgage and home equity loan) Houses without a mortgage: 16
Median monthly owner costs for units with a mortgage: $1,084 Median monthly owner costs for units without a mortgage: $458
Residents with income below the poverty level in 2022:
This zip code:
12.3%
Whole state:
10.7%
Residents with income below 50% of the poverty level in 2022:
This zip code:
6.4%
Whole state:
5.7%
Median number of rooms in houses and condos:
Here:
6.1
State:
6.5
Median number of rooms in apartments:
Here:
5.2
State:
4.1
Notable locations in this zip code not listed on our city pages
Size of family households: 155 2-persons, 67 3-persons, 60 4-persons, 20 5-persons, 13 6-persons, 9 7-or-more-persons
Size of nonfamily households: 134 1-person, 17 2-persons
219 married couples with children.
55 single-parent households (22 men, 33 women).
89.4% of residents of 54488 zip code speak English at home.
5.8% of residents speak Spanish at home (44% very well, 33% well, 23% not well).
4.1% of residents speak other Indo-European language at home (91% very well, 9% well).
Foreign born population: 49 (4.4%) (20.0% of them are naturalized citizens)
This zip code:
4.4%
Whole state:
5.0%
96%Honduras
55%German
10%American
5%English
2%Polish
2%Norwegian
2%Swiss
1%Finnish
Year of entry for the foreign-born population
232010 or later
132000 to 2009
301990 to 1999
1Before 1990
Facilities with environmental interests located in this zip code:
DALLMANN PLASTICS INC (2ND ST WASHINGTON in UNITY, WI)
Conditionally Exempt Small Quantity Generators, less than 100 kg/month of hazardous waste (Resource Conservation and Recovery Act (tracking hazardous waste)) - notification STATE MASTER (Wisconsin database) - RCRAINFO-WID988620936, CESQG Organizations: DALLMANN EILEEN (CONTACT/OWNER)
DEN MARK INC (543 WASHINGTON ST in UNITY, WI)
Small Quantity Generators, between 100 kg and 1000 kg of hazardous waste/month (Resource Conservation and Recovery Act (tracking hazardous waste)) - notification Organizations: ABBOTSFORD STATE BANK (CONTACT/OWNER)
Housing units lacking complete plumbing facilities: 1.0% Housing units lacking complete kitchen facilities: 2.9%
39.6%Bottled, tank, or LP gas
32.3%Utility gas
16.9%Wood
6.6%Electricity
3.6%Fuel oil, kerosene, etc.
1.1%No fuel used
Population in 1990: 1,797.
Place of birth for U.S.-born residents:
This state: 834
Northeast: 59
Midwest: 116
South: 23
West: 33
61% of the 54488 zip code residents lived in the same house 5 years ago. Out of people who lived in different houses, 34% lived in this county. Out of people who lived in different counties, 50% lived in Wisconsin.
93% of the 54488 zip code residents lived in the same house 1 year ago. Out of people who lived in different houses, 45% moved from this county. Out of people who lived in different houses, 38% moved from different county within same state. Out of people who lived in different houses, 15% moved from different state.
Private vs. public school enrollment:
Students in private schools in grades 1 to 8 (elementary and middle school): 42
Here:
35.5%
Wisconsin:
16.7%
Students in private schools in grades 9 to 12 (high school): 7
Here:
10.7%
Wisconsin:
12.5%
Students in private undergraduate colleges: 4
Here:
22.5%
Wisconsin:
17.5%
Occupation by median earnings in the past 12 months ($)
83,284Business and financial operations occupations
69,589Health diagnosing and treating practitioners and other technical occupations
58,806Life, physical, and social science occupations
55,690Education, training, and library occupations
55,203Production occupations
52,333Installation, maintenance, and repair occupations
Top industries in this zip code by the number of employees in 2005:
Accommodation and Food Services: Full-Service Restaurants (10-19 employees: 2 establishments)
Construction: Plumbing, Heating, and Air-Conditioning Contractors (5-9: 1)
Other Services (except Public Administration): Religious Organizations (5-9: 1)
Construction: Other Foundation, Structure, and Building Exterior Contractors (5-9: 1)
Other Services (except Public Administration): Automotive Body, Paint, and Interior Repair and Maintenance (5-9: 1)
Other Services (except Public Administration): General Automotive Repair (5-9: 1)
Construction: Residential Remodelers (1-4: 3)
Accommodation and Food Services: Drinking Places (Alcoholic Beverages) (1-4: 1)
Home Mortgage Disclosure Act Aggregated Statistics For Year 2009 (Based on 2 partial tracts)
A) FHA, FSA/RHS & VA Home Purchase Loans
B) Conventional Home Purchase Loans
C) Refinancings
D) Home Improvement Loans
F) Non-occupant Loans on < 5 Family Dwellings (A B C & D)
G) Loans On Manufactured Home Dwelling (A B C & D)
Number
Average Value
Number
Average Value
Number
Average Value
Number
Average Value
Number
Average Value
Number
Average Value
LOANS ORIGINATED
5
$96,552
15
$137,281
65
$138,086
5
$48,822
3
$67,453
3
$17,560
APPLICATIONS APPROVED, NOT ACCEPTED
0
$0
4
$117,800
4
$130,648
0
$0
0
$0
1
$20,560
APPLICATIONS DENIED
1
$148,720
5
$43,298
13
$109,949
1
$104,710
1
$90,900
4
$32,200
APPLICATIONS WITHDRAWN
0
$0
0
$0
6
$140,685
0
$0
0
$0
0
$0
FILES CLOSED FOR INCOMPLETENESS
0
$0
0
$0
3
$180,407
0
$0
0
$0
0
$0
Aggregated Statistics For Year 2008 (Based on 2 partial tracts)
A) FHA, FSA/RHS & VA Home Purchase Loans
B) Conventional Home Purchase Loans
C) Refinancings
D) Home Improvement Loans
E) Loans on Dwellings For 5+ Families
F) Non-occupant Loans on < 5 Family Dwellings (A B C & D)
G) Loans On Manufactured Home Dwelling (A B C & D)
Number
Average Value
Number
Average Value
Number
Average Value
Number
Average Value
Number
Average Value
Number
Average Value
Number
Average Value
LOANS ORIGINATED
6
$107,548
17
$133,449
34
$147,941
5
$68,608
1
$2,521,420
3
$171,950
1
$43,040
APPLICATIONS APPROVED, NOT ACCEPTED
1
$119,810
1
$124,950
4
$168,710
0
$0
0
$0
0
$0
0
$0
APPLICATIONS DENIED
2
$145,020
3
$111,993
12
$169,781
2
$55,085
0
$0
0
$0
2
$59,585
APPLICATIONS WITHDRAWN
0
$0
1
$138,760
6
$121,092
0
$0
0
$0
0
$0
0
$0
FILES CLOSED FOR INCOMPLETENESS
0
$0
0
$0
2
$83,190
0
$0
0
$0
0
$0
0
$0
Aggregated Statistics For Year 2007 (Based on 2 partial tracts)
A) FHA, FSA/RHS & VA Home Purchase Loans
B) Conventional Home Purchase Loans
C) Refinancings
D) Home Improvement Loans
F) Non-occupant Loans on < 5 Family Dwellings (A B C & D)
G) Loans On Manufactured Home Dwelling (A B C & D)
Number
Average Value
Number
Average Value
Number
Average Value
Number
Average Value
Number
Average Value
Number
Average Value
LOANS ORIGINATED
2
$71,145
24
$117,051
33
$108,381
9
$56,317
4
$108,085
2
$25,535
APPLICATIONS APPROVED, NOT ACCEPTED
0
$0
2
$123,020
5
$126,168
1
$47,860
0
$0
0
$0
APPLICATIONS DENIED
0
$0
2
$86,565
13
$128,727
3
$26,873
1
$134,900
1
$69,380
APPLICATIONS WITHDRAWN
0
$0
1
$47,860
8
$158,914
1
$153,850
1
$105,350
0
$0
FILES CLOSED FOR INCOMPLETENESS
0
$0
0
$0
2
$144,220
0
$0
0
$0
0
$0
Aggregated Statistics For Year 2006 (Based on 2 partial tracts)
A) FHA, FSA/RHS & VA Home Purchase Loans
B) Conventional Home Purchase Loans
C) Refinancings
D) Home Improvement Loans
E) Loans on Dwellings For 5+ Families
F) Non-occupant Loans on < 5 Family Dwellings (A B C & D)
G) Loans On Manufactured Home Dwelling (A B C & D)
Number
Average Value
Number
Average Value
Number
Average Value
Number
Average Value
Number
Average Value
Number
Average Value
Number
Average Value
LOANS ORIGINATED
1
$96,680
22
$121,136
46
$103,950
4
$25,375
1
$141,650
6
$131,638
3
$22,270
APPLICATIONS APPROVED, NOT ACCEPTED
0
$0
1
$57,170
2
$78,375
0
$0
0
$0
0
$0
0
$0
APPLICATIONS DENIED
1
$96,360
3
$45,610
19
$124,254
3
$47,003
0
$0
0
$0
4
$41,112
APPLICATIONS WITHDRAWN
1
$78,690
1
$58,460
9
$102,034
0
$0
0
$0
0
$0
1
$77,410
FILES CLOSED FOR INCOMPLETENESS
0
$0
0
$0
4
$127,758
0
$0
0
$0
0
$0
0
$0
Aggregated Statistics For Year 2005 (Based on 2 partial tracts)
A) FHA, FSA/RHS & VA Home Purchase Loans
B) Conventional Home Purchase Loans
C) Refinancings
D) Home Improvement Loans
F) Non-occupant Loans on < 5 Family Dwellings (A B C & D)
G) Loans On Manufactured Home Dwelling (A B C & D)
Number
Average Value
Number
Average Value
Number
Average Value
Number
Average Value
Number
Average Value
Number
Average Value
LOANS ORIGINATED
1
$42,080
22
$113,457
42
$108,619
6
$54,712
2
$203,480
3
$56,853
APPLICATIONS APPROVED, NOT ACCEPTED
0
$0
1
$120,450
5
$112,612
0
$0
0
$0
0
$0
APPLICATIONS DENIED
1
$73,550
5
$73,170
18
$91,846
3
$36,937
1
$56,530
3
$42,507
APPLICATIONS WITHDRAWN
0
$0
3
$132,870
8
$112,139
0
$0
0
$0
1
$76,450
FILES CLOSED FOR INCOMPLETENESS
0
$0
1
$82,870
5
$144,154
0
$0
0
$0
0
$0
Aggregated Statistics For Year 2004 (Based on 2 partial tracts)
A) FHA, FSA/RHS & VA Home Purchase Loans
B) Conventional Home Purchase Loans
C) Refinancings
D) Home Improvement Loans
F) Non-occupant Loans on < 5 Family Dwellings (A B C & D)
G) Loans On Manufactured Home Dwelling (A B C & D)
Number
Average Value
Number
Average Value
Number
Average Value
Number
Average Value
Number
Average Value
Number
Average Value
LOANS ORIGINATED
2
$115,955
22
$111,763
44
$98,579
7
$51,300
5
$107,474
1
$12,850
APPLICATIONS APPROVED, NOT ACCEPTED
0
$0
2
$81,585
3
$106,317
0
$0
0
$0
0
$0
APPLICATIONS DENIED
1
$62,310
2
$42,400
18
$83,691
3
$125,160
0
$0
3
$49,787
APPLICATIONS WITHDRAWN
0
$0
1
$76,450
9
$99,787
1
$53,320
0
$0
1
$31,800
FILES CLOSED FOR INCOMPLETENESS
0
$0
1
$70,020
3
$111,777
0
$0
0
$0
0
$0
Aggregated Statistics For Year 2003 (Based on 2 partial tracts)
A) FHA, FSA/RHS & VA Home Purchase Loans
B) Conventional Home Purchase Loans
C) Refinancings
D) Home Improvement Loans
F) Non-occupant Loans on < 5 Family Dwellings (A B C & D)
Number
Average Value
Number
Average Value
Number
Average Value
Number
Average Value
Number
Average Value
LOANS ORIGINATED
3
$94,003
24
$89,695
93
$101,855
4
$34,530
3
$59,530
APPLICATIONS APPROVED, NOT ACCEPTED
0
$0
1
$137,790
9
$102,141
0
$0
0
$0
APPLICATIONS DENIED
1
$93,150
3
$40,150
19
$92,015
0
$0
0
$0
APPLICATIONS WITHDRAWN
0
$0
1
$46,900
9
$108,851
1
$5,140
0
$0
FILES CLOSED FOR INCOMPLETENESS
0
$0
1
$51,070
2
$105,195
0
$0
0
$0
Aggregated Statistics For Year 2002 (Based on 2 partial tracts)
B) Conventional Home Purchase Loans
C) Refinancings
D) Home Improvement Loans
F) Non-occupant Loans on < 5 Family Dwellings (A B C & D)
Number
Average Value
Number
Average Value
Number
Average Value
Number
Average Value
LOANS ORIGINATED
22
$114,887
80
$99,845
9
$28,622
1
$119,490
APPLICATIONS APPROVED, NOT ACCEPTED
1
$75,800
5
$98,672
0
$0
0
$0
APPLICATIONS DENIED
1
$59,100
14
$65,525
1
$25,700
1
$5,460
APPLICATIONS WITHDRAWN
1
$107,600
5
$162,848
1
$13,490
0
$0
FILES CLOSED FOR INCOMPLETENESS
0
$0
1
$118,520
0
$0
0
$0
Aggregated Statistics For Year 2001 (Based on 2 partial tracts)
A) FHA, FSA/RHS & VA Home Purchase Loans
B) Conventional Home Purchase Loans
C) Refinancings
D) Home Improvement Loans
F) Non-occupant Loans on < 5 Family Dwellings (A B C & D)
Number
Average Value
Number
Average Value
Number
Average Value
Number
Average Value
Number
Average Value
LOANS ORIGINATED
2
$84,955
18
$82,352
53
$95,269
10
$26,242
2
$54,765
APPLICATIONS APPROVED, NOT ACCEPTED
0
$0
2
$90,095
7
$89,660
0
$0
0
$0
APPLICATIONS DENIED
1
$44,330
4
$96,440
13
$76,050
2
$16,865
0
$0
APPLICATIONS WITHDRAWN
0
$0
2
$77,730
5
$72,592
0
$0
0
$0
FILES CLOSED FOR INCOMPLETENESS
0
$0
1
$45,930
2
$101,980
0
$0
0
$0
Aggregated Statistics For Year 2000 (Based on 2 partial tracts)
A) FHA, FSA/RHS & VA Home Purchase Loans
B) Conventional Home Purchase Loans
C) Refinancings
D) Home Improvement Loans
F) Non-occupant Loans on < 5 Family Dwellings (A B C & D)
Number
Average Value
Number
Average Value
Number
Average Value
Number
Average Value
Number
Average Value
LOANS ORIGINATED
2
$69,860
18
$77,088
22
$61,977
7
$33,680
2
$76,125
APPLICATIONS APPROVED, NOT ACCEPTED
0
$0
3
$62,100
2
$48,500
1
$8,990
0
$0
APPLICATIONS DENIED
1
$62,960
7
$34,781
8
$58,016
2
$9,315
0
$0
APPLICATIONS WITHDRAWN
0
$0
3
$71,093
3
$48,607
0
$0
0
$0
FILES CLOSED FOR INCOMPLETENESS
0
$0
1
$52,680
0
$0
0
$0
0
$0
Aggregated Statistics For Year 1999 (Based on 1 partial tract)
A) FHA, FSA/RHS & VA Home Purchase Loans
B) Conventional Home Purchase Loans
C) Refinancings
D) Home Improvement Loans
F) Non-occupant Loans on < 5 Family Dwellings (A B C & D)


+$3,635
-$2,654
(% of AGI for various income ranges: 7.4% for AGIs $10k-25k, 3.2% for AGIs $25k-50k, -1.3% for AGIs $50k-75k, -1.1% for AGIs $75k-100k)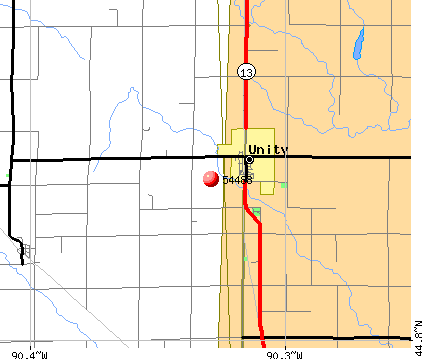 Nearest zip codes: 54421, 54479, 54405, 54446, 54425, 54422.


