Estimated zip code population in 2022: 2,001 Zip code population in 2010: 2,058 Zip code population in 2000: 1,704
Houses and condos: 833 Renter-occupied apartments: 153
% of renters here:
20%
State:
31%
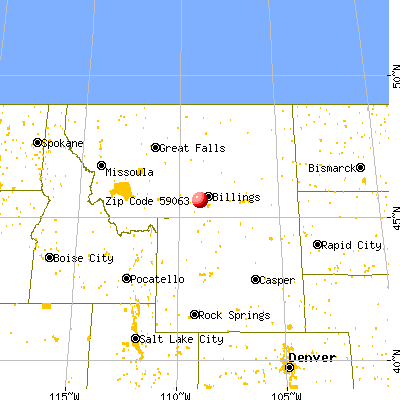
March 2022 cost of living index in zip code 59063: 89.1 (less than average, U.S. average is 100)
Land area: 69.6 sq. mi. Water area: 0.9 sq. mi.
Population density: 29 people per square mile
(very low).
OSM Map
General Map
Google Map
MSN Map
OSM Map
General Map
Google Map
MSN Map
OSM Map
General Map
Google Map
MSN Map
OSM Map
General Map
Google Map
MSN Map
Please wait while loading the map...
Real estate property taxes paid for housing units in 2022:
This zip code:
0.7% ($2,230)
Montana:
0.7% ($2,498)
Median real estate property taxes paid for housing units with mortgages in 2022: $2,300 (0.7%) Median real estate property taxes paid for housing units with no mortgage in 2022: $2,106 (0.7%)
Business Search- 14 Million verified businesses
Males: 988
(49.4%)
Females: 1,012
(50.6%)
For population 25 years and over in 59063:
High school or higher: 91.0%
Bachelor's degree or higher: 24.6%
Graduate or professional degree: 6.7%
Unemployed: 2.3%
Mean travel time to work (commute): 26.0 minutes
For population 15 years and over in 59063:
Never married: 23.7%
Now married: 63.6%
Separated: 0.0%
Widowed: 5.2%
Divorced: 7.5%
Zip code 59063 compared to state average:
Black race population percentage significantly below state average.
Foreign-born population percentage significantly below state average.
Renting percentage below state average.
Length of stay since moving in significantly above state average.
Estimated median house/condo value in 2022: $334,159
59063:
$334,159
Montana:
$366,400
According to our research of Montana and other state lists, there were 6 registered sex offenders living in 59063 zip code as of May 28, 2024. The ratio of all residents to sex offenders in zip code 59063 is 337 to 1. The ratio of registered sex offenders to all residents in this zip code is near the state average.
Median resident age:
This zip code:
37.4 years
Montana median age:
40.2 years
Average household size:
This zip code:
2.6 people
Montana:
2.4 people
Averages for the 2020 tax year for zip code 59063, filed in 2021:
Average Adjusted Gross Income (AGI) in 2020: $71,335 (Individual Income Tax Returns)
Here:
$71,335
State:
$70,533
Salary/wage: $61,541 (reported on 80.4% of returns)
Here:
$61,541
State:
$52,258
(% of AGI for various income ranges: 1302.2% for AGIs below $25k, 3586.9% for AGIs $25k-50k, 6508.2% for AGIs $50k-75k, 9508.8% for AGIs $75k-100k, 16432.0% for AGIs $100k-200k)
Taxable interest for individuals: $1,279 (reported on 34.8% of returns)
This zip code:
$1,279
Montana:
$1,928
(% of AGI for various income ranges: 36.1% for AGIs below $25k, 38.1% for AGIs $25k-50k, 98.2% for AGIs $50k-75k, 32.5% for AGIs $75k-100k, 122.0% for AGIs $100k-200k)
Ordinary dividends: $2,878 (reported on 20.5% of returns)
Here:
$2,878
State:
$7,554
(% of AGI for various income ranges: 22.2% for AGIs below $25k, 28.7% for AGIs $25k-50k, 152.7% for AGIs $50k-75k, 42.5% for AGIs $75k-100k, 223.3% for AGIs $100k-200k)
Net capital gain/loss in AGI: +$11,543 (reported on 18.8% of returns)
Here:
+$11,543
State:
+$26,730
(% of AGI for various income ranges: 27.8% for AGIs below $25k, 44.4% for AGIs $25k-50k, 84.5% for AGIs $50k-75k, 131.2% for AGIs $75k-100k, 1403.3% for AGIs $100k-200k)
Profit/loss from business: +$6,050 (reported on 14.3% of returns)
Here:
+$6,050
State:
+$13,757
(% of AGI for various income ranges: 65.6% for AGIs below $25k, 233.1% for AGIs $25k-50k, 303.6% for AGIs $50k-75k, 365.0% for AGIs $75k-100k)
Taxable individual retirement arrangement distribution: $22,900 (reported on 10.7% of returns)
59063:
$22,900
Montana:
$19,575
(% of AGI for various income ranges: 87.2% for AGIs below $25k, 398.1% for AGIs $25k-50k, 891.2% for AGIs $75k-100k, 827.3% for AGIs $100k-200k)
Total itemized deductions: $27,678 (reported on 8.0% of returns)
Here:
$27,678
State:
$33,125
(% of AGI for various income ranges: 902.7% for AGIs $50k-75k, 998.7% for AGIs $100k-200k)
Charity contributions: $6,820 (reported on 4.5% of returns)
Here:
$6,820
State:
$12,481
(% of AGI for various income ranges: 227.3% for AGIs $100k-200k)
Taxes paid: $7,511 (reported on 8.0% of returns)
59063:
$7,511
State:
$7,689
(% of AGI for various income ranges: 157.3% for AGIs $50k-75k, 335.3% for AGIs $100k-200k)
Earned income credit: $1,909 (reported on 9.8% of returns)
Here:
$1,909
State:
$2,035
(% of AGI for various income ranges: 63.9% for AGIs below $25k, 59.4% for AGIs $25k-50k)
Percentage of individuals using paid preparers for their 2020 taxes: 96.4%
Here:
96%
State:
94%
(% for various income ranges: 96.7% for AGIs below $25k, 95.7% for AGIs $25k-50k, 94.4% for AGIs $50k-75k, 92.3% for AGIs $75k-100k, 100.0% for AGIs $100k-200k, 100.0% for AGIs over 200k)
Averages for the 2012 tax year for zip code 59063, filed in 2013:
Average Adjusted Gross Income (AGI) in 2012: $56,768 (Individual Income Tax Returns)
Here:
$56,768
State:
$53,401
Salary/wage: $48,500 (reported on 84.2% of returns)
Here:
$48,500
State:
$40,976
(% of AGI for various income ranges: 68.2% for AGIs below $25k, 70.6% for AGIs $25k-50k, 80.7% for AGIs $50k-75k, 75.0% for AGIs $75k-100k, 67.9% for AGIs $100k-200k)
Taxable interest for individuals: $979 (reported on 35.8% of returns)
This zip code:
$979
Montana:
$1,689
(% of AGI for various income ranges: 1.9% for AGIs below $25k, 1.1% for AGIs $25k-50k, 0.3% for AGIs $50k-75k, 0.7% for AGIs $75k-100k, 0.3% for AGIs $100k-200k)
Ordinary dividends: $2,259 (reported on 17.9% of returns)
Here:
$2,259
State:
$5,585
(% of AGI for various income ranges: 2.0% for AGIs below $25k, 0.9% for AGIs $25k-50k, 0.3% for AGIs $50k-75k, 0.3% for AGIs $75k-100k, 0.8% for AGIs $100k-200k)
Net capital gain/loss in AGI: +$2,800 (reported on 17.9% of returns)
Here:
+$2,800
State:
+$14,401
(% of AGI for various income ranges: 1.2% for AGIs $25k-50k, 0.1% for AGIs $50k-75k, 2.5% for AGIs $75k-100k, 0.5% for AGIs $100k-200k)
Profit/loss from business: +$9,293 (reported on 14.7% of returns)
Here:
+$9,293
State:
+$10,980
(% of AGI for various income ranges: 4.8% for AGIs below $25k, 4.1% for AGIs $25k-50k, 2.7% for AGIs $50k-75k, 2.5% for AGIs $100k-200k)
Taxable individual retirement arrangement distribution: $14,245 (reported on 11.6% of returns)
59063:
$14,245
Montana:
$13,434
(% of AGI for various income ranges: 3.8% for AGIs below $25k, 6.4% for AGIs $25k-50k, 8.2% for AGIs $75k-100k)
Total itemized deductions: $19,000 (19% of AGI, reported on 33.7% of returns)
Here:
$19,000
State:
$21,750
Here:
19.4% of AGI
State:
20.5% of AGI
(% of AGI for various income ranges: 7.9% for AGIs below $25k, 8.4% for AGIs $25k-50k, 11.0% for AGIs $50k-75k, 12.3% for AGIs $75k-100k, 12.5% for AGIs $100k-200k)
Charity contributions: $2,674 (reported on 28.4% of returns)
Here:
$2,674
State:
$3,989
(% of AGI for various income ranges: 1.1% for AGIs $25k-50k, 1.3% for AGIs $50k-75k, 1.6% for AGIs $75k-100k, 1.5% for AGIs $100k-200k)
Taxes paid: $6,494 (reported on 33.7% of returns)
59063:
$6,494
State:
$7,640
(% of AGI for various income ranges: 1.1% for AGIs below $25k, 1.9% for AGIs $25k-50k, 3.1% for AGIs $50k-75k, 3.6% for AGIs $75k-100k, 5.5% for AGIs $100k-200k)
Earned income credit: $1,773 (reported on 11.6% of returns)
Here:
$1,773
State:
$2,015
(% of AGI for various income ranges: 2.7% for AGIs below $25k, 1.2% for AGIs $25k-50k)
Percentage of individuals using paid preparers for their 2012 taxes: 63.2%
Here:
63%
State:
57%
(% for various income ranges: 50.0% for AGIs below $25k, 63.6% for AGIs $25k-50k, 73.3% for AGIs $50k-75k, 69.2% for AGIs $75k-100k, 73.3% for AGIs $100k-200k)
Averages for the 2004 tax year for zip code 59063, filed in 2005:
Average Adjusted Gross Income (AGI) in 2004: $40,251 (Individual Income Tax Returns)
Here:
$40,251
State:
$37,845
Salary/wage: $36,759 (reported on 87.1% of returns)
Here:
$36,759
State:
$31,190
(% of AGI for various income ranges: 206.0% for AGIs below $10k, 70.0% for AGIs $10k-25k, 79.8% for AGIs $25k-50k, 88.8% for AGIs $50k-75k, 82.9% for AGIs $75k-100k, 51.5% for AGIs over 100k)
Taxable interest for individuals: $1,020 (reported on 47.4% of returns)
This zip code:
$1,020
Montana:
$1,879
(% of AGI for various income ranges: 3.6% for AGIs below $10k, 1.8% for AGIs $10k-25k, 1.6% for AGIs $25k-50k, 0.7% for AGIs $50k-75k, 1.2% for AGIs $75k-100k, 1.1% for AGIs over 100k)
Taxable dividends: $760 (reported on 21.0% of returns)
Here:
$760
State:
$3,070
(% of AGI for various income ranges: 2.0% for AGIs below $10k, 0.3% for AGIs $10k-25k, 0.3% for AGIs $25k-50k, 0.5% for AGIs $50k-75k, 0.3% for AGIs $75k-100k, 0.5% for AGIs over 100k)
Net capital gain/loss: +$2,931 (reported on 19.8% of returns)
Here:
+$2,931
State:
+$10,237
(% of AGI for various income ranges: -2.4% for AGIs below $10k, 0.6% for AGIs $10k-25k, 1.1% for AGIs $25k-50k, 1.2% for AGIs $50k-75k, 0.4% for AGIs $75k-100k, 4.9% for AGIs over 100k)
Profit/loss from business: +$5,226 (reported on 18.1% of returns)
Here:
+$5,226
State:
+$8,849
(% of AGI for various income ranges: 14.3% for AGIs below $10k, 5.9% for AGIs $10k-25k, 2.7% for AGIs $25k-50k, 1.5% for AGIs $50k-75k, 2.5% for AGIs $75k-100k)
IRA payment deduction: $2,783 (reported on 3.1% of returns)
59063:
$2,783
Montana:
$2,958
Total itemized deductions: $14,707 (23% of AGI, reported on 33.0% of returns)
Here:
$14,707
State:
$17,258
Here:
22.8% of AGI
State:
23.1% of AGI
(% of AGI for various income ranges: 10.9% for AGIs $10k-25k, 9.6% for AGIs $25k-50k, 12.1% for AGIs $50k-75k, 15.8% for AGIs $75k-100k, 13.7% for AGIs over 100k)
Charity contributions deductions: $2,029 (3% of AGI, reported on 27.8% of returns)
Here:
$2,029
State:
$2,921
Here:
3.1% of AGI
State:
3.7% of AGI
(% of AGI for various income ranges: 1.5% for AGIs $10k-25k, 1.0% for AGIs $25k-50k, 1.2% for AGIs $50k-75k, 2.6% for AGIs $75k-100k, 1.4% for AGIs over 100k)
Total tax: $4,202 (reported on 80.9% of returns)
59063:
$4,202
State:
$5,485
(% of AGI for various income ranges: 5.2% for AGIs below $10k, 4.5% for AGIs $10k-25k, 5.9% for AGIs $25k-50k, 8.1% for AGIs $50k-75k, 10.1% for AGIs $75k-100k, 15.5% for AGIs over 100k)
Earned income credit: $1,771 (reported on 9.5% of returns)
Here:
$1,771
State:
$1,604
Percentage of individuals using paid preparers for their 2004 taxes: 69.9%
Here:
70%
State:
63%
(% for various income ranges: 57.5% for AGIs below $10k, 70.5% for AGIs $10k-25k, 69.9% for AGIs $25k-50k, 79.2% for AGIs $50k-75k, 66.7% for AGIs $75k-100k, 71.4% for AGIs over 100k)
Household received Food Stamps/SNAP in the past 12 months: 34 Household did not receive Food Stamps/SNAP in the past 12 months: 743
Women who had a birth in the past 12 months: 20 (21 now married, 0 unmarried) Women who did not have a birth in the past 12 months: 410 (173 now married, 236 unmarried)
Housing units in zip code 59063 with a mortgage: 391 (21 second mortgage, 15 both second mortgage and home equity loan) Houses without a mortgage: 11
Median monthly owner costs for units with a mortgage: $1,641 Median monthly owner costs for units without a mortgage: $542
Residents with income below the poverty level in 2022:
This zip code:
6.2%
Whole state:
12.1%
Residents with income below 50% of the poverty level in 2022:
This zip code:
2.5%
Whole state:
6.3%
Median number of rooms in houses and condos:
Here:
6.9
State:
6.4
Median number of rooms in apartments:
Here:
4.7
State:
4.2
Notable locations in this zip code not listed on our city pages
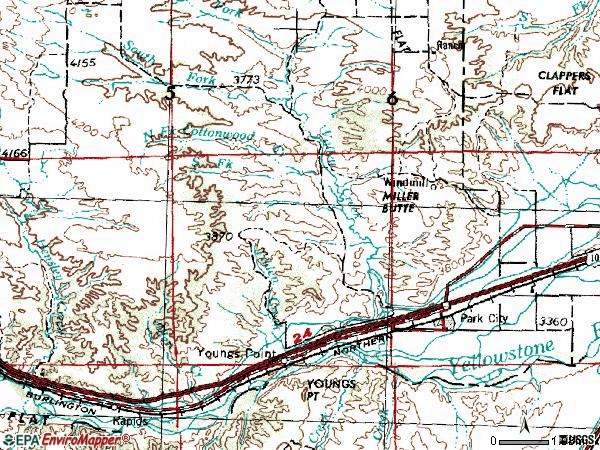
Notable locations in zip code 59063: Youngs Point (A), Homestead Island Fishing Access Site (B), Park City (C), Park City Rural Fire District - Park City Volunteer Fire Department (D), Park City Ambulance (E). Display/hide their locations on the map
Creeks: Allen Creek (A), Cottonwood Creek (B), Dry Creek (C), Swamp Creek (D), Tilden Creek (E), Tucker Creek (F), Valley Creek (G). Display/hide their locations on the map
Size of family households: 306 2-persons, 106 3-persons, 89 4-persons, 48 5-persons, 21 6-persons, 38 7-or-more-persons
Size of nonfamily households: 117 1-person, 48 2-persons
316 married couples with children.
62 single-parent households (5 men, 57 women).
97.6% of residents of 59063 zip code speak English at home.
0.4% of residents speak other Indo-European language at home (100% very well).
1.3% of residents speak Asian or Pacific Island language at home (100% very well).
0.2% of residents speak other language at home (100% very well).
Foreign born population: 0 (0.0%)
:
0.0%
Whole state:
2.3%
31%German
6%Italian
6%American
5%Irish
5%Norwegian
5%English
3%Croatian
Facilities with environmental interests located in this zip code:
DAVID ROBERTUS CAFO (32 BENEDICT GULCH RD in PARK CITY, MT)
National Pollutant Discharge Elimination System NON-MAJOR (Tracking pollutant discharge elimination systems) - permit Business SIC classification: BEEF CATTLE FEEDLOTS
T & C CATTLE FEEDERS (BEEF CATTLE FEEDLOT in PARK CITY, MT)
National Pollutant Discharge Elimination System NON-MAJOR (Tracking pollutant discharge elimination systems) - permit
TOWN OF PARK CITY WWTF (T2S R23E S33 NE in PARK CITY, MT)
National Pollutant Discharge Elimination System NON-MAJOR (Tracking pollutant discharge elimination systems) - permit Business SIC classification: SEWERAGE SYSTEMS Alternative names: PARK CITY -, PARK CITY WATER & SEWER DIST.
Housing units lacking complete plumbing facilities: 1.9% Housing units lacking complete kitchen facilities: 1.9%
72.3%Utility gas
17.1%Bottled, tank, or LP gas
6.6%Electricity
2.3%Other fuel
2.0%Wood
Population in 1990: 1,398. Population change in the 1990s: +306 (+21.9%).
Place of birth for U.S.-born residents:
This state: 1,105
Northeast: 115
Midwest: 226
South: 105
West: 441
64% of the 59063 zip code residents lived in the same house 5 years ago. Out of people who lived in different houses, 27% lived in this county. Out of people who lived in different counties, 50% lived in Montana.
93% of the 59063 zip code residents lived in the same house 1 year ago. Out of people who lived in different houses, 17% moved from this county. Out of people who lived in different houses, 47% moved from different county within same state. Out of people who lived in different houses, 41% moved from different state.
Private vs. public school enrollment:
Students in private schools in grades 1 to 8 (elementary and middle school): 83
Here:
36.4%
Montana:
15.3%
Students in private schools in grades 9 to 12 (high school): 47
Here:
33.4%
Montana:
12.2%
Students in private undergraduate colleges:
Here:
0.0%
Montana:
15.0%
Occupation by median earnings in the past 12 months ($)
119,782Architecture and engineering occupations
74,767Health diagnosing and treating practitioners and other technical occupations
55,714Management occupations
54,113Transportation occupations
47,360Production occupations
36,621Office and administrative support occupations
Companies with federal contracts located in this zip code:
R S CONSULTING COMPANY (616 1ST STREET SW in PARK CITY, MT; small business)
$5,375 with U.S. Army Corps of Engineers - civil program financing only for Architect - Engineer Services (including landscaping, interior layout, and designing). Signed on 2002-02-28. Completion date: 2002-03-31.
Top industries in this zip code by the number of employees in 2005:
Health Care and Social Assistance: Community Food Services (5-9: 1)
Educational Services: Elementary and Secondary Schools (5-9: 1)
Other Services (except Public Administration): Religious Organizations (5-9: 1)
Construction: New Single-Family Housing Construction (except Operative Builders) (1-4: 3)
Professional, Scientific, and Technical Services: Engineering Services (1-4: 2)
Fatal accident statistics in 2013:
Fatal accident count: 1
Vehicles involved in fatal accidents: 1
Fatal accidents caused by drunken drivers: 0
Fatalities: 1
Persons involved in fatal accidents: 1
Pedestrians involved in fatal accidents: 0
2002 - 2018 National Fire Incident Reporting System (NFIRS) incidents
Based on the data from the years 2002 - 2018 the average number of fire incidents per year is 12. The highest number of fires - 25 took place in 2002, and the least - 1 in 2005. The data has a dropping trend.
When looking into fire subcategories, the most incidents belonged to: Outside Fires (72.7%), and Mobile Property/Vehicle Fires (12.4%).
Fire incident types reported to NFIRS in Zip Code 59063


 Nearest zip codes: 59041, 59057, 59044, 59026, 59013, 59106.


 Based on the data from the years 2002 - 2018 the average number of fire incidents per year is 12. The highest number of fires - 25 took place in 2002, and the least - 1 in 2005. The data has a dropping trend.
 When looking into fire subcategories, the most incidents belonged to: Outside Fires (72.7%), and Mobile Property/Vehicle Fires (12.4%).