Estimated zip code population in 2022: 4,475 Zip code population in 2010: 4,448 Zip code population in 2000: 3,824
Houses and condos: 1,817 Renter-occupied apartments: 297
% of renters here:
17%
State:
33%
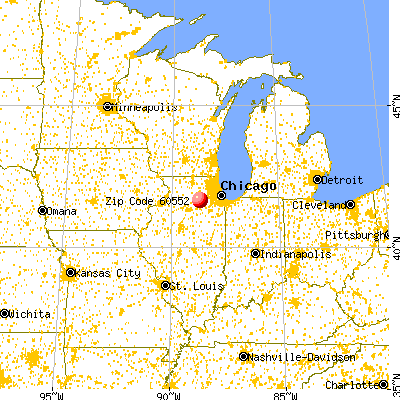
March 2022 cost of living index in zip code 60552: 98.3 (near average, U.S. average is 100)
Land area: 27.1 sq. mi. Water area: 0.3 sq. mi.
Population density: 165 people per square mile
(very low).
OSM Map
General Map
Google Map
MSN Map
OSM Map
General Map
Google Map
MSN Map
OSM Map
General Map
Google Map
MSN Map
OSM Map
General Map
Google Map
MSN Map
Please wait while loading the map...
Real estate property taxes paid for housing units in 2022:
This zip code:
2.2% ($5,522)
Illinois:
2.0% ($4,912)
Median real estate property taxes paid for housing units with mortgages in 2022: $5,716 (2.3%) Median real estate property taxes paid for housing units with no mortgage in 2022: $4,949 (1.9%)
Business Search- 14 Million verified businesses
Males: 2,079
(46.5%)
Females: 2,395
(53.5%)
For population 25 years and over in 60552:
High school or higher: 97.6%
Bachelor's degree or higher: 30.4%
Graduate or professional degree: 9.5%
Unemployed: 3.4%
Mean travel time to work (commute): 35.4 minutes
For population 15 years and over in 60552:
Never married: 23.8%
Now married: 65.1%
Separated: 0.3%
Widowed: 3.2%
Divorced: 7.6%
Zip code 60552 compared to state average:
Median household income above state average.
Black race population percentage significantly below state average.
Hispanic race population percentage significantly below state average.
Foreign-born population percentage significantly below state average.
Estimated median house/condo value in 2022: $250,653
60552:
$250,653
Illinois:
$251,600
According to our research of Illinois and other state lists, there were 3 registered sex offenders living in 60552 zip code as of May 28, 2024. The ratio of all residents to sex offenders in zip code 60552 is 1,588 to 1. The ratio of registered sex offenders to all residents in this zip code is lower than the state average.
Median resident age:
This zip code:
40.6 years
Illinois median age:
39.1 years
Average household size:
This zip code:
2.6 people
Illinois:
2.4 people
Averages for the 2020 tax year for zip code 60552, filed in 2021:
Average Adjusted Gross Income (AGI) in 2020: $74,258 (Individual Income Tax Returns)
Here:
$74,258
State:
$82,626
Salary/wage: $63,537 (reported on 81.0% of returns)
Here:
$63,537
State:
$66,640
(% of AGI for various income ranges: 1132.9% for AGIs below $25k, 3409.2% for AGIs $25k-50k, 5574.8% for AGIs $50k-75k, 8962.8% for AGIs $75k-100k, 16216.4% for AGIs $100k-200k, 87840.0% for AGIs over 200k)
Taxable interest for individuals: $1,012 (reported on 38.0% of returns)
This zip code:
$1,012
Illinois:
$2,376
(% of AGI for various income ranges: 19.0% for AGIs below $25k, 34.2% for AGIs $25k-50k, 44.8% for AGIs $50k-75k, 43.3% for AGIs $75k-100k, 80.7% for AGIs $100k-200k, 1010.0% for AGIs over 200k)
Ordinary dividends: $3,320 (reported on 22.7% of returns)
Here:
$3,320
State:
$9,061
(% of AGI for various income ranges: 34.3% for AGIs below $25k, 42.5% for AGIs $25k-50k, 56.7% for AGIs $50k-75k, 144.4% for AGIs $75k-100k, 153.2% for AGIs $100k-200k, 2440.0% for AGIs over 200k)
Net capital gain/loss in AGI: +$8,822 (reported on 19.0% of returns)
Here:
+$8,822
State:
+$31,684
(% of AGI for various income ranges: 10.5% for AGIs below $25k, 21.9% for AGIs $25k-50k, 85.9% for AGIs $50k-75k, 222.2% for AGIs $75k-100k, 348.9% for AGIs $100k-200k, 9425.0% for AGIs over 200k)
Profit/loss from business: +$7,431 (reported on 13.4% of returns)
Here:
+$7,431
State:
+$12,175
(% of AGI for various income ranges: 89.0% for AGIs below $25k, 47.5% for AGIs $25k-50k, 45.9% for AGIs $50k-75k, 268.9% for AGIs $75k-100k, 357.9% for AGIs $100k-200k)
Taxable individual retirement arrangement distribution: $16,620 (reported on 11.6% of returns)
60552:
$16,620
Illinois:
$21,613
(% of AGI for various income ranges: 65.7% for AGIs below $25k, 166.4% for AGIs $25k-50k, 209.6% for AGIs $50k-75k, 213.9% for AGIs $75k-100k, 831.8% for AGIs $100k-200k)
Total itemized deductions: $23,168 (reported on 8.8% of returns)
Here:
$23,168
State:
$34,948
(% of AGI for various income ranges: 169.4% for AGIs $25k-50k, 317.4% for AGIs $50k-75k, 345.6% for AGIs $75k-100k, 556.4% for AGIs $100k-200k, 3775.0% for AGIs over 200k)
Charity contributions: $6,533 (reported on 5.6% of returns)
Here:
$6,533
State:
$13,122
(% of AGI for various income ranges: 70.0% for AGIs $50k-75k, 212.5% for AGIs $100k-200k)
Taxes paid: $7,863 (reported on 8.8% of returns)
60552:
$7,863
State:
$8,563
(% of AGI for various income ranges: 56.4% for AGIs $25k-50k, 121.1% for AGIs $50k-75k, 147.8% for AGIs $75k-100k, 177.5% for AGIs $100k-200k, 1005.0% for AGIs over 200k)
Earned income credit: $2,147 (reported on 8.8% of returns)
Here:
$2,147
State:
$2,311
(% of AGI for various income ranges: 64.8% for AGIs below $25k, 37.8% for AGIs $25k-50k)
Percentage of individuals using paid preparers for their 2020 taxes: 94.9%
Here:
95%
State:
93%
(% for various income ranges: 93.1% for AGIs below $25k, 95.6% for AGIs $25k-50k, 94.1% for AGIs $50k-75k, 96.2% for AGIs $75k-100k, 95.6% for AGIs $100k-200k, 100.0% for AGIs over 200k)
Averages for the 2012 tax year for zip code 60552, filed in 2013:
Average Adjusted Gross Income (AGI) in 2012: $60,092 (Individual Income Tax Returns)
Here:
$60,092
State:
$68,058
Salary/wage: $49,504 (reported on 82.9% of returns)
Here:
$49,504
State:
$55,396
(% of AGI for various income ranges: 70.2% for AGIs below $25k, 73.0% for AGIs $25k-50k, 75.3% for AGIs $50k-75k, 75.6% for AGIs $75k-100k, 74.2% for AGIs $100k-200k, 36.3% for AGIs over 200k)
Taxable interest for individuals: $1,331 (reported on 36.5% of returns)
This zip code:
$1,331
Illinois:
$1,969
(% of AGI for various income ranges: 1.6% for AGIs below $25k, 1.3% for AGIs $25k-50k, 0.9% for AGIs $50k-75k, 0.9% for AGIs $75k-100k, 0.4% for AGIs $100k-200k, 0.7% for AGIs over 200k)
Ordinary dividends: $3,158 (reported on 25.1% of returns)
Here:
$3,158
State:
$7,786
(% of AGI for various income ranges: 1.7% for AGIs below $25k, 0.9% for AGIs $25k-50k, 0.8% for AGIs $50k-75k, 1.6% for AGIs $75k-100k, 0.9% for AGIs $100k-200k, 2.5% for AGIs over 200k)
Net capital gain/loss in AGI: +$7,656 (reported on 16.1% of returns)
Here:
+$7,656
State:
+$22,183
(% of AGI for various income ranges: 0.2% for AGIs $50k-75k, 0.4% for AGIs $75k-100k, 0.8% for AGIs $100k-200k, 11.0% for AGIs over 200k)
Profit/loss from business: +$5,990 (reported on 13.7% of returns)
Here:
+$5,990
State:
+$12,903
(% of AGI for various income ranges: 4.4% for AGIs below $25k, 1.7% for AGIs $25k-50k, 0.2% for AGIs $50k-75k, 1.2% for AGIs $75k-100k, 2.0% for AGIs $100k-200k)
Taxable individual retirement arrangement distribution: $13,564 (reported on 13.3% of returns)
60552:
$13,564
Illinois:
$17,929
(% of AGI for various income ranges: 4.0% for AGIs below $25k, 3.5% for AGIs $25k-50k, 2.4% for AGIs $50k-75k, 1.9% for AGIs $75k-100k, 5.2% for AGIs $100k-200k)
Total itemized deductions: $20,761 (22% of AGI, reported on 45.0% of returns)
Here:
$20,761
State:
$26,433
Here:
21.9% of AGI
State:
19.2% of AGI
(% of AGI for various income ranges: 18.1% for AGIs below $25k, 13.7% for AGIs $25k-50k, 16.2% for AGIs $50k-75k, 16.5% for AGIs $75k-100k, 15.8% for AGIs $100k-200k, 13.8% for AGIs over 200k)
Charity contributions: $2,938 (reported on 34.6% of returns)
Here:
$2,938
State:
$4,525
(% of AGI for various income ranges: 1.3% for AGIs below $25k, 1.5% for AGIs $25k-50k, 1.4% for AGIs $50k-75k, 1.8% for AGIs $75k-100k, 1.9% for AGIs $100k-200k, 1.7% for AGIs over 200k)
Taxes paid: $8,916 (reported on 45.0% of returns)
60552:
$8,916
State:
$11,968
(% of AGI for various income ranges: 6.2% for AGIs below $25k, 4.8% for AGIs $25k-50k, 6.4% for AGIs $50k-75k, 7.4% for AGIs $75k-100k, 7.6% for AGIs $100k-200k, 6.1% for AGIs over 200k)
Earned income credit: $2,025 (reported on 13.3% of returns)
Here:
$2,025
State:
$2,349
(% of AGI for various income ranges: 5.0% for AGIs below $25k, 1.0% for AGIs $25k-50k)
Percentage of individuals using paid preparers for their 2012 taxes: 59.2%
Here:
59%
State:
57%
(% for various income ranges: 52.2% for AGIs below $25k, 59.6% for AGIs $25k-50k, 59.4% for AGIs $50k-75k, 65.5% for AGIs $75k-100k, 65.5% for AGIs $100k-200k, 80.0% for AGIs over 200k)
Averages for the 2004 tax year for zip code 60552, filed in 2005:
Average Adjusted Gross Income (AGI) in 2004: $50,812 (Individual Income Tax Returns)
Here:
$50,812
State:
$54,625
Salary/wage: $44,308 (reported on 87.1% of returns)
Here:
$44,308
State:
$46,811
(% of AGI for various income ranges: 120.6% for AGIs below $10k, 70.5% for AGIs $10k-25k, 80.8% for AGIs $25k-50k, 84.2% for AGIs $50k-75k, 85.0% for AGIs $75k-100k, 58.6% for AGIs over 100k)
Taxable interest for individuals: $1,335 (reported on 52.9% of returns)
This zip code:
$1,335
Illinois:
$2,101
(% of AGI for various income ranges: 7.6% for AGIs below $10k, 3.6% for AGIs $10k-25k, 2.1% for AGIs $25k-50k, 1.2% for AGIs $50k-75k, 1.0% for AGIs $75k-100k, 0.7% for AGIs over 100k)
Taxable dividends: $1,835 (reported on 28.3% of returns)
Here:
$1,835
State:
$4,306
(% of AGI for various income ranges: 3.9% for AGIs below $10k, 1.8% for AGIs $10k-25k, 0.8% for AGIs $25k-50k, 0.7% for AGIs $50k-75k, 0.7% for AGIs $75k-100k, 1.4% for AGIs over 100k)
Net capital gain/loss: +$3,836 (reported on 20.0% of returns)
Here:
+$3,836
State:
+$17,321
(% of AGI for various income ranges: -1.4% for AGIs below $10k, 0.2% for AGIs $10k-25k, -0.2% for AGIs $25k-50k, 0.2% for AGIs $50k-75k, 1.7% for AGIs $75k-100k, 3.8% for AGIs over 100k)
Profit/loss from business: +$8,519 (reported on 14.9% of returns)
Here:
+$8,519
State:
+$11,771
(% of AGI for various income ranges: -3.5% for AGIs below $10k, 3.7% for AGIs $10k-25k, 1.1% for AGIs $25k-50k, 2.2% for AGIs $50k-75k, 1.9% for AGIs $75k-100k, 4.0% for AGIs over 100k)
Profit/loss from farming: +$1,512 (reported on 1.9% of returns)
Here:
+$1,512
State:
+$2,327
(% of AGI for various income ranges: 2.2% for AGIs below $10k, 0.7% for AGIs $10k-25k, -0.1% for AGIs $50k-75k)
IRA payment deduction: $3,408 (reported on 3.6% of returns)
60552:
$3,408
Illinois:
$3,087
(% of AGI for various income ranges: 0.7% for AGIs $10k-25k, 0.3% for AGIs $25k-50k, 0.2% for AGIs $50k-75k, 0.2% for AGIs $75k-100k, 0.2% for AGIs over 100k)
Total itemized deductions: $16,875 (22% of AGI, reported on 47.1% of returns)
Here:
$16,875
State:
$20,239
Here:
22.3% of AGI
State:
19.5% of AGI
(% of AGI for various income ranges: 25.1% for AGIs below $10k, 16.7% for AGIs $10k-25k, 16.3% for AGIs $25k-50k, 18.5% for AGIs $50k-75k, 17.1% for AGIs $75k-100k, 11.3% for AGIs over 100k)
Charity contributions deductions: $2,292 (3% of AGI, reported on 40.2% of returns)
Here:
$2,292
State:
$3,719
Here:
2.9% of AGI
State:
3.4% of AGI
(% of AGI for various income ranges: 1.6% for AGIs below $10k, 1.4% for AGIs $10k-25k, 1.8% for AGIs $25k-50k, 1.6% for AGIs $50k-75k, 2.0% for AGIs $75k-100k, 1.9% for AGIs over 100k)
Total tax: $7,109 (reported on 79.5% of returns)
60552:
$7,109
State:
$9,882
(% of AGI for various income ranges: 2.6% for AGIs below $10k, 4.1% for AGIs $10k-25k, 7.1% for AGIs $25k-50k, 8.0% for AGIs $50k-75k, 9.8% for AGIs $75k-100k, 18.7% for AGIs over 100k)
Earned income credit: $1,503 (reported on 7.7% of returns)
Here:
$1,503
State:
$1,788
Percentage of individuals using paid preparers for their 2004 taxes: 59.3%
Here:
59%
State:
61%
(% for various income ranges: 48.2% for AGIs below $10k, 58.5% for AGIs $10k-25k, 60.5% for AGIs $25k-50k, 65.7% for AGIs $50k-75k, 63.1% for AGIs $75k-100k, 61.1% for AGIs over 100k)
Likely homosexual households (counted as self-reported same-sex unmarried-partner households)
Lesbian couples: 0.1% of all households
Gay men: 0.0% of all households
Household received Food Stamps/SNAP in the past 12 months: 106 Household did not receive Food Stamps/SNAP in the past 12 months: 1,573
Women who had a birth in the past 12 months: 74 (71 now married, 1 unmarried) Women who did not have a birth in the past 12 months: 971 (463 now married, 505 unmarried)
Housing units in zip code 60552 with a mortgage: 949 (156 second mortgage, 141 both second mortgage and home equity loan) Houses without a mortgage: 11
Median monthly owner costs for units with a mortgage: $1,815 Median monthly owner costs for units without a mortgage: $805
Residents with income below the poverty level in 2022:
This zip code:
5.1%
Whole state:
11.9%
Residents with income below 50% of the poverty level in 2022:
This zip code:
2.9%
Whole state:
5.7%
Median number of rooms in houses and condos:
Here:
6.8
State:
6.4
Median number of rooms in apartments:
Here:
6.1
State:
4.1
Notable locations in this zip code not listed on our city pages
Size of family households: 632 2-persons, 236 3-persons, 212 4-persons, 158 5-persons, 27 6-persons, 6 7-or-more-persons
Size of nonfamily households: 355 1-person, 20 2-persons, 32 3-persons
690 married couples with children.
147 single-parent households (57 men, 90 women).
96.3% of residents of 60552 zip code speak English at home.
0.9% of residents speak Spanish at home (73% very well, 27% well).
0.4% of residents speak other Indo-European language at home (100% very well).
2.0% of residents speak other language at home (100% very well).
Foreign born population: 108 (2.4%) (51.1% of them are naturalized citizens)
This zip code:
2.4%
Whole state:
14.4%
34%Cabo Verde
24%Malaysia
10%Honduras
7%St. Vincent and the Grenadines
2%France
19%German
10%American
9%European
9%Norwegian
8%English
8%Irish
5%Polish
Year of entry for the foreign-born population
852010 or later
82000 to 2009
11990 to 1999
25Before 1990
Facilities with environmental interests located in this zip code:
IMPERIAL MARBLE CORP (327 E. LASALLE ST. in SOMONAUK, IL)
STATE MASTER (Illinois EPA Project) - HAZARDOUS WASTE PROGRAM, AIR PROGRAM STATE MASTER (Illinois EPA Project) - National Pollutant Discharge Elimination System Permit AIR MAJOR (AIRS/AFS) CRITERIA AND HAZARDOUS AIR POLLUTANT INVENTORY (Inventory of air pollution sources) HAZARDOUS WASTE BIENNIAL REPORTER (Resource Conservation and Recovery Act (tracking hazardous waste)) Large Quantity Generators, more that 1000 kg of hazardous waste/month (Resource Conservation and Recovery Act (tracking hazardous waste)) - notification TRI REPORTER (Tracking of toxic chemicals releasing facilities) Business SIC classification: PLASTICS PRODUCTS Business NAICS classification: PLASTICS PLUMBING FIXTURE MANUFACTURING.; PLASTICS PLUMBING FIXTURE MANUFACTURING. Organizations: IMPERIAL MARBLE CORPORATION (CONTACT/OPERATOR)
, ESTATE OF FRANK N WILLIAMS SR (CONTACT/OWNER)
JIMS BODY SHOP (215 E NORTH in SOMONAUK, IL)
STATE MASTER (Illinois EPA Project) - HAZARDOUS WASTE PROGRAM, SCRAP TIRE MANAGEMENT Conditionally Exempt Small Quantity Generators, less than 100 kg/month of hazardous waste (Resource Conservation and Recovery Act (tracking hazardous waste)) - notification Organizations: GERLICK JAMES E (CONTACT/OWNER)
LAKE HOLIDAY UTILITIES WTP (SERENA ROAD in SOMONAUK, IL)
STATE MASTER (Illinois EPA Project) - National Pollutant Discharge Elimination System Permit National Pollutant Discharge Elimination System NON-MAJOR (Tracking pollutant discharge elimination systems) - permit Business SIC classification: WATER SUPPLY
DEMIAN, AL (470 MARKET in SOMONAUK, IL)
STATE MASTER (Illinois EPA Project) - HAZARDOUS WASTE PROGRAM Small Quantity Generators, between 100 kg and 1000 kg of hazardous waste/month (Resource Conservation and Recovery Act (tracking hazardous waste)) - notification Organizations: DEMIAN ALBERT J (CONTACT/OWNER)
Alternative names: DEMIAN AL MR
JAMES R WOOD ELEM SCHOOL (PO BOX 278 in SOMONAUK, IL)
(National Center for Education Statistics) - STATE ID-1601943202001 Organizations: SOMONAUK C U SCHOOL DIST 432 (SCHOOL DISTRICT)
PRECISION ENTERPRISES INC (145 W MARKET ST in SOMONAUK, IL)
(Resource Conservation and Recovery Act (tracking hazardous waste))
Housing units lacking complete plumbing facilities: 0.1% Housing units lacking complete kitchen facilities: 0.4%
86.0%Utility gas
7.7%Electricity
5.7%Bottled, tank, or LP gas
Population in 1990: 1,475. Population change in the 1990s: +2,349 (+159.3%).
Place of birth for U.S.-born residents:
This state: 3,816
Northeast: 7
Midwest: 299
South: 178
West: 43
63% of the 60552 zip code residents lived in the same house 5 years ago. Out of people who lived in different houses, 18% lived in this county. Out of people who lived in different counties, 50% lived in Illinois.
93% of the 60552 zip code residents lived in the same house 1 year ago. Out of people who lived in different houses, 0% moved from this county. Out of people who lived in different houses, 105% moved from different county within same state. Out of people who lived in different houses, 0% moved from different state. Out of people who lived in different houses, 1% moved from abroad.
Private vs. public school enrollment:
Students in private schools in grades 1 to 8 (elementary and middle school): 11
Here:
2.7%
Illinois:
13.3%
Students in private schools in grades 9 to 12 (high school): 7
Here:
3.4%
Illinois:
9.9%
Students in private undergraduate colleges: 20
Here:
12.8%
Illinois:
27.4%
Occupation by median earnings in the past 12 months ($)
108,136Business and financial operations occupations
100,237Sales and related occupations
98,053Construction and extraction occupations
80,167Computer and mathematical occupations
79,207Architecture and engineering occupations
70,192Health diagnosing and treating practitioners and other technical occupations
Top industries in this zip code by the number of employees in 2005:
Health Care and Social Assistance: Child Day Care Services (50-99 employees: 1 establishment)
Other Services (except Public Administration): Funeral Homes and Funeral Services (20-49: 1, 5-9: 1)
Detailed PMIC statistics for the following Tracts:0019.00
2002 - 2018 National Fire Incident Reporting System (NFIRS) incidents
According to the data from the years 2002 - 2018 the average number of fires per year is 23. The highest number of fires - 39 took place in 2012, and the least - 11 in 2018. The data has a declining trend.
When looking into fire subcategories, the most incidents belonged to: Structure Fires (49.9%), and Outside Fires (37.9%).
Fire incident types reported to NFIRS in Zip Code 60552


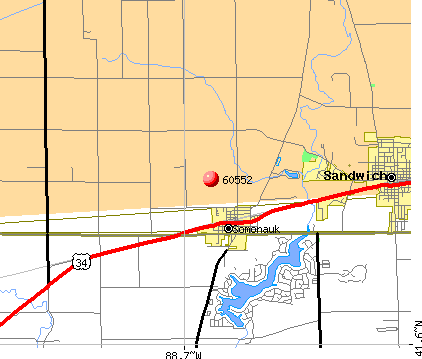 Nearest zip codes: 60548, 60531, 60556, 60520, 60551, 60537.


 According to the data from the years 2002 - 2018 the average number of fires per year is 23. The highest number of fires - 39 took place in 2012, and the least - 11 in 2018. The data has a declining trend.
 When looking into fire subcategories, the most incidents belonged to: Structure Fires (49.9%), and Outside Fires (37.9%).