Estimated zip code population in 2022: 2,185 Zip code population in 2010: 2,007 Zip code population in 2000: 1,797
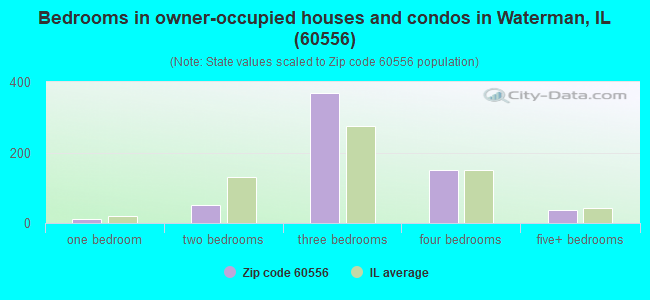
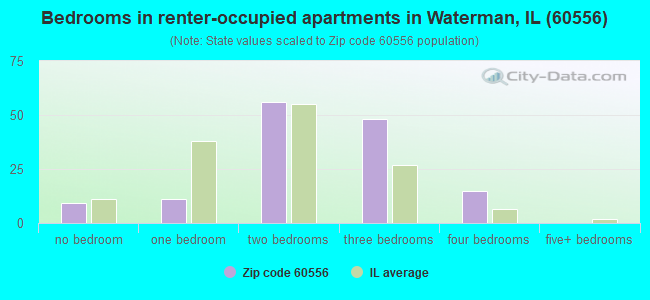
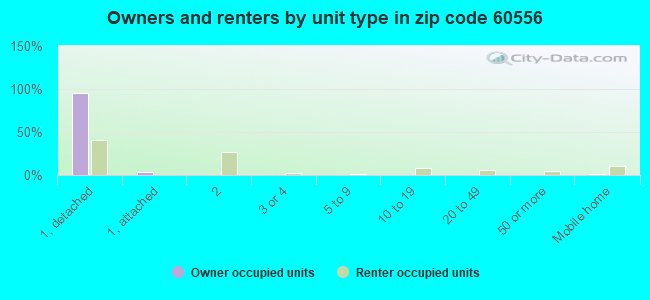
Houses and condos: 766 Renter-occupied apartments: 141
% of renters here:
19%
State:
33%
March 2022 cost of living index in zip code 60556: 93.1 (less than average, U.S. average is 100)
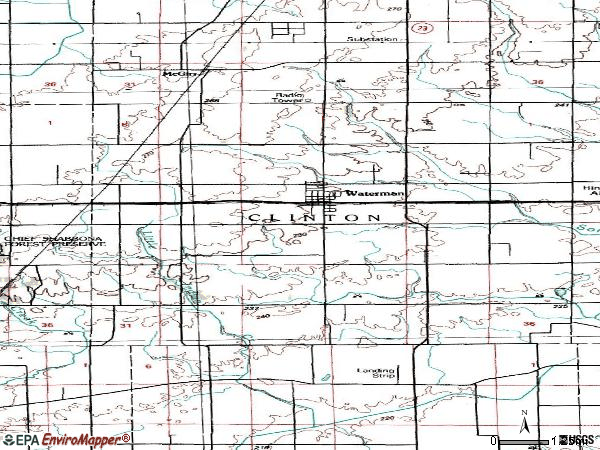
Land area: 52.3 sq. mi. Water area: 0.1 sq. mi.
Population density: 42 people per square mile
(very low).
OSM Map
General Map
Google Map
MSN Map
OSM Map
General Map
Google Map
MSN Map
OSM Map
General Map
Google Map
MSN Map
OSM Map
General Map
Google Map
MSN Map
Please wait while loading the map...
Real estate property taxes paid for housing units in 2022:
This zip code:
1.9% ($4,484)
Illinois:
2.0% ($4,912)
Median real estate property taxes paid for housing units with mortgages in 2022: $4,480 (1.8%) Median real estate property taxes paid for housing units with no mortgage in 2022: $4,450 (2.1%)
Business Search- 14 Million verified businesses
Males: 999
(45.7%)
Females: 1,185
(54.3%)
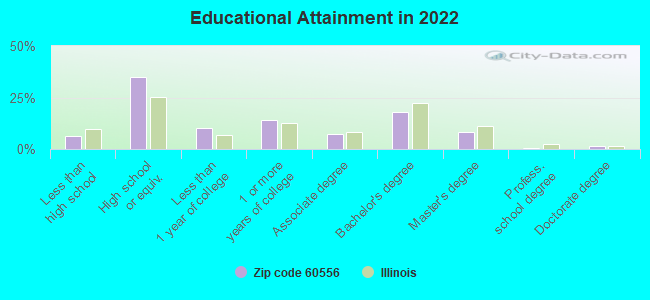
For population 25 years and over in 60556:
High school or higher: 93.0%
Bachelor's degree or higher: 27.5%
Graduate or professional degree: 9.7%
Unemployed: 1.5%
Mean travel time to work (commute): 35.9 minutes
For population 15 years and over in 60556:
Never married: 26.2%
Now married: 59.6%
Separated: 0.5%
Widowed: 2.4%
Divorced: 11.2%
Zip code 60556 compared to state average:
Unemployed percentage significantly below state average.
Black race population percentage significantly below state average.
Hispanic race population percentage below state average.
Foreign-born population percentage significantly below state average.
Renting percentage below state average.
Length of stay since moving in significantly above state average.
Number of rooms per house above state average.
Percentage of population with a bachelor's degree or higher below state average.
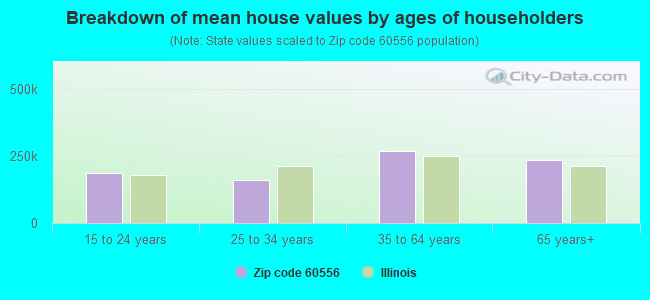
Estimated median house/condo value in 2022: $236,026
60556:
$236,026
Illinois:
$251,600
According to our research of Illinois and other state lists, there were 2 registered sex offenders living in 60556 zip code as of May 28, 2024. The ratio of all residents to sex offenders in zip code 60556 is 877 to 1. The ratio of registered sex offenders to all residents in this zip code is near the state average.
Median resident age:
This zip code:
36.8 years
Illinois median age:
39.1 years
Average household size:
This zip code:
2.9 people
Illinois:
2.4 people
Averages for the 2020 tax year for zip code 60556, filed in 2021:
Average Adjusted Gross Income (AGI) in 2020: $65,063 (Individual Income Tax Returns)
Here:
$65,063
State:
$82,626
Salary/wage: $53,455 (reported on 85.6% of returns)
Here:
$53,455
State:
$66,640
(% of AGI for various income ranges: 1144.2% for AGIs below $25k, 3600.5% for AGIs $25k-50k, 5940.0% for AGIs $50k-75k, 8442.2% for AGIs $75k-100k, 14460.0% for AGIs $100k-200k)
Taxable interest for individuals: $788 (reported on 35.1% of returns)
This zip code:
$788
Illinois:
$2,376
(% of AGI for various income ranges: 6.3% for AGIs below $25k, 21.5% for AGIs $25k-50k, 21.7% for AGIs $50k-75k, 36.7% for AGIs $75k-100k, 82.7% for AGIs $100k-200k)
Ordinary dividends: $2,740 (reported on 20.6% of returns)
Here:
$2,740
State:
$9,061
(% of AGI for various income ranges: 7.4% for AGIs below $25k, 11.0% for AGIs $25k-50k, 92.5% for AGIs $50k-75k, 50.0% for AGIs $75k-100k, 323.6% for AGIs $100k-200k)
Net capital gain/loss in AGI: +$5,812 (reported on 16.5% of returns)
Here:
+$5,812
State:
+$31,684
(% of AGI for various income ranges: 5.3% for AGIs below $25k, 4.0% for AGIs $25k-50k, 40.0% for AGIs $50k-75k, 195.6% for AGIs $75k-100k, 625.5% for AGIs $100k-200k)
Profit/loss from business: +$8,607 (reported on 14.4% of returns)
Here:
+$8,607
State:
+$12,175
(% of AGI for various income ranges: 181.6% for AGIs below $25k, 36.0% for AGIs $25k-50k, 226.7% for AGIs $75k-100k, 530.9% for AGIs $100k-200k)
Taxable individual retirement arrangement distribution: $14,750 (reported on 8.2% of returns)
60556:
$14,750
Illinois:
$21,613
(% of AGI for various income ranges: 122.6% for AGIs below $25k, 325.8% for AGIs $50k-75k, 505.5% for AGIs $100k-200k)
Total itemized deductions: $29,483 (reported on 6.2% of returns)
Here:
$29,483
State:
$34,948
(% of AGI for various income ranges: 568.3% for AGIs $50k-75k, 988.2% for AGIs $100k-200k)
Charity contributions: $6,525 (reported on 4.1% of returns)
Here:
$6,525
State:
$13,122
(% of AGI for various income ranges: 17.0% for AGIs $25k-50k, 206.4% for AGIs $100k-200k)
Taxes paid: $8,733 (reported on 6.2% of returns)
60556:
$8,733
State:
$8,563
(% of AGI for various income ranges: 185.0% for AGIs $50k-75k, 274.5% for AGIs $100k-200k)
Earned income credit: $1,842 (reported on 12.4% of returns)
Here:
$1,842
State:
$2,311
(% of AGI for various income ranges: 70.5% for AGIs below $25k, 43.5% for AGIs $25k-50k)
Percentage of individuals using paid preparers for their 2020 taxes: 95.9%
Here:
96%
State:
93%
(% for various income ranges: 96.0% for AGIs below $25k, 95.8% for AGIs $25k-50k, 93.8% for AGIs $50k-75k, 91.7% for AGIs $75k-100k, 100.0% for AGIs $100k-200k, 100.0% for AGIs over 200k)
Averages for the 2012 tax year for zip code 60556, filed in 2013:
Average Adjusted Gross Income (AGI) in 2012: $61,874 (Individual Income Tax Returns)
Here:
$61,874
State:
$68,058
Salary/wage: $47,641 (reported on 85.4% of returns)
Here:
$47,641
State:
$55,396
(% of AGI for various income ranges: 69.7% for AGIs below $25k, 77.8% for AGIs $25k-50k, 80.2% for AGIs $50k-75k, 77.6% for AGIs $75k-100k, 72.2% for AGIs $100k-200k, 21.6% for AGIs over 200k)
Taxable interest for individuals: $813 (reported on 42.7% of returns)
This zip code:
$813
Illinois:
$1,969
(% of AGI for various income ranges: 2.3% for AGIs below $25k, 0.6% for AGIs $25k-50k, 0.2% for AGIs $50k-75k, 0.4% for AGIs $75k-100k, 0.4% for AGIs $100k-200k, 0.8% for AGIs over 200k)
Ordinary dividends: $3,171 (reported on 23.6% of returns)
Here:
$3,171
State:
$7,786
(% of AGI for various income ranges: 2.1% for AGIs below $25k, 0.5% for AGIs $25k-50k, 0.8% for AGIs $50k-75k, 1.1% for AGIs $75k-100k, 0.5% for AGIs $100k-200k, 2.9% for AGIs over 200k)
Net capital gain/loss in AGI: +$1,207 (reported on 15.7% of returns)
Here:
+$1,207
State:
+$22,183
(% of AGI for various income ranges: 0.3% for AGIs $50k-75k, 5.9% for AGIs $75k-100k, 1.2% for AGIs $100k-200k)
Profit/loss from business: +$9,538 (reported on 14.6% of returns)
Here:
+$9,538
State:
+$12,903
(% of AGI for various income ranges: 8.8% for AGIs below $25k, 4.2% for AGIs $25k-50k, 1.1% for AGIs $50k-75k, 2.7% for AGIs $75k-100k, 2.1% for AGIs $100k-200k)
Taxable individual retirement arrangement distribution: $12,850 (reported on 9.0% of returns)
60556:
$12,850
Illinois:
$17,929
Total itemized deductions: $19,269 (20% of AGI, reported on 39.3% of returns)
Here:
$19,269
State:
$26,433
Here:
20.2% of AGI
State:
19.2% of AGI
(% of AGI for various income ranges: 11.3% for AGIs below $25k, 11.3% for AGIs $25k-50k, 14.0% for AGIs $50k-75k, 14.5% for AGIs $75k-100k, 13.8% for AGIs $100k-200k, 7.2% for AGIs over 200k)
Charity contributions: $2,564 (reported on 31.5% of returns)
Here:
$2,564
State:
$4,525
(% of AGI for various income ranges: 1.0% for AGIs $25k-50k, 1.5% for AGIs $50k-75k, 1.1% for AGIs $75k-100k, 2.7% for AGIs $100k-200k)
Taxes paid: $8,058 (reported on 40.4% of returns)
60556:
$8,058
State:
$11,968
(% of AGI for various income ranges: 3.3% for AGIs below $25k, 3.9% for AGIs $25k-50k, 5.4% for AGIs $50k-75k, 6.6% for AGIs $75k-100k, 6.2% for AGIs $100k-200k, 4.1% for AGIs over 200k)
Earned income credit: $1,836 (reported on 12.4% of returns)
Here:
$1,836
State:
$2,349
(% of AGI for various income ranges: 4.3% for AGIs below $25k, 1.0% for AGIs $25k-50k)
Percentage of individuals using paid preparers for their 2012 taxes: 66.3%
Here:
66%
State:
57%
(% for various income ranges: 63.0% for AGIs below $25k, 70.0% for AGIs $25k-50k, 58.8% for AGIs $50k-75k, 63.6% for AGIs $75k-100k, 72.7% for AGIs $100k-200k, 100.0% for AGIs over 200k)
Averages for the 2004 tax year for zip code 60556, filed in 2005:
Average Adjusted Gross Income (AGI) in 2004: $46,382 (Individual Income Tax Returns)
Here:
$46,382
State:
$54,625
Salary/wage: $42,365 (reported on 85.3% of returns)
Here:
$42,365
State:
$46,811
(% of AGI for various income ranges: 148.2% for AGIs below $10k, 75.6% for AGIs $10k-25k, 80.4% for AGIs $25k-50k, 81.6% for AGIs $50k-75k, 82.4% for AGIs $75k-100k, 66.8% for AGIs over 100k)
Taxable interest for individuals: $1,343 (reported on 57.4% of returns)
This zip code:
$1,343
Illinois:
$2,101
(% of AGI for various income ranges: 23.1% for AGIs below $10k, 3.7% for AGIs $10k-25k, 1.5% for AGIs $25k-50k, 0.7% for AGIs $50k-75k, 1.6% for AGIs $75k-100k, 1.7% for AGIs over 100k)
Taxable dividends: $1,676 (reported on 26.6% of returns)
Here:
$1,676
State:
$4,306
(% of AGI for various income ranges: 17.1% for AGIs below $10k, 1.9% for AGIs $10k-25k, 1.0% for AGIs $25k-50k, 0.6% for AGIs $50k-75k, 0.9% for AGIs $75k-100k, 0.7% for AGIs over 100k)
Net capital gain/loss: +$5,312 (reported on 21.0% of returns)
Here:
+$5,312
State:
+$17,321
(% of AGI for various income ranges: 1.7% for AGIs below $10k, 0.2% for AGIs $10k-25k, 0.8% for AGIs $25k-50k, 0.5% for AGIs $50k-75k, 1.0% for AGIs $75k-100k, 7.5% for AGIs over 100k)
Profit/loss from business: +$5,586 (reported on 17.6% of returns)
Here:
+$5,586
State:
+$11,771
(% of AGI for various income ranges: 1.3% for AGIs below $10k, 0.1% for AGIs $10k-25k, 0.7% for AGIs $25k-50k, 4.1% for AGIs $50k-75k, -0.0% for AGIs $75k-100k, 3.4% for AGIs over 100k)
IRA payment deduction: $2,500 (reported on 2.7% of returns)
60556:
$2,500
Illinois:
$3,087
Total itemized deductions: $15,243 (22% of AGI, reported on 38.6% of returns)
Here:
$15,243
State:
$20,239
Here:
22.0% of AGI
State:
19.5% of AGI
(% of AGI for various income ranges: 43.5% for AGIs below $10k, 10.4% for AGIs $10k-25k, 12.8% for AGIs $25k-50k, 13.5% for AGIs $50k-75k, 14.2% for AGIs $75k-100k, 10.2% for AGIs over 100k)
Charity contributions deductions: $2,168 (3% of AGI, reported on 33.3% of returns)
Here:
$2,168
State:
$3,719
Here:
3.0% of AGI
State:
3.4% of AGI
(% of AGI for various income ranges: 5.0% for AGIs below $10k, 0.9% for AGIs $10k-25k, 1.7% for AGIs $25k-50k, 1.2% for AGIs $50k-75k, 1.3% for AGIs $75k-100k, 2.1% for AGIs over 100k)
Total tax: $5,950 (reported on 80.8% of returns)
60556:
$5,950
State:
$9,882
(% of AGI for various income ranges: 7.4% for AGIs below $10k, 5.0% for AGIs $10k-25k, 6.8% for AGIs $25k-50k, 8.7% for AGIs $50k-75k, 10.1% for AGIs $75k-100k, 16.7% for AGIs over 100k)
Earned income credit: $1,493 (reported on 8.9% of returns)
Here:
$1,493
State:
$1,788
Percentage of individuals using paid preparers for their 2004 taxes: 64.5%
Here:
64%
State:
61%
(% for various income ranges: 59.6% for AGIs below $10k, 57.0% for AGIs $10k-25k, 64.2% for AGIs $25k-50k, 74.4% for AGIs $50k-75k, 62.8% for AGIs $75k-100k, 71.7% for AGIs over 100k)
Household received Food Stamps/SNAP in the past 12 months: 66 Household did not receive Food Stamps/SNAP in the past 12 months: 687
Women who had a birth in the past 12 months: 47 (47 now married, 0 unmarried) Women who did not have a birth in the past 12 months: 546 (224 now married, 321 unmarried)
Housing units in zip code 60556 with a mortgage: 427 (30 second mortgage, 17 both second mortgage and home equity loan) Houses without a mortgage: 6
Median monthly owner costs for units with a mortgage: $1,623 Median monthly owner costs for units without a mortgage: $760
Residents with income below the poverty level in 2022:
This zip code:
11.2%
Whole state:
11.9%
Residents with income below 50% of the poverty level in 2022:
This zip code:
4.2%
Whole state:
5.7%
Median number of rooms in houses and condos:
Here:
7.3
State:
6.4
Median number of rooms in apartments:
Here:
5.3
State:
4.1
Notable locations in this zip code not listed on our city pages
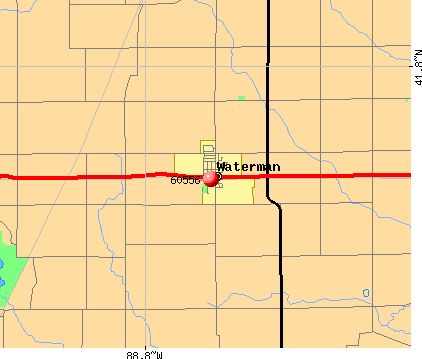
Notable locations in zip code 60556: Honey Hill Orchard (A), Kauffman Poultry Farm (B), Waterman City Hall (C), Waterman Fire Protection District (D). Display/hide their locations on the map
532 married couples with children.
46 single-parent households (24 men, 22 women).
93.2% of residents of 60556 zip code speak English at home.
5.0% of residents speak Spanish at home (50% very well, 22% well, 28% not well).
0.6% of residents speak other Indo-European language at home (100% very well).
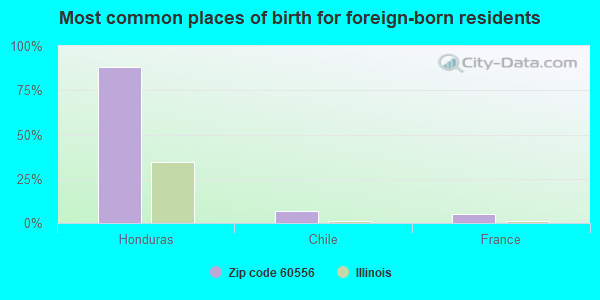
Foreign born population: 59 (2.7%) (59.5% of them are naturalized citizens)
This zip code:
2.7%
Whole state:
14.4%
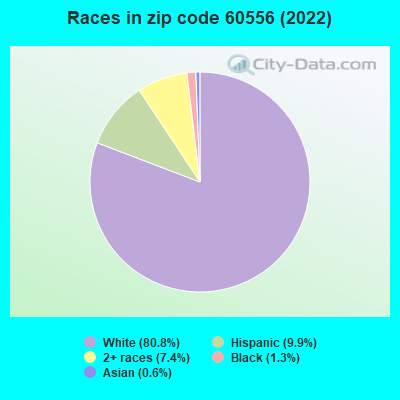
88%Honduras
7%Chile
5%France
27%German
11%American
10%European
6%English
6%Polish
5%Swedish
4%Italian
Year of entry for the foreign-born population
32010 or later
212000 to 2009
211990 to 1999
40Before 1990
Facilities with environmental interests located in this zip code:
MONSANTO CO (450 EAST ADAMS in WATERMAN, IL)
STATE MASTER (Illinois EPA Project) - SOLID WASTE PROGRAM, HAZARDOUS WASTE PROGRAM, AIR PROGRAM AIR MAJOR (AIRS/AFS) CRITERIA AND HAZARDOUS AIR POLLUTANT INVENTORY (Inventory of air pollution sources) (Resource Conservation and Recovery Act (tracking hazardous waste)) Organizations: DEKALB GENETICS CORP (CONTACT/OWNER)
Alternative names: DEKALB GENETICS CORP
PAUL JOHNSON INC (340 WEST ADAMS in WATERMAN, IL)
STATE MASTER (Illinois EPA Project) - National Pollutant Discharge Elimination System Permit National Pollutant Discharge Elimination System NON-MAJOR (Tracking pollutant discharge elimination systems) - permit Small Quantity Generators, between 100 kg and 1000 kg of hazardous waste/month (Resource Conservation and Recovery Act (tracking hazardous waste)) - notification Organizations: JOHNSON INC.?PAUL (CONTACT/OWNER)
, BOIES JOHN (CONTACT/OWNER)
Alternative names: JOHNSON, PAUL INC., JOHNSON PAUL TRUCKING, PAUL JOHNSON INC-WATERMAN
HINCKLEY GRAIN ELEVATOR - WATERMAN (RT 23 AND 30 in WATERMAN, IL)
STATE MASTER (Illinois EPA Project) - AIR PROGRAM AIR MINOR (AIRS/AFS) Business SIC classification: GRAIN AND FIELD BEANS
RAYMOND BOWMAN (WEST ADAMS STREET in WATERMAN, IL)
STATE MASTER (Illinois EPA Project) - SOLID WASTE PROGRAM, AIR PROGRAM AIR MINOR (AIRS/AFS) Business SIC classification: PETROLEUM BULK STATIONS AND TERMINALS
AMK AUTO BODY (215 E LINCOLN HWY in WATERMAN, IL)
STATE MASTER (Illinois EPA Project) - HAZARDOUS WASTE PROGRAM Conditionally Exempt Small Quantity Generators, less than 100 kg/month of hazardous waste (Resource Conservation and Recovery Act (tracking hazardous waste)) - notification Organizations: LAVE DAVID A (CONTACT/OWNER)
INDIAN CREEK MIDDLE SCHOOL (425 S ELM in WATERMAN, IL)
(Geographic Names Information System) (National Center for Education Statistics) - STATE ID-1601942501001 Organizations: INDIAN CREEK COMM UNIT DIST 425 (SCHOOL DISTRICT)
NORTHERN FS INCORPORATED WATERMAN (450 WEST ADAMS STREET in WATERMAN, IL)
AIR MINOR (AIRS/AFS) ENFORCEMENT/COMPLIANCE ACTIVITY (Integrated Compliance Information System) (Resource Conservation and Recovery Act (tracking hazardous waste)) Business SIC classification: FARM SUPPLIES Alternative names: DAHL & ASSOCIATES, INC., NORTHERN FS, INC.
HINTZSCHE FEED & GRAIN COMPANY (9391 STATE ROUTE 23 in WATERMAN, IL)
AIR SYNTHETIC MINOR (AIRS/AFS) CRITERIA AND HAZARDOUS AIR POLLUTANT INVENTORY (Inventory of air pollution sources) Business SIC classification: GRAIN AND FIELD BEANS
DEKALB CHOICE GENETICS (6375 MCGIRR in WATERMAN, IL)
Small Quantity Generators, between 100 kg and 1000 kg of hazardous waste/month (Resource Conservation and Recovery Act (tracking hazardous waste)) - notification
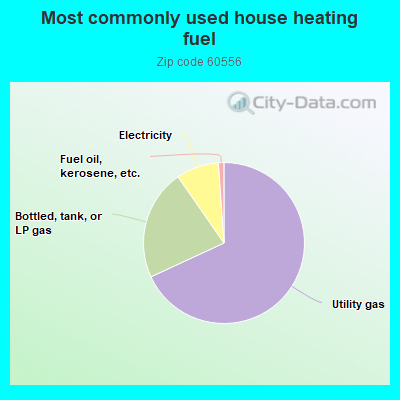
68.3%Utility gas
22.3%Bottled, tank, or LP gas
8.6%Electricity
1.1%Fuel oil, kerosene, etc.
Population in 1990: 1,914.
Place of birth for U.S.-born residents:
This state: 1,857
Northeast: 8
Midwest: 81
South: 43
West: 97
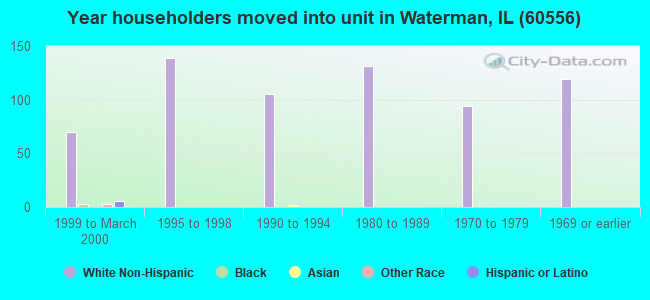
65% of the 60556 zip code residents lived in the same house 5 years ago. Out of people who lived in different houses, 41% lived in this county. Out of people who lived in different counties, 50% lived in Illinois.
95% of the 60556 zip code residents lived in the same house 1 year ago. Out of people who lived in different houses, 19% moved from this county. Out of people who lived in different houses, 85% moved from different county within same state.
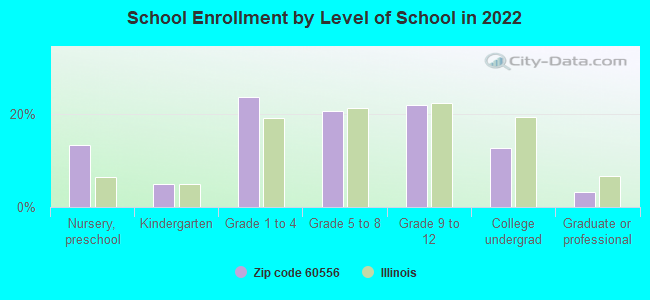
Private vs. public school enrollment:
Students in private schools in grades 1 to 8 (elementary and middle school): 42
Here:
15.6%
Illinois:
13.3%
Students in private schools in grades 9 to 12 (high school): 14
Here:
10.6%
Illinois:
9.9%
Students in private undergraduate colleges: 18
Here:
23.9%
Illinois:
27.4%
Occupation by median earnings in the past 12 months ($)
107,812Installation, maintenance, and repair occupations
80,238Construction and extraction occupations
68,668Business and financial operations occupations
65,462Management occupations
57,053Health diagnosing and treating practitioners and other technical occupations
52,914Computer and mathematical occupations
Top industries in this zip code by the number of employees in 2005:
Wholesale Trade: Grain and Field Bean Merchant Wholesalers (10-19 employees: 1 establishment, 5-9 employees: 1 establishment, 1-4 employees: 2 establishments)
Other Services (except Public Administration): Religious Organizations (5-9: 2, 1-4: 1)
Construction: Tile and Terrazzo Contractors (10-19: 1)
Accommodation and Food Services: Caterers (10-19: 1)
Other Services (except Public Administration): General Automotive Repair (10-19: 1)
Finance and Insurance: Commercial Banking (10-19: 1)
Accommodation and Food Services: Drinking Places (Alcoholic Beverages) (10-19: 1)
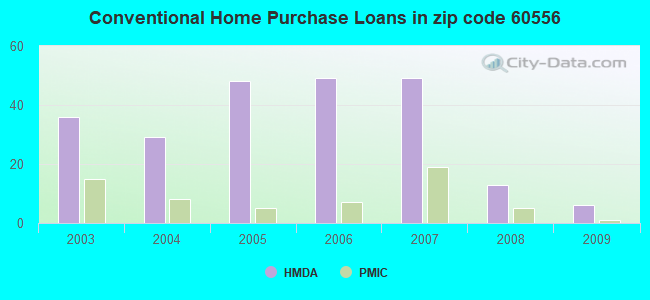
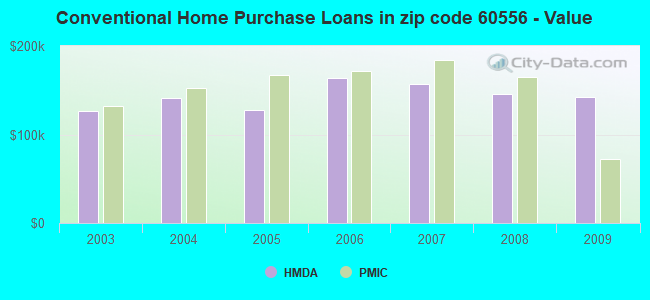
Detailed PMIC statistics for the following Tracts:0017.00
, 0018.00
2002 - 2018 National Fire Incident Reporting System (NFIRS) incidents
Based on the data from the years 2002 - 2018 the average number of fires per year is 14. The highest number of fires - 21 took place in 2018, and the least - 6 in 2002. The data has a rising trend.
When looking into fire subcategories, the most reports belonged to: Outside Fires (53.5%), and Structure Fires (32.6%).
Fire incident types reported to NFIRS in Zip Code 60556

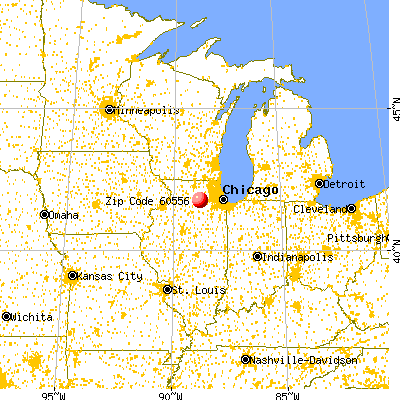


 Nearest zip codes: 60550, 60520, 60552, 60115, 60531, 60548.
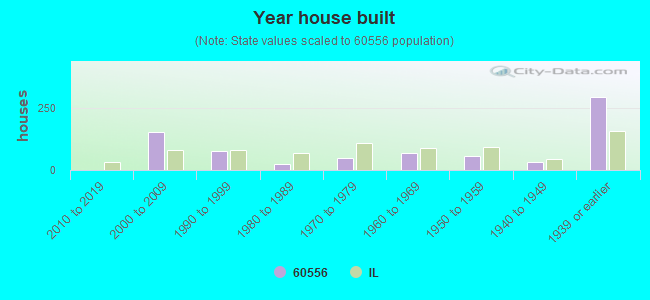


 Based on the data from the years 2002 - 2018 the average number of fires per year is 14. The highest number of fires - 21 took place in 2018, and the least - 6 in 2002. The data has a rising trend.
 When looking into fire subcategories, the most reports belonged to: Outside Fires (53.5%), and Structure Fires (32.6%).