Estimated zip code population in 2022: 509 Zip code population in 2010: 636 Zip code population in 2000: 739
Houses and condos: 255 Renter-occupied apartments: 64
% of renters here:
31%
State:
33%
March 2022 cost of living index in zip code 60949: 84.0 (less than average, U.S. average is 100)
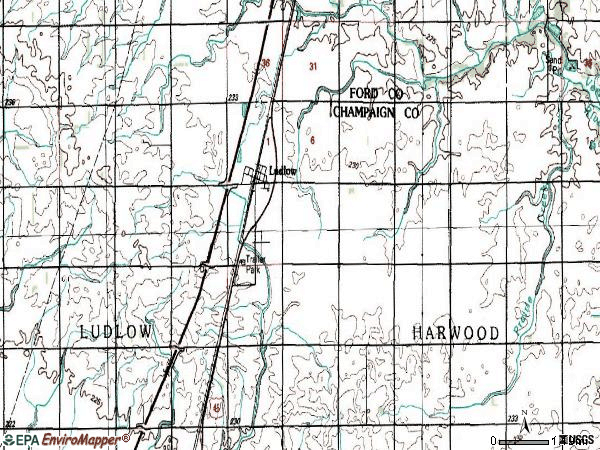
Land area: 25.2 sq. mi. Water area: 0.0 sq. mi.
Population density: 20 people per square mile
(very low).
OSM Map
General Map
Google Map
MSN Map
OSM Map
General Map
Google Map
MSN Map
OSM Map
General Map
Google Map
MSN Map
OSM Map
General Map
Google Map
MSN Map
Please wait while loading the map...
Real estate property taxes paid for housing units in 2022:
This zip code:
1.1% ($1,477)
Illinois:
2.0% ($4,912)
Median real estate property taxes paid for housing units with mortgages in 2022: $1,301 (1.6%) Median real estate property taxes paid for housing units with no mortgage in 2022: $1,830 (4.9%)
Business Search- 14 Million verified businesses
Males: 254
(49.9%)
Females: 255
(50.1%)
For population 25 years and over in 60949:
High school or higher: 90.0%
Bachelor's degree or higher: 12.2%
Graduate or professional degree: 7.2%
Unemployed: 7.0%
Mean travel time to work (commute): 24.8 minutes
For population 15 years and over in 60949:
Never married: 41.8%
Now married: 41.1%
Separated: 2.9%
Widowed: 3.5%
Divorced: 10.7%
Zip code 60949 compared to state average:
Median house value below state average.
Black race population percentage significantly below state average.
Hispanic race population percentage below state average.
Median age below state average.
Foreign-born population percentage significantly below state average.
Length of stay since moving in significantly above state average.
Number of college students below state average.
Percentage of population with a bachelor's degree or higher significantly below state average.
Averages for the 2020 tax year for zip code 60949, filed in 2021:
Average Adjusted Gross Income (AGI) in 2020: $46,471 (Individual Income Tax Returns)
Here:
$46,471
State:
$82,626
Salary/wage: $36,747 (reported on 79.2% of returns)
Here:
$36,747
State:
$66,640
(% of AGI for various income ranges: 1045.7% for AGIs below $25k, 3794.0% for AGIs $25k-50k, 8706.0% for AGIs $50k-75k)
Taxable interest for individuals: $200 (reported on 29.2% of returns)
This zip code:
$200
Illinois:
$2,376
(% of AGI for various income ranges: 7.1% for AGIs below $25k, 18.0% for AGIs $50k-75k)
Ordinary dividends: $1,067 (reported on 12.5% of returns)
Here:
$1,067
State:
$9,061
(% of AGI for various income ranges: 64.0% for AGIs $25k-50k)
Profit/loss from business: +$2,333 (reported on 12.5% of returns)
Here:
+$2,333
State:
+$12,175
(% of AGI for various income ranges: 100.0% for AGIs below $25k)
Earned income credit: $2,917 (reported on 25.0% of returns)
Here:
$2,917
State:
$2,311
(% of AGI for various income ranges: 177.1% for AGIs below $25k, 102.0% for AGIs $25k-50k)
Percentage of individuals using paid preparers for their 2020 taxes: 95.8%
Here:
96%
State:
93%
(% for various income ranges: 100.0% for AGIs below $25k, 85.7% for AGIs $25k-50k, 100.0% for AGIs $50k-75k, 100.0% for AGIs $100k-200k)
Averages for the 2012 tax year for zip code 60949, filed in 2013:
Average Adjusted Gross Income (AGI) in 2012: $34,650 (Individual Income Tax Returns)
Here:
$34,650
State:
$68,058
Salary/wage: $29,032 (reported on 89.3% of returns)
Here:
$29,032
State:
$55,396
(% of AGI for various income ranges: 84.5% for AGIs below $25k, 78.2% for AGIs $25k-50k, 85.5% for AGIs $50k-75k, 60.5% for AGIs $75k-100k)
Taxable interest for individuals: $386 (reported on 25.0% of returns)
This zip code:
$386
Illinois:
$1,969
Ordinary dividends: $900 (reported on 14.3% of returns)
Here:
$900
State:
$7,786
Profit/loss from business: +$3,467 (reported on 10.7% of returns)
Here:
+$3,467
State:
+$12,903
Total itemized deductions: $14,475 (21% of AGI, reported on 14.3% of returns)
Here:
$14,475
State:
$26,433
Here:
20.8% of AGI
State:
19.2% of AGI
Taxes paid: $5,850 (reported on 14.3% of returns)
60949:
$5,850
State:
$11,968
Earned income credit: $2,278 (reported on 32.1% of returns)
Here:
$2,278
State:
$2,349
(% of AGI for various income ranges: 9.8% for AGIs below $25k, 1.6% for AGIs $25k-50k)
Percentage of individuals using paid preparers for their 2012 taxes: 57.1%
Here:
57%
State:
57%
(% for various income ranges: 53.8% for AGIs below $25k, 55.6% for AGIs $25k-50k, 66.7% for AGIs $50k-75k, 66.7% for AGIs $75k-100k)
Averages for the 2004 tax year for zip code 60949, filed in 2005:
Average Adjusted Gross Income (AGI) in 2004: $31,470 (Individual Income Tax Returns)
Here:
$31,470
State:
$54,625
Salary/wage: $27,498 (reported on 84.2% of returns)
Here:
$27,498
State:
$46,811
(% of AGI for various income ranges: 89.8% for AGIs below $10k, 77.1% for AGIs $10k-25k, 77.7% for AGIs $25k-50k, 75.2% for AGIs $50k-75k, 59.5% for AGIs $75k-100k)
Taxable interest for individuals: $1,330 (reported on 34.6% of returns)
This zip code:
$1,330
Illinois:
$2,101
(% of AGI for various income ranges: 2.5% for AGIs below $10k, 0.3% for AGIs $10k-25k, 1.5% for AGIs $25k-50k, 1.0% for AGIs $50k-75k, 2.9% for AGIs $75k-100k)
Taxable dividends: $476 (reported on 14.1% of returns)
Here:
$476
State:
$4,306
Net capital gain/loss: +$286 (reported on 9.4% of returns)
Here:
+$286
State:
+$17,321
Profit/loss from business: +$5,224 (reported on 16.4% of returns)
Here:
+$5,224
State:
+$11,771
(% of AGI for various income ranges: 19.9% for AGIs below $10k, 7.4% for AGIs $10k-25k, 2.0% for AGIs $25k-50k, 1.4% for AGIs $50k-75k)
Profit/loss from farming: +$12,833 (reported on 4.0% of returns)
Here:
+$12,833
State:
+$2,327
Total itemized deductions: $13,512 (24% of AGI, reported on 14.4% of returns)
Here:
$13,512
State:
$20,239
Here:
24.1% of AGI
State:
19.5% of AGI
Charity contributions deductions: $2,381 (3% of AGI, reported on 7.0% of returns)
Here:
$2,381
State:
$3,719
Here:
3.5% of AGI
State:
3.4% of AGI
Total tax: $3,934 (reported on 70.8% of returns)
60949:
$3,934
State:
$9,882
(% of AGI for various income ranges: 3.4% for AGIs below $10k, 4.7% for AGIs $10k-25k, 7.7% for AGIs $25k-50k, 9.2% for AGIs $50k-75k, 14.2% for AGIs $75k-100k)
Earned income credit: $1,485 (reported on 22.8% of returns)
Here:
$1,485
State:
$1,788
Percentage of individuals using paid preparers for their 2004 taxes: 64.8%
Here:
65%
State:
61%
(% for various income ranges: 58.2% for AGIs below $10k, 65.9% for AGIs $10k-25k, 63.7% for AGIs $25k-50k, 72.5% for AGIs $50k-75k, 72.2% for AGIs $75k-100k)
Household received Food Stamps/SNAP in the past 12 months: 28 Household did not receive Food Stamps/SNAP in the past 12 months: 178
Women who had a birth in the past 12 months: 5 (5 now married, 0 unmarried) Women who did not have a birth in the past 12 months: 82 (42 now married, 39 unmarried)
Housing units in zip code 60949 with a mortgage: 64 Median monthly owner costs for units with a mortgage: $1,219 Median monthly owner costs for units without a mortgage: $535
Residents with income below the poverty level in 2022:
This zip code:
16.5%
Whole state:
11.9%
Residents with income below 50% of the poverty level in 2022:
This zip code:
5.1%
Whole state:
5.7%
Median number of rooms in houses and condos:
Here:
6.7
State:
6.4
Median number of rooms in apartments:
Here:
5.0
State:
4.1
Notable locations in this zip code not listed on our city pages
Size of family households: 71 2-persons, 5 3-persons, 37 4-persons, 4 5-persons, 3 7-or-more-persons
Size of nonfamily households: 67 1-person, 8 2-persons, 11 3-persons
60 married couples with children.
40 single-parent households (30 men, 10 women).
92.3% of residents of 60949 zip code speak English at home.
5.0% of residents speak Spanish at home (29% very well, 71% well).
1.5% of residents speak other Indo-European language at home (100% very well).
0.4% of residents speak Asian or Pacific Island language at home (100% very well).
Foreign born population: 2 (0.4%) (100.0% of them are naturalized citizens)
This zip code:
0.4%
Whole state:
14.4%
15%German
9%Italian
8%American
7%Irish
6%Polish
2%English
2%Norwegian
Year of entry for the foreign-born population
152010 or later
02000 to 2009
01990 to 1999
11Before 1990
Facilities with environmental interests located in this zip code:
LUDLOW COOP ELEVATOR CO (THOMAS AND CHESTNUT in LUDLOW, IL)
STATE MASTER (Illinois EPA Project) - AIR PROGRAM AIR MINOR (AIRS/AFS) CRITERIA AND HAZARDOUS AIR POLLUTANT INVENTORY (Inventory of air pollution sources) Business SIC classification: GRAIN AND FIELD BEANS Alternative names: LUDLOW COOP ELEV. CO.
LUDLOW WTP (LUDLOW STREET in LUDLOW, IL)
STATE MASTER (Illinois EPA Project) - National Pollutant Discharge Elimination System Permit National Pollutant Discharge Elimination System NON-MAJOR (Tracking pollutant discharge elimination systems) - permit Business SIC classification: WATER SUPPLY Alternative names: LUDLOW WTP, VILLAGE OF
LUDLOW ELEMENTARY SCHOOL (PO BOX 130 in LUDLOW, IL)
(Geographic Names Information System) (National Center for Education Statistics) - STATE ID-0901014202001 Organizations: LUDLOW C C SCHOOL DIST 142 (SCHOOL DISTRICT)
ILDOT STA 1590 PLUS 62 (FAI 57 NW OF LUDLOW in LUDLOW, IL)
Conditionally Exempt Small Quantity Generators, less than 100 kg/month of hazardous waste (Resource Conservation and Recovery Act (tracking hazardous waste)) - notification
Housing units lacking complete plumbing facilities: 6.7% Housing units lacking complete kitchen facilities: 5.2%
79.0%Utility gas
10.4%Electricity
9.9%Bottled, tank, or LP gas
1.5%Wood
Population in 1990: 832.
Place of birth for U.S.-born residents:
This state: 378
Northeast: 15
Midwest: 39
South: 30
West: 19
58% of the 60949 zip code residents lived in the same house 5 years ago. Out of people who lived in different houses, 47% lived in this county. Out of people who lived in different counties, 50% lived in Illinois.
99% of the 60949 zip code residents lived in the same house 1 year ago. Out of people who lived in different houses, 67% moved from different state.
Private vs. public school enrollment:
Students in private schools in grades 1 to 8 (elementary and middle school): 11
Here:
16.6%
Illinois:
13.3%
Students in private schools in grades 9 to 12 (high school): 3
Here:
17.2%
Illinois:
9.9%
Students in private undergraduate colleges: 2
Here:
28.8%
Illinois:
27.4%
Occupation by median earnings in the past 12 months ($)
98,513Construction and extraction occupations
48,926Management occupations
42,148Office and administrative support occupations
41,466Installation, maintenance, and repair occupations
41,019Education, training, and library occupations
34,846Building and grounds cleaning and maintenance occupations
Top industries in this zip code by the number of employees in 2005:
Construction: New Single-Family Housing Construction (except Operative Builders) (5-9 employees: 1 establishment, 1-4 employees: 1 establishment)
Wholesale Trade: Grain and Field Bean Merchant Wholesalers (5-9: 1)
Construction: Painting and Wall Covering Contractors (1-4: 1)
Accommodation and Food Services: Drinking Places (Alcoholic Beverages) (1-4: 1)
Fatal accident statistics in 2012:
Fatal accident count: 1
Vehicles involved in fatal accidents: 4
Fatal accidents caused by drunken drivers: 0
Fatalities: 1
Persons involved in fatal accidents: 4
Pedestrians involved in fatal accidents: 0
Home Mortgage Disclosure Act Aggregated Statistics For Year 2009 (Based on 2 partial tracts)
A) FHA, FSA/RHS & VA Home Purchase Loans
B) Conventional Home Purchase Loans
C) Refinancings
D) Home Improvement Loans
F) Non-occupant Loans on < 5 Family Dwellings (A B C & D)
G) Loans On Manufactured Home Dwelling (A B C & D)
Number
Average Value
Number
Average Value
Number
Average Value
Number
Average Value
Number
Average Value
Number
Average Value
LOANS ORIGINATED
2
$123,830
5
$54,378
29
$105,359
6
$35,668
2
$37,150
2
$25,710
APPLICATIONS APPROVED, NOT ACCEPTED
0
$0
0
$0
1
$149,940
0
$0
0
$0
0
$0
APPLICATIONS DENIED
1
$48,460
1
$82,910
10
$102,727
1
$13,730
0
$0
2
$52,225
APPLICATIONS WITHDRAWN
0
$0
0
$0
4
$115,688
0
$0
0
$0
1
$52,760
FILES CLOSED FOR INCOMPLETENESS
0
$0
0
$0
1
$84,800
0
$0
0
$0
0
$0
Aggregated Statistics For Year 2008 (Based on 2 partial tracts)
A) FHA, FSA/RHS & VA Home Purchase Loans
B) Conventional Home Purchase Loans
C) Refinancings
D) Home Improvement Loans
F) Non-occupant Loans on < 5 Family Dwellings (A B C & D)
G) Loans On Manufactured Home Dwelling (A B C & D)
Number
Average Value
Number
Average Value
Number
Average Value
Number
Average Value
Number
Average Value
Number
Average Value
LOANS ORIGINATED
4
$92,068
9
$83,661
23
$114,656
4
$26,248
5
$59,924
2
$58,820
APPLICATIONS APPROVED, NOT ACCEPTED
0
$0
1
$41,190
2
$93,815
0
$0
0
$0
1
$37,420
APPLICATIONS DENIED
3
$69,453
2
$51,685
7
$113,487
4
$64,675
0
$0
2
$52,765
APPLICATIONS WITHDRAWN
1
$61,920
1
$63,530
2
$165,020
0
$0
0
$0
0
$0
FILES CLOSED FOR INCOMPLETENESS
0
$0
0
$0
0
$0
0
$0
0
$0
0
$0
Aggregated Statistics For Year 2007 (Based on 2 partial tracts)
A) FHA, FSA/RHS & VA Home Purchase Loans
B) Conventional Home Purchase Loans
C) Refinancings
D) Home Improvement Loans
E) Loans on Dwellings For 5+ Families
F) Non-occupant Loans on < 5 Family Dwellings (A B C & D)
G) Loans On Manufactured Home Dwelling (A B C & D)
Number
Average Value
Number
Average Value
Number
Average Value
Number
Average Value
Number
Average Value
Number
Average Value
Number
Average Value
LOANS ORIGINATED
4
$95,970
10
$94,920
20
$89,872
6
$26,562
1
$93,950
1
$138,910
2
$30,825
APPLICATIONS APPROVED, NOT ACCEPTED
0
$0
1
$52,490
3
$148,687
1
$21,270
0
$0
0
$0
0
$0
APPLICATIONS DENIED
1
$118,990
3
$69,183
12
$100,568
6
$41,412
0
$0
0
$0
1
$50,610
APPLICATIONS WITHDRAWN
0
$0
0
$0
4
$90,318
0
$0
0
$0
0
$0
0
$0
FILES CLOSED FOR INCOMPLETENESS
0
$0
1
$74,570
1
$141,870
0
$0
0
$0
0
$0
0
$0
Aggregated Statistics For Year 2006 (Based on 2 partial tracts)
A) FHA, FSA/RHS & VA Home Purchase Loans
B) Conventional Home Purchase Loans
C) Refinancings
D) Home Improvement Loans
F) Non-occupant Loans on < 5 Family Dwellings (A B C & D)
G) Loans On Manufactured Home Dwelling (A B C & D)
Number
Average Value
Number
Average Value
Number
Average Value
Number
Average Value
Number
Average Value
Number
Average Value
LOANS ORIGINATED
3
$112,437
17
$80,158
20
$82,254
8
$30,454
5
$56,640
4
$56,935
APPLICATIONS APPROVED, NOT ACCEPTED
0
$0
1
$40,110
3
$69,003
1
$30,420
0
$0
0
$0
APPLICATIONS DENIED
0
$0
4
$81,972
11
$80,295
6
$95,387
0
$0
1
$30,420
APPLICATIONS WITHDRAWN
0
$0
0
$0
7
$87,797
1
$72,150
0
$0
1
$31,500
FILES CLOSED FOR INCOMPLETENESS
0
$0
1
$74,570
2
$108,620
1
$36,340
0
$0
0
$0
Aggregated Statistics For Year 2005 (Based on 2 partial tracts)
A) FHA, FSA/RHS & VA Home Purchase Loans
B) Conventional Home Purchase Loans
C) Refinancings
D) Home Improvement Loans
F) Non-occupant Loans on < 5 Family Dwellings (A B C & D)
G) Loans On Manufactured Home Dwelling (A B C & D)
Number
Average Value
Number
Average Value
Number
Average Value
Number
Average Value
Number
Average Value
Number
Average Value
LOANS ORIGINATED
3
$96,913
17
$71,401
21
$91,310
8
$33,684
4
$50,205
3
$60,480
APPLICATIONS APPROVED, NOT ACCEPTED
0
$0
2
$88,165
3
$94,847
1
$25,840
0
$0
1
$21,810
APPLICATIONS DENIED
1
$23,690
4
$69,925
17
$87,902
5
$63,316
0
$0
2
$59,090
APPLICATIONS WITHDRAWN
0
$0
0
$0
7
$86,567
2
$227,745
0
$0
0
$0
FILES CLOSED FOR INCOMPLETENESS
0
$0
0
$0
2
$92,740
0
$0
0
$0
0
$0
Aggregated Statistics For Year 2004 (Based on 2 partial tracts)
A) FHA, FSA/RHS & VA Home Purchase Loans
B) Conventional Home Purchase Loans
C) Refinancings
D) Home Improvement Loans
F) Non-occupant Loans on < 5 Family Dwellings (A B C & D)
G) Loans On Manufactured Home Dwelling (A B C & D)
Number
Average Value
Number
Average Value
Number
Average Value
Number
Average Value
Number
Average Value
Number
Average Value
LOANS ORIGINATED
3
$78,787
16
$78,438
26
$80,025
7
$26,843
4
$77,328
4
$62,252
APPLICATIONS APPROVED, NOT ACCEPTED
0
$0
1
$48,990
2
$81,300
0
$0
0
$0
0
$0
APPLICATIONS DENIED
0
$0
5
$55,024
12
$88,522
2
$22,880
1
$81,030
2
$44,820
APPLICATIONS WITHDRAWN
0
$0
1
$35,000
7
$84,413
0
$0
1
$37,150
0
$0
FILES CLOSED FOR INCOMPLETENESS
0
$0
0
$0
4
$71,810
0
$0
0
$0
0
$0
Aggregated Statistics For Year 2003 (Based on 2 partial tracts)
A) FHA, FSA/RHS & VA Home Purchase Loans
B) Conventional Home Purchase Loans
C) Refinancings
D) Home Improvement Loans
F) Non-occupant Loans on < 5 Family Dwellings (A B C & D)
Number
Average Value
Number
Average Value
Number
Average Value
Number
Average Value
Number
Average Value
LOANS ORIGINATED
4
$78,202
15
$70,315
44
$84,462
8
$24,901
3
$45,317
APPLICATIONS APPROVED, NOT ACCEPTED
0
$0
0
$0
5
$66,384
1
$85,070
0
$0
APPLICATIONS DENIED
1
$20,190
4
$68,378
19
$67,385
2
$27,055
1
$21,000
APPLICATIONS WITHDRAWN
0
$0
1
$81,570
7
$81,260
0
$0
0
$0
FILES CLOSED FOR INCOMPLETENESS
0
$0
1
$47,650
1
$90,720
0
$0
0
$0
Aggregated Statistics For Year 2002 (Based on 2 partial tracts)
A) FHA, FSA/RHS & VA Home Purchase Loans
B) Conventional Home Purchase Loans
C) Refinancings
D) Home Improvement Loans
E) Loans on Dwellings For 5+ Families
F) Non-occupant Loans on < 5 Family Dwellings (A B C & D)
Number
Average Value
Number
Average Value
Number
Average Value
Number
Average Value
Number
Average Value
Number
Average Value
LOANS ORIGINATED
2
$101,490
10
$78,418
37
$72,837
6
$24,407
1
$110,100
5
$66,924
APPLICATIONS APPROVED, NOT ACCEPTED
0
$0
0
$0
4
$77,462
0
$0
0
$0
0
$0
APPLICATIONS DENIED
1
$60,030
2
$48,455
14
$62,762
5
$12,760
0
$0
1
$16,150
APPLICATIONS WITHDRAWN
0
$0
0
$0
2
$79,685
1
$67,030
0
$0
0
$0
FILES CLOSED FOR INCOMPLETENESS
0
$0
0
$0
3
$54,557
0
$0
0
$0
0
$0
Aggregated Statistics For Year 2001 (Based on 2 partial tracts)
A) FHA, FSA/RHS & VA Home Purchase Loans
B) Conventional Home Purchase Loans
C) Refinancings
D) Home Improvement Loans
F) Non-occupant Loans on < 5 Family Dwellings (A B C & D)
Number
Average Value
Number
Average Value
Number
Average Value
Number
Average Value
Number
Average Value
LOANS ORIGINATED
3
$88,477
13
$58,852
27
$69,304
7
$25,229
3
$50,790
APPLICATIONS APPROVED, NOT ACCEPTED
0
$0
1
$30,150
4
$46,168
0
$0
0
$0
APPLICATIONS DENIED
1
$35,530
1
$69,720
8
$57,205
3
$13,190
0
$0
APPLICATIONS WITHDRAWN
0
$0
2
$57,475
5
$63,370
1
$15,080
0
$0
FILES CLOSED FOR INCOMPLETENESS
0
$0
0
$0
1
$83,990
1
$28,800
0
$0
Aggregated Statistics For Year 2000 (Based on 2 partial tracts)
A) FHA, FSA/RHS & VA Home Purchase Loans
B) Conventional Home Purchase Loans
C) Refinancings
D) Home Improvement Loans
F) Non-occupant Loans on < 5 Family Dwellings (A B C & D)
Number
Average Value
Number
Average Value
Number
Average Value
Number
Average Value
Number
Average Value
LOANS ORIGINATED
3
$67,660
11
$63,091
9
$64,129
6
$15,883
1
$83,990
APPLICATIONS APPROVED, NOT ACCEPTED
0
$0
1
$51,420
2
$69,725
1
$16,960
0
$0
APPLICATIONS DENIED
0
$0
4
$30,555
11
$43,268
3
$22,703
0
$0
APPLICATIONS WITHDRAWN
0
$0
1
$30,420
3
$44,957
1
$12,110
0
$0
FILES CLOSED FOR INCOMPLETENESS
0
$0
0
$0
1
$57,340
0
$0
0
$0
Aggregated Statistics For Year 1999 (Based on 1 partial tract)


 Nearest zip codes: 60957, 61866, 61847, 61878, 60948, 61862.