Estimated median house/condo value in 2022: $199,512
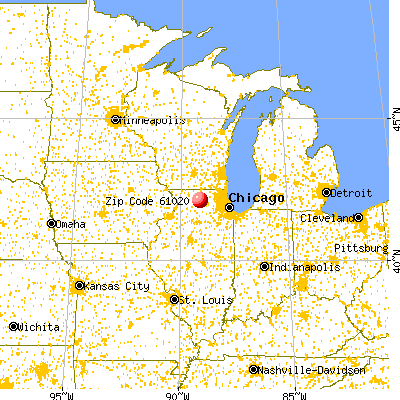
61020:
$199,512
Illinois:
$251,600
According to our research of Illinois and other state lists, there were 5 registered sex offenders living in 61020 zip code as of May 28, 2024. The ratio of all residents to sex offenders in zip code 61020 is 660 to 1. The ratio of registered sex offenders to all residents in this zip code is near the state average.
Median resident age:
This zip code:
35.2 years
Illinois median age:
39.1 years
Average household size:
This zip code:
3.0 people
Illinois:
2.4 people
Averages for the 2020 tax year for zip code 61020, filed in 2021:
Average Adjusted Gross Income (AGI) in 2020: $64,607 (Individual Income Tax Returns)
Here:
$64,607
State:
$82,626
Salary/wage: $58,509 (reported on 89.7% of returns)
Here:
$58,509
State:
$66,640
(% of AGI for various income ranges: 1100.6% for AGIs below $25k, 3526.0% for AGIs $25k-50k, 6058.3% for AGIs $50k-75k, 9600.7% for AGIs $75k-100k, 15328.2% for AGIs $100k-200k)
Taxable interest for individuals: $670 (reported on 27.4% of returns)
This zip code:
$670
Illinois:
$2,376
(% of AGI for various income ranges: 10.6% for AGIs below $25k, 27.6% for AGIs $25k-50k, 18.3% for AGIs $50k-75k, 17.3% for AGIs $75k-100k, 47.3% for AGIs $100k-200k)
Ordinary dividends: $1,738 (reported on 14.4% of returns)
Here:
$1,738
State:
$9,061
(% of AGI for various income ranges: 2.4% for AGIs below $25k, 14.4% for AGIs $25k-50k, 11.1% for AGIs $50k-75k, 38.7% for AGIs $75k-100k, 110.5% for AGIs $100k-200k)
Net capital gain/loss in AGI: +$2,433 (reported on 12.3% of returns)
Here:
+$2,433
State:
+$31,684
(% of AGI for various income ranges: 16.8% for AGIs $25k-50k, 28.3% for AGIs $50k-75k, 29.3% for AGIs $75k-100k, 136.8% for AGIs $100k-200k)
Profit/loss from business: +$8,939 (reported on 12.3% of returns)
Here:
+$8,939
State:
+$12,175
(% of AGI for various income ranges: 75.6% for AGIs below $25k, 186.7% for AGIs $50k-75k, 360.0% for AGIs $75k-100k, 236.4% for AGIs $100k-200k)
Taxable individual retirement arrangement distribution: $14,430 (reported on 6.8% of returns)
61020:
$14,430
Illinois:
$21,613
(% of AGI for various income ranges: 33.8% for AGIs below $25k, 68.4% for AGIs $25k-50k, 174.4% for AGIs $50k-75k, 383.2% for AGIs $100k-200k)
Total itemized deductions: $23,643 (reported on 4.8% of returns)
Here:
$23,643
State:
$34,948
(% of AGI for various income ranges: 378.9% for AGIs $50k-75k, 442.3% for AGIs $100k-200k)
Charity contributions: $7,560 (reported on 3.4% of returns)
Here:
$7,560
State:
$13,122
(% of AGI for various income ranges: 48.9% for AGIs $50k-75k, 131.8% for AGIs $100k-200k)
Taxes paid: $8,343 (reported on 4.8% of returns)
61020:
$8,343
State:
$8,563
(% of AGI for various income ranges: 135.0% for AGIs $50k-75k, 155.0% for AGIs $100k-200k)
Earned income credit: $2,278 (reported on 12.3% of returns)
Here:
$2,278
State:
$2,311
(% of AGI for various income ranges: 72.6% for AGIs below $25k, 65.2% for AGIs $25k-50k)
Percentage of individuals using paid preparers for their 2020 taxes: 96.6%
Here:
97%
State:
93%
(% for various income ranges: 95.1% for AGIs below $25k, 96.7% for AGIs $25k-50k, 95.5% for AGIs $50k-75k, 95.0% for AGIs $75k-100k, 100.0% for AGIs $100k-200k, 100.0% for AGIs over 200k)
Averages for the 2012 tax year for zip code 61020, filed in 2013:
Average Adjusted Gross Income (AGI) in 2012: $55,379 (Individual Income Tax Returns)
Here:
$55,379
State:
$68,058
Salary/wage: $50,137 (reported on 90.6% of returns)
Here:
$50,137
State:
$55,396
(% of AGI for various income ranges: 74.4% for AGIs below $25k, 81.2% for AGIs $25k-50k, 88.2% for AGIs $50k-75k, 87.0% for AGIs $75k-100k, 77.9% for AGIs $100k-200k)
Taxable interest for individuals: $705 (reported on 29.9% of returns)
This zip code:
$705
Illinois:
$1,969
(% of AGI for various income ranges: 0.9% for AGIs below $25k, 0.5% for AGIs $25k-50k, 0.4% for AGIs $50k-75k, 0.3% for AGIs $75k-100k, 0.3% for AGIs $100k-200k)
Ordinary dividends: $1,725 (reported on 12.6% of returns)
Here:
$1,725
State:
$7,786
(% of AGI for various income ranges: 0.4% for AGIs below $25k, 0.2% for AGIs $25k-50k, 0.6% for AGIs $50k-75k, 0.4% for AGIs $75k-100k, 0.3% for AGIs $100k-200k)
Net capital gain/loss in AGI: +$2,517 (reported on 9.4% of returns)
Here:
+$2,517
State:
+$22,183
(% of AGI for various income ranges: 0.1% for AGIs $50k-75k, 1.1% for AGIs $100k-200k)
Profit/loss from business: +$3,588 (reported on 12.6% of returns)
Here:
+$3,588
State:
+$12,903
(% of AGI for various income ranges: 7.0% for AGIs below $25k, 1.7% for AGIs $25k-50k, 0.7% for AGIs $50k-75k)
Taxable individual retirement arrangement distribution: $10,850 (reported on 7.9% of returns)
61020:
$10,850
Illinois:
$17,929
(% of AGI for various income ranges: 4.3% for AGIs below $25k, 2.4% for AGIs $50k-75k, 2.0% for AGIs $100k-200k)
Total itemized deductions: $19,133 (22% of AGI, reported on 40.9% of returns)
Here:
$19,133
State:
$26,433
Here:
21.9% of AGI
State:
19.2% of AGI
(% of AGI for various income ranges: 7.0% for AGIs below $25k, 12.4% for AGIs $25k-50k, 17.1% for AGIs $50k-75k, 15.4% for AGIs $75k-100k, 14.0% for AGIs $100k-200k)
Charity contributions: $2,466 (reported on 29.9% of returns)
Here:
$2,466
State:
$4,525
(% of AGI for various income ranges: 0.8% for AGIs $25k-50k, 1.8% for AGIs $50k-75k, 1.4% for AGIs $75k-100k, 1.5% for AGIs $100k-200k)
Taxes paid: $7,633 (reported on 40.9% of returns)
61020:
$7,633
State:
$11,968
(% of AGI for various income ranges: 2.1% for AGIs below $25k, 3.6% for AGIs $25k-50k, 6.1% for AGIs $50k-75k, 6.4% for AGIs $75k-100k, 6.4% for AGIs $100k-200k)
Earned income credit: $2,170 (reported on 15.7% of returns)
Here:
$2,170
State:
$2,349
(% of AGI for various income ranges: 7.0% for AGIs below $25k, 1.0% for AGIs $25k-50k)
Percentage of individuals using paid preparers for their 2012 taxes: 53.5%
Here:
54%
State:
57%
(% for various income ranges: 46.3% for AGIs below $25k, 55.6% for AGIs $25k-50k, 59.1% for AGIs $50k-75k, 58.8% for AGIs $75k-100k, 55.0% for AGIs $100k-200k)
Averages for the 2004 tax year for zip code 61020, filed in 2005:
Average Adjusted Gross Income (AGI) in 2004: $43,397 (Individual Income Tax Returns)
Here:
$43,397
State:
$54,625
Salary/wage: $40,992 (reported on 91.5% of returns)
Here:
$40,992
State:
$46,811
(% of AGI for various income ranges: 98.4% for AGIs below $10k, 74.4% for AGIs $10k-25k, 87.1% for AGIs $25k-50k, 87.8% for AGIs $50k-75k, 88.5% for AGIs $75k-100k, 84.3% for AGIs over 100k)
Taxable interest for individuals: $668 (reported on 38.7% of returns)
This zip code:
$668
Illinois:
$2,101
(% of AGI for various income ranges: 3.4% for AGIs below $10k, 2.2% for AGIs $10k-25k, 0.5% for AGIs $25k-50k, 0.3% for AGIs $50k-75k, 0.2% for AGIs $75k-100k, 0.8% for AGIs over 100k)
Taxable dividends: $552 (reported on 15.2% of returns)
Here:
$552
State:
$4,306
(% of AGI for various income ranges: 1.0% for AGIs below $10k, 0.1% for AGIs $10k-25k, 0.2% for AGIs $25k-50k, 0.1% for AGIs $50k-75k, 0.2% for AGIs $75k-100k, 0.3% for AGIs over 100k)
Net capital gain/loss: +$514 (reported on 10.4% of returns)
Here:
+$514
State:
+$17,321
(% of AGI for various income ranges: -1.0% for AGIs below $10k, 0.1% for AGIs $10k-25k, 0.1% for AGIs $25k-50k, -0.1% for AGIs $50k-75k, 0.3% for AGIs $75k-100k, 0.4% for AGIs over 100k)
Profit/loss from business: +$6,327 (reported on 15.1% of returns)
Here:
+$6,327
State:
+$11,771
(% of AGI for various income ranges: 7.2% for AGIs below $10k, 8.0% for AGIs $10k-25k, 1.8% for AGIs $25k-50k, 2.6% for AGIs $50k-75k, 0.8% for AGIs $75k-100k, 0.5% for AGIs over 100k)
Profit/loss from farming: +$1,000 (reported on 2.0% of returns)
Here:
+$1,000
State:
+$2,327
IRA payment deduction: $2,769 (reported on 1.3% of returns)
61020:
$2,769
Illinois:
$3,087
Total itemized deductions: $15,082 (22% of AGI, reported on 37.2% of returns)
Here:
$15,082
State:
$20,239
Here:
22.4% of AGI
State:
19.5% of AGI
(% of AGI for various income ranges: 13.9% for AGIs $10k-25k, 10.5% for AGIs $25k-50k, 13.3% for AGIs $50k-75k, 13.6% for AGIs $75k-100k, 15.3% for AGIs over 100k)
Charity contributions deductions: $1,925 (3% of AGI, reported on 30.4% of returns)
Here:
$1,925
State:
$3,719
Here:
2.7% of AGI
State:
3.4% of AGI
(% of AGI for various income ranges: 0.5% for AGIs $10k-25k, 0.7% for AGIs $25k-50k, 1.5% for AGIs $50k-75k, 1.7% for AGIs $75k-100k, 2.0% for AGIs over 100k)
Total tax: $4,770 (reported on 76.6% of returns)
61020:
$4,770
State:
$9,882
(% of AGI for various income ranges: 2.4% for AGIs below $10k, 4.5% for AGIs $10k-25k, 6.2% for AGIs $25k-50k, 7.6% for AGIs $50k-75k, 9.6% for AGIs $75k-100k, 13.5% for AGIs over 100k)
Earned income credit: $1,815 (reported on 16.0% of returns)
Here:
$1,815
State:
$1,788
Percentage of individuals using paid preparers for their 2004 taxes: 58.5%
Here:
59%
State:
61%
(% for various income ranges: 45.8% for AGIs below $10k, 64.9% for AGIs $10k-25k, 56.5% for AGIs $25k-50k, 65.5% for AGIs $50k-75k, 54.9% for AGIs $75k-100k, 64.4% for AGIs over 100k)
Household received Food Stamps/SNAP in the past 12 months: 54 Household did not receive Food Stamps/SNAP in the past 12 months: 959
Women who had a birth in the past 12 months: 27 (27 now married, 0 unmarried) Women who did not have a birth in the past 12 months: 727 (346 now married, 378 unmarried)
Housing units in zip code 61020 with a mortgage: 647 (61 second mortgage, 56 both second mortgage and home equity loan) Median monthly owner costs for units with a mortgage: $1,504 Median monthly owner costs for units without a mortgage: $638
Residents with income below the poverty level in 2022:
This zip code:
8.6%
Whole state:
11.9%
Residents with income below 50% of the poverty level in 2022:
This zip code:
5.6%
Whole state:
5.7%
Median number of rooms in houses and condos:
Here:
6.7
State:
6.4
Median number of rooms in apartments:
Here:
5.3
State:
4.1
Notable locations in this zip code not listed on our city pages
Notable locations in zip code 61020: Orchard Hills Landfill (A), Lynn Scott Rock Fire Protection District Davis Junction Station (B). Display/hide their locations on the map
In group quarters: 10 (-1 institutionalized population)
Size of family households: 295 2-persons, 180 3-persons, 208 4-persons, 75 5-persons, 66 6-persons, 25 7-or-more-persons
Size of nonfamily households: 118 1-person, 45 2-persons
709 married couples with children.
196 single-parent households (49 men, 147 women).
89.3% of residents of 61020 zip code speak English at home.
8.7% of residents speak Spanish at home (60% very well, 26% well, 2% not well, 12% not at all).
1.1% of residents speak other Indo-European language at home (39% very well, 23% well, 39% not well).
0.1% of residents speak Asian or Pacific Island language at home (100% very well).
Foreign born population: 103 (3.3%) (25.4% of them are naturalized citizens)
This zip code:
3.3%
Whole state:
14.4%
69%Honduras
24%North Macedonia (Macedonia)
1%Japan
29%English
17%German
5%Polish
4%Italian
4%European
4%Irish
3%American
Year of entry for the foreign-born population
332010 or later
462000 to 2009
121990 to 1999
14Before 1990
Facilities with environmental interests located in this zip code:
ROLLING MEADOWS MOBILE HOME PARK (HIGHWAY 251 & HIGHWAY 72 in DAVIS JUNCTION, IL)
National Pollutant Discharge Elimination System NON-MAJOR (Tracking pollutant discharge elimination systems) - permit (Resource Conservation and Recovery Act (tracking hazardous waste)) COMMUNITY WATER SYSTEM (SDWIS) - SDWIS-IL1415265 16869, WATER TREATMENT PLANT Business SIC classification: OPERATORS OF RESIDENTIAL MOBILE HOME SITES Organizations: HART LOREN (CONTACT/OWNER)
Alternative names: ROLLING MEADOWS MHP, ROLLING MEADOWS MHP-DAVIS JUNC, ROLLING MEADOWS MOBILE HOME PK
MAPLEHURST FARMS (303 E. CHICAGO AVENUE in DAVIS JUNCTION, IL)
STATE MASTER (Illinois EPA Project) - AIR PROGRAM AIR MINOR (AIRS/AFS) CRITERIA AND HAZARDOUS AIR POLLUTANT INVENTORY (Inventory of air pollution sources) Business SIC classification: GRAIN AND FIELD BEANS
BOB PROPHETER CONSTRUCTION LLC (RT. 72 AND RT. 251 in DAVIS JUNCTION, IL)
STATE MASTER (Illinois EPA Project) - SOLID WASTE PROGRAM, AIR PROGRAM AIR MINOR (AIRS/AFS) CRITERIA AND HAZARDOUS AIR POLLUTANT INVENTORY (Inventory of air pollution sources) Business SIC classification: ASPHALT PAVING MIXTURES AND BLOCKS Business NAICS classification: ASPHALT PAVING MIXTURE AND BLOCK MANUFACTURING. Alternative names: BOB PROPHETER CONSTRUCTION L.L.C.
DAVIS JUNCTION (106 N. ELM STREET in DAVIS JUNCTION, IL)
STATE MASTER (Illinois EPA Project) - DRINKING WATER PROGRAM National Pollutant Discharge Elimination System NON-MAJOR (Tracking pollutant discharge elimination systems) - permit Business SIC classification: SEWERAGE SYSTEMS Alternative names: DAVIS JUNCTION STP, DAVIS JUNCTION STP, VILLAGE OF, DAVIS JUNCTION WWTP
NORTHERN FS INC. (14063 HOLCOMB RD in DAVIS JUNCTION, IL)
STATE MASTER (Illinois EPA Project) - AIR PROGRAM ENFORCEMENT/COMPLIANCE ACTIVITY (Integrated Compliance Information System)
DAVIS JUNCTION LANDFILL (8900 HIGHWAY 251 in DAVIS JUNCTION, IL)
CRITERIA AND HAZARDOUS AIR POLLUTANT INVENTORY (Inventory of air pollution sources) HAZARDOUS WASTE BIENNIAL REPORTER (Resource Conservation and Recovery Act (tracking hazardous waste)) Large Quantity Generators, more that 1000 kg of hazardous waste/month (Resource Conservation and Recovery Act (tracking hazardous waste)) - notification TSD (Resource Conservation and Recovery Act (tracking hazardous waste)) - notification Business SIC classification: REFUSE SYSTEMS Business NAICS classification: SOLID WASTE LANDFILL.; SOLID WASTE LANDFILL. Organizations: BFI WASTE SYSTEMS OF NA (CONTACT/OPERATOR)
Alternative names: BFI DAVIS JUNCTION, BFI OF ILL INC OGLE CTY LANDFILL, OGLE COUNTY / DAVIS JUNCTION LANDFILL
BFI OF IND OF IL LANDFILL (8900 HIGHWAY 251 in DAVIS JUNCTION, IN)
STATE MASTER (Indiana facility tracking) (Resource Conservation and Recovery Act (tracking hazardous waste)) Organizations: BROWNING FERRIS (CONTACT/OWNER)
NORTHERN FS INC. (RTE 251 AND HOLCOMB ROAD in DAVIS JUNCTION, IL)
AIR MINOR (AIRS/AFS) CRITERIA AND HAZARDOUS AIR POLLUTANT INVENTORY (Inventory of air pollution sources) Business SIC classification: PETROLEUM BULK STATIONS AND TERMINALS Alternative names: BLACKHAWK FS INCORPORATED HOLCOMB LOCATION
ORCHARD HILLS LANDFILL (8900 HIGHWAY 251 in DAVIS JUNCTION, IL)
National Pollutant Discharge Elimination System NON-MAJOR (Tracking pollutant discharge elimination systems) - permit Organizations: BFI OF ILLINOIS, INC (CONTACT/OWNER)
HOLCOMB FARM-ELEV #2 (PO BOX 150 - SCOTT in DAVIS JUNCTION, IL)
AIR MINOR (AIRS/AFS) Business SIC classification: GRAIN AND FIELD BEANS
ONYX ORCHARD HILLS LAND FILL (8290 HIGHWAY 251 in OGLE, IL)
National Pollutant Discharge Elimination System NON-MAJOR (Tracking pollutant discharge elimination systems) - permit Business SIC classification: REFUSE SYSTEMS Alternative names: ONYX ORCHARD HILLS LANDFILL
Housing units lacking complete plumbing facilities: 1.5% Housing units lacking complete kitchen facilities: 0.3%
89.8%Utility gas
7.4%Electricity
2.9%Bottled, tank, or LP gas
Population in 1990: 1,263. Population change in the 1990s: +404 (+32.0%).
Place of birth for U.S.-born residents:
This state: 2,439
Northeast: 38
Midwest: 336
South: 146
West: 47
42% of the 61020 zip code residents lived in the same house 5 years ago. Out of people who lived in different houses, 36% lived in this county. Out of people who lived in different counties, 50% lived in Illinois.
94% of the 61020 zip code residents lived in the same house 1 year ago. Out of people who lived in different houses, 23% moved from this county. Out of people who lived in different houses, 60% moved from different county within same state. Out of people who lived in different houses, 15% moved from different state. Out of people who lived in different houses, 6% moved from abroad.
Private vs. public school enrollment:
Students in private schools in grades 1 to 8 (elementary and middle school): 12
Here:
2.7%
Illinois:
13.3%
Students in private schools in grades 9 to 12 (high school): 1
Here:
1.0%
Illinois:
9.9%
Students in private undergraduate colleges: 29
Here:
25.2%
Illinois:
27.4%
Occupation by median earnings in the past 12 months ($)
89,574Computer and mathematical occupations
86,634Installation, maintenance, and repair occupations
68,496Construction and extraction occupations
65,755Health diagnosing and treating practitioners and other technical occupations
61,752Management occupations
59,124Business and financial operations occupations
Companies with federal contracts located in this zip code:
SKANDIA INCORPORATED (5000 N HIGHWAY 251 in DAVIS JUNCTION, IL; small business)
$520 with Navy for Padding and Stuffing Materials. Signed on 2004-12-02. Completion date: 2004-12-12.
Top industries in this zip code by the number of employees in 2005:
Administrative and Support and Waste Management and Remediation Services: Solid Waste Collection (100-249 employees: 1 establishment, 50-99 employees: 1 establishment)
Administrative and Support and Waste Management and Remediation Services: Solid Waste Landfill (10-19: 1)
Construction: All Other Specialty Trade Contractors (10-19: 1)
Arts, Entertainment, and Recreation: All Other Amusement and Recreation Industries (10-19: 1)
Construction: New Single-Family Housing Construction (except Operative Builders) (5-9: 1, 1-4: 1)
Other Services (except Public Administration): General Automotive Repair (5-9: 1)
Health Care and Social Assistance: Offices of Physicians (except Mental Health Specialists) (5-9: 1)
Professional, Scientific, and Technical Services: Veterinary Services (5-9: 1)
Fatal accident statistics in 2013:
Fatal accident count: 1
Vehicles involved in fatal accidents: 1
Fatal accidents caused by drunken drivers: 0
Fatalities: 1
Persons involved in fatal accidents: 1
Pedestrians involved in fatal accidents: 0
Home Mortgage Disclosure Act Aggregated Statistics For Year 2009 (Based on 2 partial tracts)
A) FHA, FSA/RHS & VA Home Purchase Loans
B) Conventional Home Purchase Loans
C) Refinancings
D) Home Improvement Loans
F) Non-occupant Loans on < 5 Family Dwellings (A B C & D)
Number
Average Value
Number
Average Value
Number
Average Value
Number
Average Value
Number
Average Value
LOANS ORIGINATED
3
$151,287
6
$108,705
46
$134,723
1
$14,820
1
$86,760
APPLICATIONS APPROVED, NOT ACCEPTED
0
$0
0
$0
4
$154,335
0
$0
0
$0
APPLICATIONS DENIED
1
$89,630
1
$124,520
11
$135,861
1
$58,560
1
$26,290
APPLICATIONS WITHDRAWN
1
$166,340
1
$69,790
7
$124,860
0
$0
0
$0
FILES CLOSED FOR INCOMPLETENESS
0
$0
0
$0
2
$222,750
0
$0
0
$0
Aggregated Statistics For Year 2008 (Based on 2 partial tracts)
A) FHA, FSA/RHS & VA Home Purchase Loans
B) Conventional Home Purchase Loans
C) Refinancings
D) Home Improvement Loans
F) Non-occupant Loans on < 5 Family Dwellings (A B C & D)
Number
Average Value
Number
Average Value
Number
Average Value
Number
Average Value
Number
Average Value
LOANS ORIGINATED
2
$179,965
6
$117,907
20
$127,734
3
$40,073
2
$103,250
APPLICATIONS APPROVED, NOT ACCEPTED
0
$0
0
$0
3
$165,230
0
$0
1
$61,180
APPLICATIONS DENIED
0
$0
2
$71,340
9
$123,669
2
$75,045
0
$0
APPLICATIONS WITHDRAWN
0
$0
0
$0
5
$137,090
0
$0
0
$0
FILES CLOSED FOR INCOMPLETENESS
0
$0
0
$0
1
$236,370
0
$0
0
$0
Aggregated Statistics For Year 2007 (Based on 2 partial tracts)
A) FHA, FSA/RHS & VA Home Purchase Loans
B) Conventional Home Purchase Loans
C) Refinancings
D) Home Improvement Loans
F) Non-occupant Loans on < 5 Family Dwellings (A B C & D)
G) Loans On Manufactured Home Dwelling (A B C & D)
Number
Average Value
Number
Average Value
Number
Average Value
Number
Average Value
Number
Average Value
Number
Average Value
LOANS ORIGINATED
2
$124,280
15
$128,295
21
$138,404
6
$29,835
3
$66,680
1
$12,670
APPLICATIONS APPROVED, NOT ACCEPTED
0
$0
1
$118,540
3
$197,733
1
$26,050
0
$0
0
$0
APPLICATIONS DENIED
0
$0
3
$98,150
17
$177,872
2
$91,060
1
$206,260
0
$0
APPLICATIONS WITHDRAWN
0
$0
2
$68,475
9
$164,910
1
$160,850
0
$0
0
$0
FILES CLOSED FOR INCOMPLETENESS
0
$0
0
$0
3
$178,133
0
$0
0
$0
0
$0
Aggregated Statistics For Year 2006 (Based on 2 partial tracts)
A) FHA, FSA/RHS & VA Home Purchase Loans
B) Conventional Home Purchase Loans
C) Refinancings
D) Home Improvement Loans
F) Non-occupant Loans on < 5 Family Dwellings (A B C & D)
G) Loans On Manufactured Home Dwelling (A B C & D)
Number
Average Value
Number
Average Value
Number
Average Value
Number
Average Value
Number
Average Value
Number
Average Value
LOANS ORIGINATED
3
$164,750
21
$127,501
16
$115,706
5
$23,278
3
$96,317
1
$24,380
APPLICATIONS APPROVED, NOT ACCEPTED
0
$0
3
$96,237
4
$121,172
0
$0
0
$0
0
$0
APPLICATIONS DENIED
0
$0
4
$79,228
11
$111,374
2
$41,585
0
$0
1
$29,640
APPLICATIONS WITHDRAWN
0
$0
1
$157,020
5
$137,426
0
$0
0
$0
0
$0
FILES CLOSED FOR INCOMPLETENESS
0
$0
0
$0
2
$127,745
0
$0
0
$0
0
$0
Aggregated Statistics For Year 2005 (Based on 2 partial tracts)
B) Conventional Home Purchase Loans
C) Refinancings
D) Home Improvement Loans
F) Non-occupant Loans on < 5 Family Dwellings (A B C & D)
G) Loans On Manufactured Home Dwelling (A B C & D)
Number
Average Value
Number
Average Value
Number
Average Value
Number
Average Value
Number
Average Value
LOANS ORIGINATED
18
$97,472
18
$118,226
4
$41,765
3
$68,433
0
$0
APPLICATIONS APPROVED, NOT ACCEPTED
3
$88,190
3
$98,787
1
$5,500
0
$0
0
$0
APPLICATIONS DENIED
5
$57,312
17
$115,620
4
$32,505
3
$97,990
4
$24,738
APPLICATIONS WITHDRAWN
1
$87,710
7
$136,367
0
$0
0
$0
0
$0
FILES CLOSED FOR INCOMPLETENESS
0
$0
1
$156,310
0
$0
0
$0
0
$0
Aggregated Statistics For Year 2004 (Based on 2 partial tracts)
A) FHA, FSA/RHS & VA Home Purchase Loans
B) Conventional Home Purchase Loans
C) Refinancings
D) Home Improvement Loans
F) Non-occupant Loans on < 5 Family Dwellings (A B C & D)
G) Loans On Manufactured Home Dwelling (A B C & D)
Number
Average Value
Number
Average Value
Number
Average Value
Number
Average Value
Number
Average Value
Number
Average Value
LOANS ORIGINATED
1
$124,040
15
$118,337
25
$102,502
4
$26,948
2
$71,700
0
$0
APPLICATIONS APPROVED, NOT ACCEPTED
0
$0
2
$70,505
5
$123,132
1
$4,060
0
$0
0
$0
APPLICATIONS DENIED
0
$0
4
$82,932
14
$106,491
4
$27,185
0
$0
1
$18,880
APPLICATIONS WITHDRAWN
0
$0
3
$156,307
8
$106,325
0
$0
0
$0
0
$0
FILES CLOSED FOR INCOMPLETENESS
0
$0
0
$0
1
$161,560
0
$0
0
$0
0
$0
Aggregated Statistics For Year 2003 (Based on 4 partial tracts)
A) FHA, FSA/RHS & VA Home Purchase Loans
B) Conventional Home Purchase Loans
C) Refinancings
D) Home Improvement Loans
F) Non-occupant Loans on < 5 Family Dwellings (A B C & D)
Number
Average Value
Number
Average Value
Number
Average Value
Number
Average Value
Number
Average Value
LOANS ORIGINATED
15
$114,015
61
$101,093
279
$102,188
8
$13,605
11
$75,115
APPLICATIONS APPROVED, NOT ACCEPTED
0
$0
4
$119,810
19
$113,552
1
$3,410
1
$69,990
APPLICATIONS DENIED
1
$64,420
8
$62,439
60
$85,955
5
$15,552
2
$57,755
APPLICATIONS WITHDRAWN
1
$87,610
7
$99,479
37
$106,276
0
$0
1
$34,890
FILES CLOSED FOR INCOMPLETENESS
1
$99,890
2
$82,700
5
$138,250
0
$0
0
$0
Aggregated Statistics For Year 2002 (Based on 4 partial tracts)
A) FHA, FSA/RHS & VA Home Purchase Loans
B) Conventional Home Purchase Loans
C) Refinancings
D) Home Improvement Loans
F) Non-occupant Loans on < 5 Family Dwellings (A B C & D)
Number
Average Value
Number
Average Value
Number
Average Value
Number
Average Value
Number
Average Value
LOANS ORIGINATED
12
$123,002
48
$108,250
180
$105,878
8
$21,599
8
$71,704
APPLICATIONS APPROVED, NOT ACCEPTED
0
$0
5
$58,058
18
$115,232
1
$42,250
0
$0
APPLICATIONS DENIED
1
$146,970
15
$43,347
35
$95,793
4
$39,410
1
$104,020
APPLICATIONS WITHDRAWN
0
$0
3
$116,837
29
$96,865
0
$0
1
$96,290
FILES CLOSED FOR INCOMPLETENESS
0
$0
0
$0
3
$141,623
0
$0
0
$0
Aggregated Statistics For Year 2001 (Based on 4 partial tracts)
A) FHA, FSA/RHS & VA Home Purchase Loans
B) Conventional Home Purchase Loans
C) Refinancings
D) Home Improvement Loans
F) Non-occupant Loans on < 5 Family Dwellings (A B C & D)
Number
Average Value
Number
Average Value
Number
Average Value
Number
Average Value
Number
Average Value
LOANS ORIGINATED
11
$97,375
38
$98,082
173
$102,137
13
$16,292
10
$120,000
APPLICATIONS APPROVED, NOT ACCEPTED
0
$0
5
$75,244
10
$83,201
1
$17,750
1
$38,530
APPLICATIONS DENIED
1
$71,980
22
$35,500
39
$73,358
7
$25,866
1
$63,110
APPLICATIONS WITHDRAWN
0
$0
5
$112,860
19
$97,282
1
$28,150
1
$34,670
FILES CLOSED FOR INCOMPLETENESS
0
$0
0
$0
7
$113,676
0
$0
0
$0
Aggregated Statistics For Year 2000 (Based on 4 partial tracts)
A) FHA, FSA/RHS & VA Home Purchase Loans
B) Conventional Home Purchase Loans
C) Refinancings
D) Home Improvement Loans
F) Non-occupant Loans on < 5 Family Dwellings (A B C & D)
Number
Average Value
Number
Average Value
Number
Average Value
Number
Average Value
Number
Average Value
LOANS ORIGINATED
8
$98,082
41
$88,570
34
$76,461
17
$15,992
3
$47,337
APPLICATIONS APPROVED, NOT ACCEPTED
0
$0
5
$81,752
4
$80,352
2
$22,410
0
$0
APPLICATIONS DENIED
0
$0
28
$31,124
15
$77,335
11
$21,925
3
$54,060
APPLICATIONS WITHDRAWN
2
$124,435
6
$65,600
9
$69,614
0
$0
0
$0
FILES CLOSED FOR INCOMPLETENESS
0
$0
1
$100,150
5
$86,824
0
$0
0
$0
Aggregated Statistics For Year 1999 (Based on 2 partial tracts)
A) FHA, FSA/RHS & VA Home Purchase Loans
B) Conventional Home Purchase Loans
C) Refinancings
D) Home Improvement Loans
F) Non-occupant Loans on < 5 Family Dwellings (A B C & D)
Detailed PMIC statistics for the following Tracts:0037.01
, 9610.00
2002 - 2018 National Fire Incident Reporting System (NFIRS) incidents
According to the data from the years 2002 - 2018 the average number of fires per year is 11. The highest number of reported fire incidents - 22 took place in 2018, and the least - 2 in 2013. The data has an increasing trend.
When looking into fire subcategories, the most incidents belonged to: Structure Fires (48.6%), and Outside Fires (38.0%).
Fire incident types reported to NFIRS in Zip Code 61020


 Nearest zip codes: 61043, 61084, 61109, 61052, 61049, 61102.


 According to the data from the years 2002 - 2018 the average number of fires per year is 11. The highest number of reported fire incidents - 22 took place in 2018, and the least - 2 in 2013. The data has an increasing trend.
 When looking into fire subcategories, the most incidents belonged to: Structure Fires (48.6%), and Outside Fires (38.0%).