Estimated zip code population in 2022: 3,075 Zip code population in 2010: 3,175 Zip code population in 2000: 2,796
Houses and condos: 1,321 Renter-occupied apartments: 162
% of renters here:
13%
State:
33%
March 2022 cost of living index in zip code 61084: 84.8 (less than average, U.S. average is 100)
Land area: 34.8 sq. mi. Water area: 0.4 sq. mi.
Population density: 88 people per square mile
(very low).
OSM Map
General Map
Google Map
MSN Map
OSM Map
General Map
Google Map
MSN Map
OSM Map
General Map
Google Map
MSN Map
OSM Map
General Map
Google Map
MSN Map
Please wait while loading the map...
Real estate property taxes paid for housing units in 2022:
This zip code:
1.8% ($3,856)
Illinois:
2.0% ($4,912)
Median real estate property taxes paid for housing units with mortgages in 2022: $3,794 (1.8%) Median real estate property taxes paid for housing units with no mortgage in 2022: $3,977 (1.9%)
Business Search- 14 Million verified businesses
Males: 1,534
(49.9%)
Females: 1,540
(50.1%)
For population 25 years and over in 61084:
High school or higher: 95.1%
Bachelor's degree or higher: 39.0%
Graduate or professional degree: 13.2%
Unemployed: 3.1%
Mean travel time to work (commute): 26.2 minutes
For population 15 years and over in 61084:
Never married: 18.2%
Now married: 70.7%
Separated: 0.0%
Widowed: 4.8%
Divorced: 6.4%
Zip code 61084 compared to state average:
Black race population percentage significantly below state average.
Hispanic race population percentage significantly below state average.
Median age significantly above state average.
Foreign-born population percentage significantly below state average.
Renting percentage significantly below state average.
Length of stay since moving in significantly above state average.
Estimated median house/condo value in 2022: $209,719
61084:
$209,719
Illinois:
$251,600
According to our research of Illinois and other state lists, there was 1 registered sex offender living in 61084 zip code as of May 28, 2024. The ratio of all residents to sex offenders in zip code 61084 is 3,117 to 1. The ratio of registered sex offenders to all residents in this zip code is much lower than the state average.
Median resident age:
This zip code:
50.1 years
Illinois median age:
39.1 years
Average household size:
This zip code:
2.5 people
Illinois:
2.4 people
Averages for the 2020 tax year for zip code 61084, filed in 2021:
Average Adjusted Gross Income (AGI) in 2020: $83,977 (Individual Income Tax Returns)
Here:
$83,977
State:
$82,626
Salary/wage: $66,940 (reported on 83.0% of returns)
Here:
$66,940
State:
$66,640
(% of AGI for various income ranges: 1012.3% for AGIs below $25k, 3220.5% for AGIs $25k-50k, 6056.2% for AGIs $50k-75k, 8156.2% for AGIs $75k-100k, 17083.8% for AGIs $100k-200k, 40257.5% for AGIs over 200k)
Taxable interest for individuals: $1,262 (reported on 41.5% of returns)
This zip code:
$1,262
Illinois:
$2,376
(% of AGI for various income ranges: 16.2% for AGIs below $25k, 34.8% for AGIs $25k-50k, 17.5% for AGIs $50k-75k, 109.2% for AGIs $75k-100k, 126.7% for AGIs $100k-200k, 547.5% for AGIs over 200k)
Ordinary dividends: $3,926 (reported on 25.9% of returns)
Here:
$3,926
State:
$9,061
(% of AGI for various income ranges: 41.9% for AGIs below $25k, 43.3% for AGIs $25k-50k, 47.5% for AGIs $50k-75k, 106.9% for AGIs $75k-100k, 365.7% for AGIs $100k-200k, 772.5% for AGIs over 200k)
Net capital gain/loss in AGI: +$14,335 (reported on 23.1% of returns)
Here:
+$14,335
State:
+$31,684
(% of AGI for various income ranges: 6.9% for AGIs below $25k, 61.0% for AGIs $25k-50k, 80.0% for AGIs $50k-75k, 98.5% for AGIs $75k-100k, 684.8% for AGIs $100k-200k, 7585.0% for AGIs over 200k)
Profit/loss from business: +$8,115 (reported on 13.6% of returns)
Here:
+$8,115
State:
+$12,175
(% of AGI for various income ranges: 44.6% for AGIs below $25k, 54.3% for AGIs $25k-50k, 162.5% for AGIs $50k-75k, 216.9% for AGIs $75k-100k, 405.2% for AGIs $100k-200k)
Taxable individual retirement arrangement distribution: $19,168 (reported on 15.0% of returns)
61084:
$19,168
Illinois:
$21,613
(% of AGI for various income ranges: 65.0% for AGIs below $25k, 249.5% for AGIs $25k-50k, 230.6% for AGIs $50k-75k, 550.0% for AGIs $75k-100k, 1161.9% for AGIs $100k-200k)
Total itemized deductions: $35,270 (reported on 6.8% of returns)
Here:
$35,270
State:
$34,948
(% of AGI for various income ranges: 862.5% for AGIs $50k-75k, 1022.4% for AGIs $100k-200k)
Charity contributions: $14,862 (reported on 5.4% of returns)
Here:
$14,862
State:
$13,122
(% of AGI for various income ranges: 160.6% for AGIs $50k-75k, 443.8% for AGIs $100k-200k)
Taxes paid: $8,080 (reported on 6.8% of returns)
61084:
$8,080
State:
$8,563
(% of AGI for various income ranges: 146.9% for AGIs $50k-75k, 272.9% for AGIs $100k-200k)
Earned income credit: $1,775 (reported on 8.2% of returns)
Here:
$1,775
State:
$2,311
(% of AGI for various income ranges: 44.6% for AGIs below $25k, 46.2% for AGIs $25k-50k)
Percentage of individuals using paid preparers for their 2020 taxes: 95.9%
Here:
96%
State:
93%
(% for various income ranges: 94.3% for AGIs below $25k, 96.4% for AGIs $25k-50k, 100.0% for AGIs $50k-75k, 94.4% for AGIs $75k-100k, 94.6% for AGIs $100k-200k, 100.0% for AGIs over 200k)
Averages for the 2012 tax year for zip code 61084, filed in 2013:
Average Adjusted Gross Income (AGI) in 2012: $65,351 (Individual Income Tax Returns)
Here:
$65,351
State:
$68,058
Salary/wage: $56,569 (reported on 84.5% of returns)
Here:
$56,569
State:
$55,396
(% of AGI for various income ranges: 71.2% for AGIs below $25k, 72.3% for AGIs $25k-50k, 74.2% for AGIs $50k-75k, 71.2% for AGIs $75k-100k, 82.0% for AGIs $100k-200k, 55.7% for AGIs over 200k)
Taxable interest for individuals: $938 (reported on 42.6% of returns)
This zip code:
$938
Illinois:
$1,969
(% of AGI for various income ranges: 1.8% for AGIs below $25k, 0.6% for AGIs $25k-50k, 0.5% for AGIs $50k-75k, 0.8% for AGIs $75k-100k, 0.5% for AGIs $100k-200k, 0.4% for AGIs over 200k)
Ordinary dividends: $2,286 (reported on 22.6% of returns)
Here:
$2,286
State:
$7,786
(% of AGI for various income ranges: 1.6% for AGIs below $25k, 1.0% for AGIs $25k-50k, 0.4% for AGIs $50k-75k, 0.9% for AGIs $75k-100k, 0.7% for AGIs $100k-200k, 0.9% for AGIs over 200k)
Net capital gain/loss in AGI: +$3,380 (reported on 16.1% of returns)
Here:
+$3,380
State:
+$22,183
(% of AGI for various income ranges: 0.5% for AGIs $75k-100k, 1.2% for AGIs $100k-200k, 2.0% for AGIs over 200k)
Profit/loss from business: +$6,183 (reported on 15.5% of returns)
Here:
+$6,183
State:
+$12,903
(% of AGI for various income ranges: 4.9% for AGIs below $25k, 3.3% for AGIs $25k-50k, 0.9% for AGIs $50k-75k, 1.2% for AGIs $75k-100k, 1.4% for AGIs $100k-200k)
Taxable individual retirement arrangement distribution: $13,205 (reported on 13.5% of returns)
61084:
$13,205
Illinois:
$17,929
(% of AGI for various income ranges: 6.7% for AGIs below $25k, 4.3% for AGIs $25k-50k, 3.1% for AGIs $50k-75k, 3.4% for AGIs $75k-100k, 2.5% for AGIs $100k-200k)
Total itemized deductions: $21,214 (19% of AGI, reported on 41.3% of returns)
Here:
$21,214
State:
$26,433
Here:
19.2% of AGI
State:
19.2% of AGI
(% of AGI for various income ranges: 11.5% for AGIs below $25k, 10.0% for AGIs $25k-50k, 13.4% for AGIs $50k-75k, 14.2% for AGIs $75k-100k, 15.4% for AGIs $100k-200k, 11.0% for AGIs over 200k)
Charity contributions: $3,396 (reported on 33.5% of returns)
Here:
$3,396
State:
$4,525
(% of AGI for various income ranges: 0.8% for AGIs below $25k, 0.8% for AGIs $25k-50k, 1.3% for AGIs $50k-75k, 1.8% for AGIs $75k-100k, 2.0% for AGIs $100k-200k, 2.4% for AGIs over 200k)
Taxes paid: $9,960 (reported on 40.6% of returns)
61084:
$9,960
State:
$11,968
(% of AGI for various income ranges: 3.3% for AGIs below $25k, 3.9% for AGIs $25k-50k, 5.3% for AGIs $50k-75k, 6.0% for AGIs $75k-100k, 7.6% for AGIs $100k-200k, 6.4% for AGIs over 200k)
Earned income credit: $2,114 (reported on 9.0% of returns)
Here:
$2,114
State:
$2,349
(% of AGI for various income ranges: 3.7% for AGIs below $25k, 0.8% for AGIs $25k-50k)
Percentage of individuals using paid preparers for their 2012 taxes: 57.4%
Here:
57%
State:
57%
(% for various income ranges: 48.1% for AGIs below $25k, 57.1% for AGIs $25k-50k, 65.2% for AGIs $50k-75k, 63.2% for AGIs $75k-100k, 60.7% for AGIs $100k-200k, 80.0% for AGIs over 200k)
Averages for the 2004 tax year for zip code 61084, filed in 2005:
Average Adjusted Gross Income (AGI) in 2004: $52,836 (Individual Income Tax Returns)
Here:
$52,836
State:
$54,625
Salary/wage: $46,885 (reported on 88.0% of returns)
Here:
$46,885
State:
$46,811
(% of AGI for various income ranges: 96.4% for AGIs below $10k, 71.8% for AGIs $10k-25k, 78.8% for AGIs $25k-50k, 83.2% for AGIs $50k-75k, 83.7% for AGIs $75k-100k, 71.5% for AGIs over 100k)
Taxable interest for individuals: $1,146 (reported on 57.2% of returns)
This zip code:
$1,146
Illinois:
$2,101
(% of AGI for various income ranges: 8.8% for AGIs below $10k, 2.5% for AGIs $10k-25k, 1.6% for AGIs $25k-50k, 1.0% for AGIs $50k-75k, 0.8% for AGIs $75k-100k, 1.1% for AGIs over 100k)
Taxable dividends: $1,222 (reported on 26.1% of returns)
Here:
$1,222
State:
$4,306
(% of AGI for various income ranges: 3.6% for AGIs below $10k, 1.0% for AGIs $10k-25k, 0.4% for AGIs $25k-50k, 0.2% for AGIs $50k-75k, 0.8% for AGIs $75k-100k, 0.6% for AGIs over 100k)
Net capital gain/loss: +$5,212 (reported on 19.6% of returns)
Here:
+$5,212
State:
+$17,321
(% of AGI for various income ranges: -1.0% for AGIs below $10k, -0.3% for AGIs $10k-25k, 0.5% for AGIs $25k-50k, 0.3% for AGIs $50k-75k, 0.1% for AGIs $75k-100k, 5.1% for AGIs over 100k)
Profit/loss from business: +$15,204 (reported on 16.9% of returns)
Here:
+$15,204
State:
+$11,771
(% of AGI for various income ranges: 6.3% for AGIs below $10k, 4.0% for AGIs $10k-25k, 3.0% for AGIs $25k-50k, 1.1% for AGIs $50k-75k, 3.1% for AGIs $75k-100k, 9.1% for AGIs over 100k)
IRA payment deduction: $3,122 (reported on 2.8% of returns)
61084:
$3,122
Illinois:
$3,087
Total itemized deductions: $16,683 (20% of AGI, reported on 43.8% of returns)
Here:
$16,683
State:
$20,239
Here:
19.9% of AGI
State:
19.5% of AGI
(% of AGI for various income ranges: 28.9% for AGIs below $10k, 13.0% for AGIs $10k-25k, 12.7% for AGIs $25k-50k, 14.9% for AGIs $50k-75k, 14.0% for AGIs $75k-100k, 13.1% for AGIs over 100k)
Charity contributions deductions: $2,928 (3% of AGI, reported on 39.6% of returns)
Here:
$2,928
State:
$3,719
Here:
3.3% of AGI
State:
3.4% of AGI
(% of AGI for various income ranges: 1.2% for AGIs $10k-25k, 1.3% for AGIs $25k-50k, 2.0% for AGIs $50k-75k, 2.3% for AGIs $75k-100k, 2.8% for AGIs over 100k)
Total tax: $7,705 (reported on 79.0% of returns)
61084:
$7,705
State:
$9,882
(% of AGI for various income ranges: 3.0% for AGIs below $10k, 4.4% for AGIs $10k-25k, 7.2% for AGIs $25k-50k, 8.2% for AGIs $50k-75k, 10.2% for AGIs $75k-100k, 17.4% for AGIs over 100k)
Earned income credit: $1,562 (reported on 8.4% of returns)
Here:
$1,562
State:
$1,788
Percentage of individuals using paid preparers for their 2004 taxes: 60.5%
Here:
60%
State:
61%
(% for various income ranges: 48.6% for AGIs below $10k, 61.5% for AGIs $10k-25k, 63.4% for AGIs $25k-50k, 63.8% for AGIs $50k-75k, 57.3% for AGIs $75k-100k, 72.3% for AGIs over 100k)
Household received Food Stamps/SNAP in the past 12 months: 6 Household did not receive Food Stamps/SNAP in the past 12 months: 1,181
Women who had a birth in the past 12 months: 21 (21 now married, 0 unmarried) Women who did not have a birth in the past 12 months: 511 (319 now married, 187 unmarried)
Housing units in zip code 61084 with a mortgage: 641 (94 second mortgage, 8 home equity loan, 57 both second mortgage and home equity loan) Houses without a mortgage: 133
Median monthly owner costs for units with a mortgage: $1,432 Median monthly owner costs for units without a mortgage: $691
Residents with income below the poverty level in 2022:
This zip code:
1.7%
Whole state:
11.9%
Residents with income below 50% of the poverty level in 2022:
This zip code:
1.4%
Whole state:
5.7%
Median number of rooms in houses and condos:
Here:
6.5
State:
6.4
Median number of rooms in apartments:
Here:
4.5
State:
4.1
Notable locations in this zip code not listed on our city pages
Size of family households: 518 2-persons, 160 3-persons, 199 4-persons, 74 5-persons
Size of nonfamily households: 228 1-person, 21 2-persons
494 married couples with children.
85 single-parent households (81 men, 4 women).
99.4% of residents of 61084 zip code speak English at home.
0.1% of residents speak other Indo-European language at home (100% very well).
Foreign born population: 58 (1.9%) (100.0% of them are naturalized citizens)
This zip code:
1.9%
Whole state:
14.4%
16%Haiti
12%Albania
31%German
23%American
10%Swedish
10%Irish
6%European
5%English
3%Scottish
Year of entry for the foreign-born population
02010 or later
02000 to 2009
491990 to 1999
9Before 1990
Facilities with environmental interests located in this zip code:
DANS BODYSHOP (5957 E WELD PARK RD in STILLMAN VALLEY, IL)
STATE MASTER (Illinois EPA Project) - HAZARDOUS WASTE PROGRAM Small Quantity Generators, between 100 kg and 1000 kg of hazardous waste/month (Resource Conservation and Recovery Act (tracking hazardous waste)) - notification Organizations: KUNCE DAN (CONTACT/OWNER)
Alternative names: DANS BODY SHOP
HIGHLAND ELEM SCHOOL (410 S HICKORY ST in STILLMAN VALLEY, IL)
(National Center for Education Statistics) - STATE ID-4707122302002 Organizations: MERIDIAN C U SCH DIST 223 (SCHOOL DISTRICT)
MERIDIAN JR HIGH SCHOOL (207 W MAIN ST in STILLMAN VALLEY, IL)
(National Center for Education Statistics) - STATE ID-4707122301001 Organizations: MERIDIAN C U SCH DIST 223 (SCHOOL DISTRICT)
75.9%Utility gas
9.9%Bottled, tank, or LP gas
4.6%Electricity
4.1%Other fuel
2.6%Wood
1.8%No fuel used
1.4%Fuel oil, kerosene, etc.
Population in 1990: 2,772. Population change in the 1990s: +24 (+0.9%).
Place of birth for U.S.-born residents:
This state: 2,512
Northeast: 40
Midwest: 286
South: 127
West: 34
66% of the 61084 zip code residents lived in the same house 5 years ago. Out of people who lived in different houses, 55% lived in this county. Out of people who lived in different counties, 50% lived in Illinois.
93% of the 61084 zip code residents lived in the same house 1 year ago. Out of people who lived in different houses, 56% moved from this county. Out of people who lived in different houses, 17% moved from different county within same state. Out of people who lived in different houses, 27% moved from different state.
Private vs. public school enrollment:
Students in private schools in grades 1 to 8 (elementary and middle school): 3
Here:
0.9%
Illinois:
13.3%
Students in private schools in grades 9 to 12 (high school): 20
Here:
17.1%
Illinois:
9.9%
Students in private undergraduate colleges:
Here:
0.0%
Illinois:
27.4%
Occupation by median earnings in the past 12 months ($)
93,822Computer and mathematical occupations
82,063Management occupations
79,970Installation, maintenance, and repair occupations
70,933Arts, design, entertainment, sports, and media occupations
68,394Business and financial operations occupations
62,585Health diagnosing and treating practitioners and other technical occupations
Top industries in this zip code by the number of employees in 2005:
Finance and Insurance: Commercial Banking (20-49 employees: 1 establishment)
Accommodation and Food Services: Limited-Service Restaurants (10-19: 1, 5-9: 1)
Wholesale Trade: Women's, Children's, and Infants' Clothing and Accessories Merchant Wholesalers (10-19: 1, 5-9: 1)
Accommodation and Food Services: Full-Service Restaurants (10-19: 1, 1-4: 1)
Other Services (except Public Administration): Religious Organizations (5-9: 2, 1-4: 1)
Construction: Framing Contractors (10-19: 1)
Other Services (except Public Administration): Labor Unions and Similar Labor Organizations (10-19: 1)
Fatal accident statistics in 2013:
Fatal accident count: 1
Vehicles involved in fatal accidents: 1
Fatal accidents caused by drunken drivers: 0
Fatalities: 2
Persons involved in fatal accidents: 2
Pedestrians involved in fatal accidents: 0
Fatal accident statistics in 2012:
Fatal accident count: 1
Vehicles involved in fatal accidents: 1
Fatal accidents caused by drunken drivers: 1
Fatalities: 1
Persons involved in fatal accidents: 2
Pedestrians involved in fatal accidents: 0
Home Mortgage Disclosure Act Aggregated Statistics For Year 2003 (Based on 2 partial tracts)
A) FHA, FSA/RHS & VA Home Purchase Loans
B) Conventional Home Purchase Loans
C) Refinancings
D) Home Improvement Loans
F) Non-occupant Loans on < 5 Family Dwellings (A B C & D)
Number
Average Value
Number
Average Value
Number
Average Value
Number
Average Value
Number
Average Value
LOANS ORIGINATED
1
$103,630
23
$126,990
144
$115,317
3
$30,977
7
$87,577
APPLICATIONS APPROVED, NOT ACCEPTED
0
$0
2
$165,440
8
$158,119
0
$0
1
$60,540
APPLICATIONS DENIED
0
$0
3
$104,757
23
$126,377
2
$12,955
0
$0
APPLICATIONS WITHDRAWN
0
$0
5
$153,922
15
$140,425
0
$0
0
$0
FILES CLOSED FOR INCOMPLETENESS
1
$113,770
0
$0
3
$142,960
0
$0
0
$0
Aggregated Statistics For Year 2002 (Based on 2 partial tracts)
A) FHA, FSA/RHS & VA Home Purchase Loans
B) Conventional Home Purchase Loans
C) Refinancings
D) Home Improvement Loans
F) Non-occupant Loans on < 5 Family Dwellings (A B C & D)
Number
Average Value
Number
Average Value
Number
Average Value
Number
Average Value
Number
Average Value
LOANS ORIGINATED
5
$113,204
21
$114,852
149
$117,713
8
$23,056
6
$81,945
APPLICATIONS APPROVED, NOT ACCEPTED
0
$0
1
$70,960
5
$137,758
1
$17,460
1
$70,680
APPLICATIONS DENIED
0
$0
3
$93,490
17
$116,649
2
$26,750
1
$78,280
APPLICATIONS WITHDRAWN
0
$0
3
$128,787
11
$119,655
0
$0
1
$94,340
FILES CLOSED FOR INCOMPLETENESS
0
$0
0
$0
4
$126,158
0
$0
0
$0
Aggregated Statistics For Year 2001 (Based on 2 partial tracts)
A) FHA, FSA/RHS & VA Home Purchase Loans
B) Conventional Home Purchase Loans
C) Refinancings
D) Home Improvement Loans
F) Non-occupant Loans on < 5 Family Dwellings (A B C & D)
Number
Average Value
Number
Average Value
Number
Average Value
Number
Average Value
Number
Average Value
LOANS ORIGINATED
3
$130,757
23
$121,394
114
$111,966
9
$26,408
7
$82,589
APPLICATIONS APPROVED, NOT ACCEPTED
0
$0
2
$137,985
7
$80,819
0
$0
1
$81,660
APPLICATIONS DENIED
0
$0
3
$106,070
15
$95,875
2
$12,955
0
$0
APPLICATIONS WITHDRAWN
0
$0
3
$97,433
13
$111,102
1
$14,080
1
$147,840
FILES CLOSED FOR INCOMPLETENESS
0
$0
0
$0
4
$115,245
0
$0
0
$0
Aggregated Statistics For Year 2000 (Based on 2 partial tracts)
A) FHA, FSA/RHS & VA Home Purchase Loans
B) Conventional Home Purchase Loans
C) Refinancings
D) Home Improvement Loans
F) Non-occupant Loans on < 5 Family Dwellings (A B C & D)
Number
Average Value
Number
Average Value
Number
Average Value
Number
Average Value
Number
Average Value
LOANS ORIGINATED
4
$111,232
20
$126,903
26
$103,163
13
$20,427
5
$83,298
APPLICATIONS APPROVED, NOT ACCEPTED
0
$0
2
$88,420
3
$89,453
3
$29,663
0
$0
APPLICATIONS DENIED
1
$58,850
3
$80,443
9
$88,453
2
$28,725
1
$38,020
APPLICATIONS WITHDRAWN
0
$0
2
$96,730
8
$85,748
0
$0
1
$38,580
FILES CLOSED FOR INCOMPLETENESS
0
$0
1
$142,770
4
$96,168
0
$0
0
$0
Aggregated Statistics For Year 1999 (Based on 1 partial tract)
A) FHA, FSA/RHS & VA Home Purchase Loans
B) Conventional Home Purchase Loans
C) Refinancings
D) Home Improvement Loans
F) Non-occupant Loans on < 5 Family Dwellings (A B C & D)
Detailed PMIC statistics for the following Tracts:9613.00
2002 - 2018 National Fire Incident Reporting System (NFIRS) incidents
Based on the data from the years 2002 - 2018 the average number of fire incidents per year is 24. The highest number of fires - 53 took place in 2010, and the least - 2 in 2002. The data has a growing trend.
When looking into fire subcategories, the most reports belonged to: Outside Fires (53.2%), and Structure Fires (39.5%).
Fire incident types reported to NFIRS in Zip Code 61084

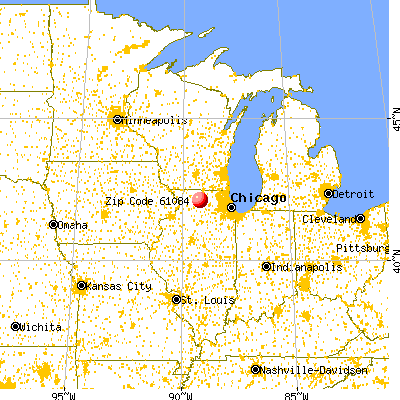


 Nearest zip codes: 61010, 61020, 61043, 61102, 61015, 61109.


 Based on the data from the years 2002 - 2018 the average number of fire incidents per year is 24. The highest number of fires - 53 took place in 2010, and the least - 2 in 2002. The data has a growing trend.
 When looking into fire subcategories, the most reports belonged to: Outside Fires (53.2%), and Structure Fires (39.5%).