Estimated zip code population in 2022: 611 Zip code population in 2010: 700 Zip code population in 2000: 722
Houses and condos: 270 Renter-occupied apartments: 68
% of renters here:
27%
State:
33%
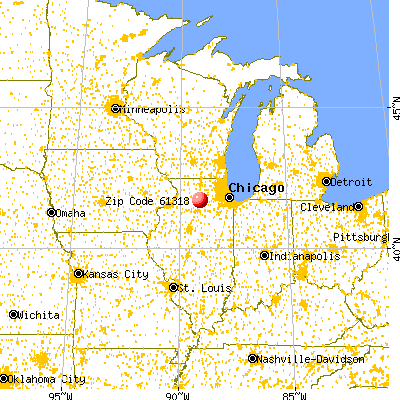
March 2022 cost of living index in zip code 61318: 85.8 (less than average, U.S. average is 100)
Land area: 34.6 sq. mi. Water area: 0.0 sq. mi.
Population density: 18 people per square mile
(very low).
OSM Map
General Map
Google Map
MSN Map
OSM Map
General Map
Google Map
MSN Map
OSM Map
General Map
Google Map
MSN Map
OSM Map
General Map
Google Map
MSN Map
Please wait while loading the map...
Real estate property taxes paid for housing units in 2022:
This zip code:
1.8% ($2,343)
Illinois:
2.0% ($4,912)
Median real estate property taxes paid for housing units with mortgages in 2022: $3,181 (1.8%) Median real estate property taxes paid for housing units with no mortgage in 2022: $1,361 (1.7%)
Business Search- 14 Million verified businesses
Males: 315
(51.6%)
Females: 295
(48.4%)
For population 25 years and over in 61318:
High school or higher: 83.1%
Bachelor's degree or higher: 7.9%
Graduate or professional degree: 5.3%
Unemployed: 3.4%
Mean travel time to work (commute): 36.1 minutes
For population 15 years and over in 61318:
Never married: 42.7%
Now married: 42.3%
Separated: 2.2%
Widowed: 5.3%
Divorced: 7.4%
Zip code 61318 compared to state average:
Median house value below state average.
Black race population percentage significantly below state average.
Foreign-born population percentage significantly below state average.
Length of stay since moving in significantly above state average.
Number of college students below state average.
Percentage of population with a bachelor's degree or higher significantly below state average.
Estimated median house/condo value in 2022: $130,693
61318:
$130,693
Illinois:
$251,600
According to our research of Illinois and other state lists, there was 1 registered sex offender living in 61318 zip code as of June 09, 2024. The ratio of all residents to sex offenders in zip code 61318 is 769 to 1. The ratio of registered sex offenders to all residents in this zip code is near the state average.
Median resident age:
This zip code:
40.9 years
Illinois median age:
39.1 years
Average household size:
This zip code:
2.4 people
Illinois:
2.4 people
Averages for the 2020 tax year for zip code 61318, filed in 2021:
Average Adjusted Gross Income (AGI) in 2020: $63,612 (Individual Income Tax Returns)
Here:
$63,612
State:
$82,626
Salary/wage: $52,308 (reported on 81.2% of returns)
Here:
$52,308
State:
$66,640
(% of AGI for various income ranges: 1210.0% for AGIs below $25k, 4050.0% for AGIs $25k-50k, 5245.0% for AGIs $50k-75k, 9196.7% for AGIs $75k-100k, 19570.0% for AGIs $100k-200k)
Taxable interest for individuals: $508 (reported on 40.6% of returns)
This zip code:
$508
Illinois:
$2,376
(% of AGI for various income ranges: 2.9% for AGIs below $25k, 16.0% for AGIs $25k-50k, 20.0% for AGIs $75k-100k, 166.7% for AGIs $100k-200k)
Ordinary dividends: $7,040 (reported on 15.6% of returns)
Here:
$7,040
State:
$9,061
(% of AGI for various income ranges: 40.0% for AGIs $25k-50k, 1106.7% for AGIs $100k-200k)
Net capital gain/loss in AGI: +$5,475 (reported on 12.5% of returns)
Here:
+$5,475
State:
+$31,684
(% of AGI for various income ranges: 730.0% for AGIs $75k-100k)
Profit/loss from business: +$6,225 (reported on 12.5% of returns)
Here:
+$6,225
State:
+$12,175
(% of AGI for various income ranges: 622.5% for AGIs $50k-75k)
Taxable individual retirement arrangement distribution: $9,200 (reported on 9.4% of returns)
61318:
$9,200
Illinois:
$21,613
(% of AGI for various income ranges: 552.0% for AGIs $25k-50k)
Earned income credit: $2,075 (reported on 12.5% of returns)
Here:
$2,075
State:
$2,311
(% of AGI for various income ranges: 118.6% for AGIs below $25k)
Percentage of individuals using paid preparers for their 2020 taxes: 93.8%
Here:
94%
State:
93%
(% for various income ranges: 90.0% for AGIs below $25k, 85.7% for AGIs $25k-50k, 100.0% for AGIs $50k-75k, 100.0% for AGIs $75k-100k, 100.0% for AGIs $100k-200k)
Averages for the 2012 tax year for zip code 61318, filed in 2013:
Average Adjusted Gross Income (AGI) in 2012: $53,088 (Individual Income Tax Returns)
Here:
$53,088
State:
$68,058
Salary/wage: $34,552 (reported on 87.9% of returns)
Here:
$34,552
State:
$55,396
(% of AGI for various income ranges: 64.4% for AGIs below $25k, 77.3% for AGIs $25k-50k, 75.1% for AGIs $50k-75k, 72.5% for AGIs $75k-100k, 29.3% for AGIs $100k-200k)
Taxable interest for individuals: $600 (reported on 39.4% of returns)
This zip code:
$600
Illinois:
$1,969
(% of AGI for various income ranges: 0.7% for AGIs below $25k, 0.3% for AGIs $25k-50k, 0.7% for AGIs $50k-75k, 0.5% for AGIs $100k-200k)
Ordinary dividends: $1,520 (reported on 15.2% of returns)
Here:
$1,520
State:
$7,786
Net capital gain/loss in AGI: +$560 (reported on 15.2% of returns)
Here:
+$560
State:
+$22,183
Profit/loss from business: +$4,733 (reported on 18.2% of returns)
Here:
+$4,733
State:
+$12,903
Taxable individual retirement arrangement distribution: $13,767 (reported on 9.1% of returns)
61318:
$13,767
Illinois:
$17,929
Total itemized deductions: $20,475 (24% of AGI, reported on 24.2% of returns)
Here:
$20,475
State:
$26,433
Here:
23.6% of AGI
State:
19.2% of AGI
(% of AGI for various income ranges: 34.8% for AGIs below $25k, 19.8% for AGIs $50k-75k, 8.2% for AGIs $100k-200k)
Charity contributions: $1,980 (reported on 15.2% of returns)
Here:
$1,980
State:
$4,525
Taxes paid: $8,225 (reported on 24.2% of returns)
61318:
$8,225
State:
$11,968
(% of AGI for various income ranges: 10.1% for AGIs below $25k, 7.5% for AGIs $50k-75k, 4.3% for AGIs $100k-200k)
Earned income credit: $2,140 (reported on 15.2% of returns)
Here:
$2,140
State:
$2,349
(% of AGI for various income ranges: 8.0% for AGIs below $25k)
Percentage of individuals using paid preparers for their 2012 taxes: 60.6%
Here:
61%
State:
57%
(% for various income ranges: 54.5% for AGIs below $25k, 60.0% for AGIs $25k-50k, 100.0% for AGIs $50k-75k, 75.0% for AGIs $100k-200k)
Averages for the 2004 tax year for zip code 61318, filed in 2005:
Average Adjusted Gross Income (AGI) in 2004: $38,884 (Individual Income Tax Returns)
Here:
$38,884
State:
$54,625
Salary/wage: $34,301 (reported on 84.9% of returns)
Here:
$34,301
State:
$46,811
(% of AGI for various income ranges: 100.0% for AGIs below $10k, 67.4% for AGIs $10k-25k, 78.6% for AGIs $25k-50k, 79.4% for AGIs $50k-75k, 81.9% for AGIs $75k-100k, 58.8% for AGIs over 100k)
Taxable interest for individuals: $1,154 (reported on 51.9% of returns)
This zip code:
$1,154
Illinois:
$2,101
(% of AGI for various income ranges: 9.6% for AGIs below $10k, 3.3% for AGIs $10k-25k, 0.9% for AGIs $25k-50k, 2.0% for AGIs $50k-75k, 0.1% for AGIs $75k-100k, 0.9% for AGIs over 100k)
Taxable dividends: $1,000 (reported on 22.8% of returns)
Here:
$1,000
State:
$4,306
(% of AGI for various income ranges: 1.9% for AGIs below $10k, 1.6% for AGIs $10k-25k, 0.9% for AGIs $25k-50k, 0.4% for AGIs $50k-75k, 0.5% for AGIs $75k-100k)
Net capital gain/loss: +$156 (reported on 13.4% of returns)
Here:
+$156
State:
+$17,321
Profit/loss from business: +$3,967 (reported on 18.1% of returns)
Here:
+$3,967
State:
+$11,771
(% of AGI for various income ranges: 0.6% for AGIs below $10k, 10.1% for AGIs $10k-25k, 4.3% for AGIs $25k-50k, 0.0% for AGIs $50k-75k)
Profit/loss from farming: +$2,000 (reported on 6.5% of returns)
Here:
+$2,000
State:
+$2,327
IRA payment deduction: $2,833 (reported on 3.6% of returns)
61318:
$2,833
Illinois:
$3,087
Total itemized deductions: $14,233 (23% of AGI, reported on 25.5% of returns)
Here:
$14,233
State:
$20,239
Here:
23.5% of AGI
State:
19.5% of AGI
Charity contributions deductions: $2,103 (3% of AGI, reported on 20.2% of returns)
Here:
$2,103
State:
$3,719
Here:
3.4% of AGI
State:
3.4% of AGI
Total tax: $5,080 (reported on 74.5% of returns)
61318:
$5,080
State:
$9,882
(% of AGI for various income ranges: 2.8% for AGIs below $10k, 4.7% for AGIs $10k-25k, 6.9% for AGIs $25k-50k, 9.2% for AGIs $50k-75k, 11.3% for AGIs $75k-100k, 15.6% for AGIs over 100k)
Earned income credit: $1,354 (reported on 14.2% of returns)
Here:
$1,354
State:
$1,788
Percentage of individuals using paid preparers for their 2004 taxes: 62.6%
Here:
63%
State:
61%
(% for various income ranges: 48.8% for AGIs below $10k, 67.7% for AGIs $10k-25k, 61.3% for AGIs $25k-50k, 71.0% for AGIs $50k-75k, 66.7% for AGIs $75k-100k, 77.8% for AGIs over 100k)
Household received Food Stamps/SNAP in the past 12 months: 46 Household did not receive Food Stamps/SNAP in the past 12 months: 203
Women who had a birth in the past 12 months: 9 (1 now married, 7 unmarried) Women who did not have a birth in the past 12 months: 121 (41 now married, 80 unmarried)
Housing units in zip code 61318 with a mortgage: 86 (8 second mortgage, 8 both second mortgage and home equity loan) Houses without a mortgage: 16
Median monthly owner costs for units with a mortgage: $1,224 Median monthly owner costs for units without a mortgage: $472
Residents with income below the poverty level in 2022:
This zip code:
16.2%
Whole state:
11.9%
Residents with income below 50% of the poverty level in 2022:
This zip code:
4.9%
Whole state:
5.7%
Median number of rooms in houses and condos:
Here:
6.7
State:
6.4
Median number of rooms in apartments:
Here:
6.3
State:
4.1
Notable locations in this zip code not listed on our city pages
Notable locations in zip code 61318: Ackland Farm (A), Zimmerman Farms (B), Gilmore Farms (C), Compton Fire Department (D). Display/hide their locations on the map
Size of family households: 90 2-persons, 29 3-persons, 21 4-persons, 15 5-persons, 12 6-persons, 2 7-or-more-persons
Size of nonfamily households: 67 1-person, 8 2-persons, 1 4-persons
43 married couples with children.
84 single-parent households (50 men, 34 women).
87.3% of residents of 61318 zip code speak English at home.
12.0% of residents speak Spanish at home (81% very well, 19% well).
Foreign born population: 2 (0.3%) (50.2% of them are naturalized citizens)
This zip code:
0.3%
Whole state:
14.4%
23%English
22%German
13%American
7%Polish
3%Italian
3%Irish
1%Czechoslovakian
Year of entry for the foreign-born population
02010 or later
12000 to 2009
01990 to 1999
0Before 1990
Facilities with environmental interests located in this zip code:
MAYRATH INDUSTRIES INC (907 IL RTE 251 in COMPTON, IL)
(Resource Conservation and Recovery Act (tracking hazardous waste)) Organizations: CONSOLIDATED LEASING CO (CONTACT/OWNER)
CROP PRODUCTION SERVICES (792 STATE ROUTE 251 in COMPTON, IL)
ENFORCEMENT/COMPLIANCE ACTIVITY (Integrated Compliance Information System)
Housing units lacking complete plumbing facilities: 0.6% Housing units lacking complete kitchen facilities: 0.6%
48.0%Bottled, tank, or LP gas
36.1%Utility gas
9.8%Electricity
3.3%Wood
3.3%Other fuel
Population in 1990: 551. Population change in the 1990s: +171 (+31.0%).
Place of birth for U.S.-born residents:
This state: 534
Northeast: 4
Midwest: 47
South: 13
West: 8
68% of the 61318 zip code residents lived in the same house 5 years ago. Out of people who lived in different houses, 27% lived in this county. Out of people who lived in different counties, 50% lived in Illinois.
92% of the 61318 zip code residents lived in the same house 1 year ago. Out of people who lived in different houses, 34% moved from this county. Out of people who lived in different houses, 53% moved from different county within same state. Out of people who lived in different houses, 12% moved from abroad.
Private vs. public school enrollment:
Students in private schools in grades 1 to 8 (elementary and middle school): 1
Here:
2.5%
Illinois:
13.3%
Students in private schools in grades 9 to 12 (high school):
Here:
0.0%
Illinois:
9.9%
Students in private undergraduate colleges:
Here:
0.0%
Illinois:
27.4%
Occupation by median earnings in the past 12 months ($)
86,119Construction and extraction occupations
61,115Health diagnosing and treating practitioners and other technical occupations
53,555Management occupations
53,344Building and grounds cleaning and maintenance occupations
53,057Transportation occupations
51,892Installation, maintenance, and repair occupations
Top industries in this zip code by the number of employees in 2005:
Accommodation and Food Services: Full-Service Restaurants (5-9 employees: 1 establishment)
Other Services (except Public Administration): Religious Organizations (5-9: 1)
Construction: New Single-Family Housing Construction (except Operative Builders) (5-9: 1)
Administrative and Support and Waste Management and Remediation Services: Landscaping Services (1-4: 1)
Accommodation and Food Services: Drinking Places (Alcoholic Beverages) (1-4: 1)
Wholesale Trade: Metal Service Centers and Other Metal Merchant Wholesalers (1-4: 1)
Construction: Other Building Equipment Contractors (1-4: 1)
Fatal accident statistics in 2012:
Fatal accident count: 1
Vehicles involved in fatal accidents: 1
Fatal accidents caused by drunken drivers: 0
Fatalities: 1
Persons involved in fatal accidents: 1
Pedestrians involved in fatal accidents: 1
Fatal accident statistics in 2011:
Fatal accident count: 1
Vehicles involved in fatal accidents: 1
Fatal accidents caused by drunken drivers: 0
Fatalities: 1
Persons involved in fatal accidents: 2
Pedestrians involved in fatal accidents: 0
2002 - 2018 National Fire Incident Reporting System (NFIRS) incidents
Based on the data from the years 2002 - 2018 the average number of fire incidents per year is 8. The highest number of fire incidents - 17 took place in 2014, and the least - 0 in 2005. The data has a growing trend.
When looking into fire subcategories, the most reports belonged to: Structure Fires (48.5%), and Outside Fires (39.6%).
Fire incident types reported to NFIRS in Zip Code 61318


 Nearest zip codes: 61378, 61353, 60553, 60530, 61342, 60518.


 Based on the data from the years 2002 - 2018 the average number of fire incidents per year is 8. The highest number of fire incidents - 17 took place in 2014, and the least - 0 in 2005. The data has a growing trend.
 When looking into fire subcategories, the most reports belonged to: Structure Fires (48.5%), and Outside Fires (39.6%).