Estimated zip code population in 2022: 1,220 Zip code population in 2010: 1,333 Zip code population in 2000: 1,298
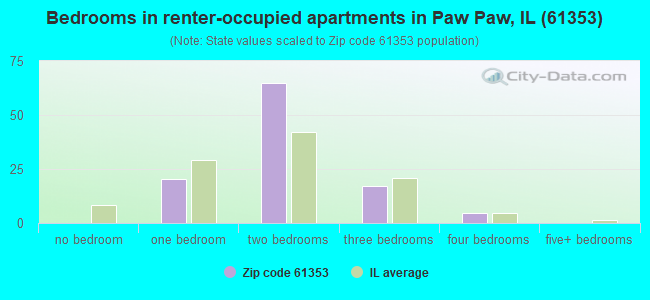
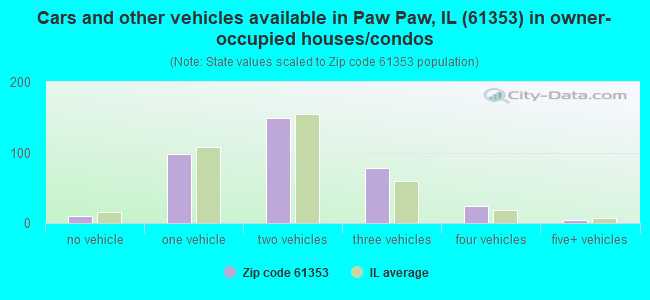
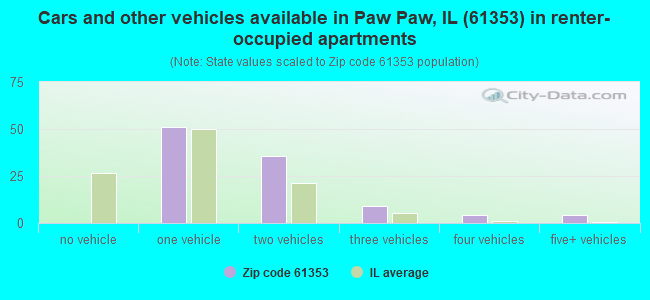
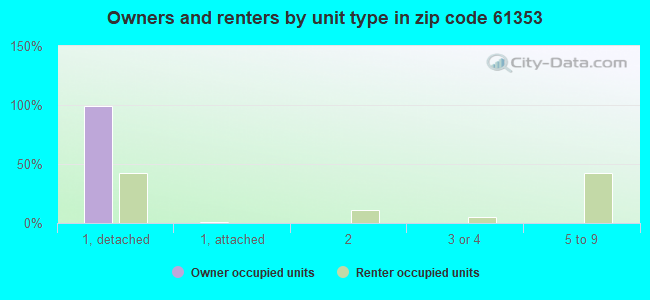
Houses and condos: 581 Renter-occupied apartments: 107
% of renters here:
23%
State:
33%
March 2022 cost of living index in zip code 61353: 85.4 (less than average, U.S. average is 100)
Land area: 31.8 sq. mi. Water area: 0.1 sq. mi.
Population density: 38 people per square mile
(very low).
OSM Map
General Map
Google Map
MSN Map
OSM Map
General Map
Google Map
MSN Map
OSM Map
General Map
Google Map
MSN Map
OSM Map
General Map
Google Map
MSN Map
Please wait while loading the map...
Real estate property taxes paid for housing units in 2022:
This zip code:
2.0% ($3,238)
Illinois:
2.0% ($4,912)
Median real estate property taxes paid for housing units with mortgages in 2022: $3,349 (2.2%) Median real estate property taxes paid for housing units with no mortgage in 2022: $3,053 (1.8%)
Business Search- 14 Million verified businesses
Males: 597
(49.0%)
Females: 623
(51.0%)
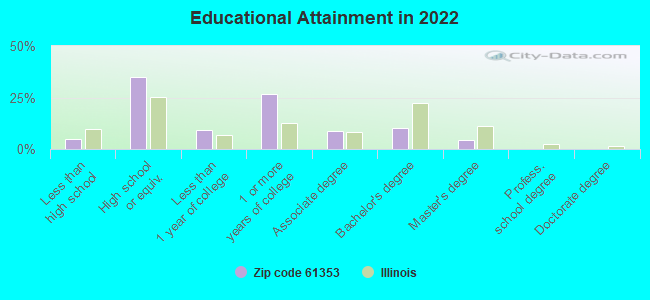
For population 25 years and over in 61353:
High school or higher: 92.9%
Bachelor's degree or higher: 14.5%
Graduate or professional degree: 4.4%
Unemployed: 4.3%
Mean travel time to work (commute): 38.1 minutes
For population 15 years and over in 61353:
Never married: 24.0%
Now married: 58.5%
Separated: 1.8%
Widowed: 7.2%
Divorced: 8.5%
Zip code 61353 compared to state average:
Median house value below state average.
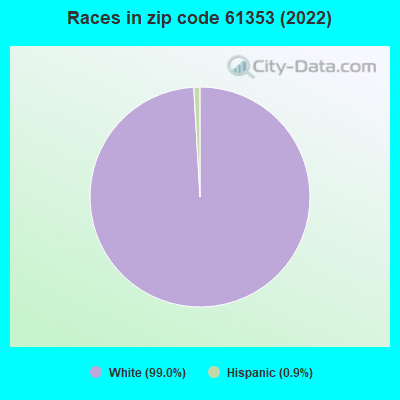
Black race population percentage significantly below state average.
Hispanic race population percentage significantly below state average.
Median age below state average.
Foreign-born population percentage significantly below state average.
Percentage of population with a bachelor's degree or higher significantly below state average.
Averages for the 2020 tax year for zip code 61353, filed in 2021:
Average Adjusted Gross Income (AGI) in 2020: $59,036 (Individual Income Tax Returns)
Here:
$59,036
State:
$82,626
Salary/wage: $54,640 (reported on 78.7% of returns)
Here:
$54,640
State:
$66,640
(% of AGI for various income ranges: 1108.3% for AGIs below $25k, 3647.3% for AGIs $25k-50k, 5776.2% for AGIs $50k-75k, 8226.7% for AGIs $75k-100k, 16182.9% for AGIs $100k-200k)
Taxable interest for individuals: $324 (reported on 34.4% of returns)
This zip code:
$324
Illinois:
$2,376
(% of AGI for various income ranges: 18.3% for AGIs below $25k, 6.4% for AGIs $25k-50k, 18.8% for AGIs $50k-75k, 8.3% for AGIs $75k-100k, 27.1% for AGIs $100k-200k)
Ordinary dividends: $1,120 (reported on 16.4% of returns)
Here:
$1,120
State:
$9,061
(% of AGI for various income ranges: 25.0% for AGIs below $25k, 61.3% for AGIs $50k-75k, 47.1% for AGIs $100k-200k)
Net capital gain/loss in AGI: +$2,329 (reported on 11.5% of returns)
Here:
+$2,329
State:
+$31,684
(% of AGI for various income ranges: 35.8% for AGIs below $25k, 41.2% for AGIs $50k-75k, 124.3% for AGIs $100k-200k)
Profit/loss from business: +$4,375 (reported on 13.1% of returns)
Here:
+$4,375
State:
+$12,175
(% of AGI for various income ranges: 145.0% for AGIs below $25k, 75.5% for AGIs $25k-50k, 155.0% for AGIs $75k-100k)
Taxable individual retirement arrangement distribution: $12,214 (reported on 11.5% of returns)
61353:
$12,214
Illinois:
$21,613
(% of AGI for various income ranges: 174.5% for AGIs $25k-50k, 1105.0% for AGIs $75k-100k)
Total itemized deductions: $28,300 (reported on 3.3% of returns)
Here:
$28,300
State:
$34,948
(% of AGI for various income ranges: 707.5% for AGIs $50k-75k)
Taxes paid: $7,750 (reported on 3.3% of returns)
61353:
$7,750
State:
$8,563
(% of AGI for various income ranges: 193.8% for AGIs $50k-75k)
Earned income credit: $1,957 (reported on 11.5% of returns)
Here:
$1,957
State:
$2,311
(% of AGI for various income ranges: 60.0% for AGIs below $25k, 59.1% for AGIs $25k-50k)
Percentage of individuals using paid preparers for their 2020 taxes: 95.1%
Here:
95%
State:
93%
(% for various income ranges: 94.4% for AGIs below $25k, 92.9% for AGIs $25k-50k, 100.0% for AGIs $50k-75k, 87.5% for AGIs $75k-100k, 100.0% for AGIs $100k-200k)
Averages for the 2012 tax year for zip code 61353, filed in 2013:
Average Adjusted Gross Income (AGI) in 2012: $49,287 (Individual Income Tax Returns)
Here:
$49,287
State:
$68,058
Salary/wage: $40,120 (reported on 81.0% of returns)
Here:
$40,120
State:
$55,396
(% of AGI for various income ranges: 69.0% for AGIs below $25k, 65.7% for AGIs $25k-50k, 67.1% for AGIs $50k-75k, 71.0% for AGIs $75k-100k, 61.2% for AGIs $100k-200k)
Taxable interest for individuals: $580 (reported on 39.7% of returns)
This zip code:
$580
Illinois:
$1,969
(% of AGI for various income ranges: 0.7% for AGIs below $25k, 0.4% for AGIs $25k-50k, 0.3% for AGIs $50k-75k, 0.4% for AGIs $75k-100k, 0.6% for AGIs $100k-200k)
Ordinary dividends: $2,390 (reported on 15.9% of returns)
Here:
$2,390
State:
$7,786
(% of AGI for various income ranges: 0.9% for AGIs below $25k, 0.4% for AGIs $25k-50k, 0.5% for AGIs $50k-75k, 0.6% for AGIs $75k-100k, 1.3% for AGIs $100k-200k)
Net capital gain/loss in AGI: +$814 (reported on 11.1% of returns)
Here:
+$814
State:
+$22,183
Profit/loss from business: +$5,580 (reported on 15.9% of returns)
Here:
+$5,580
State:
+$12,903
(% of AGI for various income ranges: 6.1% for AGIs below $25k, 4.7% for AGIs $25k-50k, 2.5% for AGIs $75k-100k)
Taxable individual retirement arrangement distribution: $9,729 (reported on 11.1% of returns)
61353:
$9,729
Illinois:
$17,929
Total itemized deductions: $16,974 (23% of AGI, reported on 36.5% of returns)
Here:
$16,974
State:
$26,433
Here:
22.8% of AGI
State:
19.2% of AGI
(% of AGI for various income ranges: 11.5% for AGIs below $25k, 13.1% for AGIs $25k-50k, 12.7% for AGIs $50k-75k, 12.6% for AGIs $75k-100k, 12.5% for AGIs $100k-200k)
Charity contributions: $2,100 (reported on 25.4% of returns)
Here:
$2,100
State:
$4,525
(% of AGI for various income ranges: 1.4% for AGIs $25k-50k, 1.1% for AGIs $50k-75k, 1.1% for AGIs $75k-100k, 1.2% for AGIs $100k-200k)
Taxes paid: $6,739 (reported on 36.5% of returns)
61353:
$6,739
State:
$11,968
(% of AGI for various income ranges: 3.7% for AGIs below $25k, 4.4% for AGIs $25k-50k, 4.7% for AGIs $50k-75k, 4.7% for AGIs $75k-100k, 6.1% for AGIs $100k-200k)
Earned income credit: $2,200 (reported on 12.7% of returns)
Here:
$2,200
State:
$2,349
(% of AGI for various income ranges: 4.8% for AGIs below $25k, 0.8% for AGIs $25k-50k)
Percentage of individuals using paid preparers for their 2012 taxes: 60.3%
Here:
60%
State:
57%
(% for various income ranges: 52.2% for AGIs below $25k, 57.1% for AGIs $25k-50k, 66.7% for AGIs $50k-75k, 71.4% for AGIs $75k-100k, 71.4% for AGIs $100k-200k)
Averages for the 2004 tax year for zip code 61353, filed in 2005:
Average Adjusted Gross Income (AGI) in 2004: $39,221 (Individual Income Tax Returns)
Here:
$39,221
State:
$54,625
Salary/wage: $35,885 (reported on 84.9% of returns)
Here:
$35,885
State:
$46,811
(% of AGI for various income ranges: 103.3% for AGIs below $10k, 61.7% for AGIs $10k-25k, 77.8% for AGIs $25k-50k, 80.9% for AGIs $50k-75k, 84.7% for AGIs $75k-100k, 66.9% for AGIs over 100k)
Taxable interest for individuals: $912 (reported on 52.7% of returns)
This zip code:
$912
Illinois:
$2,101
(% of AGI for various income ranges: 10.9% for AGIs below $10k, 5.6% for AGIs $10k-25k, 0.9% for AGIs $25k-50k, 0.7% for AGIs $50k-75k, 0.3% for AGIs $75k-100k, 0.5% for AGIs over 100k)
Taxable dividends: $820 (reported on 22.1% of returns)
Here:
$820
State:
$4,306
(% of AGI for various income ranges: 2.7% for AGIs below $10k, 1.8% for AGIs $10k-25k, 0.3% for AGIs $25k-50k, 0.4% for AGIs $50k-75k, 0.3% for AGIs $75k-100k)
Net capital gain/loss: +$4,214 (reported on 11.6% of returns)
Here:
+$4,214
State:
+$17,321
(% of AGI for various income ranges: -3.0% for AGIs below $10k, 0.0% for AGIs $10k-25k, -0.0% for AGIs $25k-50k, 0.4% for AGIs $50k-75k, 5.4% for AGIs $75k-100k)
Profit/loss from business: +$6,215 (reported on 17.8% of returns)
Here:
+$6,215
State:
+$11,771
(% of AGI for various income ranges: 0.3% for AGIs below $10k, 7.6% for AGIs $10k-25k, 4.5% for AGIs $25k-50k, 1.2% for AGIs $50k-75k, 2.7% for AGIs $75k-100k)
Profit/loss from farming: +$2,560 (reported on 4.2% of returns)
Here:
+$2,560
State:
+$2,327
IRA payment deduction: $3,273 (reported on 1.8% of returns)
61353:
$3,273
Illinois:
$3,087
Total itemized deductions: $16,105 (27% of AGI, reported on 39.4% of returns)
Here:
$16,105
State:
$20,239
Here:
27.1% of AGI
State:
19.5% of AGI
(% of AGI for various income ranges: 19.0% for AGIs $10k-25k, 16.6% for AGIs $25k-50k, 16.7% for AGIs $50k-75k, 17.4% for AGIs $75k-100k, 12.2% for AGIs over 100k)
Charity contributions deductions: $1,973 (3% of AGI, reported on 31.1% of returns)
Here:
$1,973
State:
$3,719
Here:
3.3% of AGI
State:
3.4% of AGI
(% of AGI for various income ranges: 2.6% for AGIs $10k-25k, 1.5% for AGIs $25k-50k, 1.4% for AGIs $50k-75k, 1.7% for AGIs $75k-100k, 1.4% for AGIs over 100k)
Total tax: $4,316 (reported on 74.8% of returns)
61353:
$4,316
State:
$9,882
(% of AGI for various income ranges: 2.4% for AGIs below $10k, 4.8% for AGIs $10k-25k, 6.4% for AGIs $25k-50k, 7.9% for AGIs $50k-75k, 9.6% for AGIs $75k-100k, 13.2% for AGIs over 100k)
Earned income credit: $1,815 (reported on 10.8% of returns)
Here:
$1,815
State:
$1,788
Percentage of individuals using paid preparers for their 2004 taxes: 59.0%
Here:
59%
State:
61%
(% for various income ranges: 39.8% for AGIs below $10k, 61.1% for AGIs $10k-25k, 64.0% for AGIs $25k-50k, 62.4% for AGIs $50k-75k, 71.0% for AGIs $75k-100k, 61.5% for AGIs over 100k)
Household received Food Stamps/SNAP in the past 12 months: 82 Household did not receive Food Stamps/SNAP in the past 12 months: 390
Women who had a birth in the past 12 months: 15 (8 now married, 6 unmarried) Women who did not have a birth in the past 12 months: 210 (117 now married, 92 unmarried)
Housing units in zip code 61353 with a mortgage: 221 (21 second mortgage, 16 both second mortgage and home equity loan) Houses without a mortgage: 3
Median monthly owner costs for units with a mortgage: $1,285 Median monthly owner costs for units without a mortgage: $594
Residents with income below the poverty level in 2022:
This zip code:
6.5%
Whole state:
11.9%
Residents with income below 50% of the poverty level in 2022:
This zip code:
2.2%
Whole state:
5.7%
Median number of rooms in houses and condos:
Here:
6.6
State:
6.4
Median number of rooms in apartments:
Here:
4.2
State:
4.1
Notable locations in this zip code not listed on our city pages
Churches in zip code 61353 include: First Baptist Church (A), First Presbyterian Church (B), Paw Paw Bible Church (C), Paw Paw United Methodist Church (D). Display/hide their locations on the map
Size of family households: 112 2-persons, 84 3-persons, 37 4-persons, 7 5-persons, 10 6-persons, 16 7-or-more-persons
Size of nonfamily households: 156 1-person, 46 2-persons, 2 3-persons
210 married couples with children.
45 single-parent households (25 men, 20 women).
97.3% of residents of 61353 zip code speak English at home.
1.2% of residents speak Spanish at home (86% very well, 14% well).
0.7% of residents speak other Indo-European language at home (38% very well, 62% well).
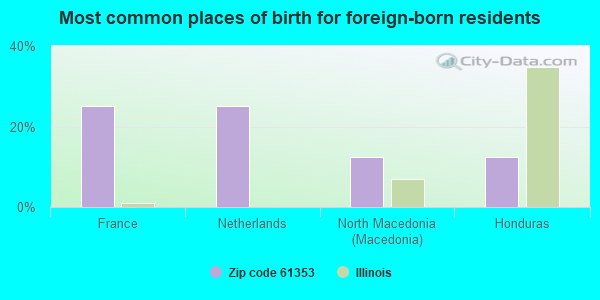
Foreign born population: 8 (0.7%) (50.2% of them are naturalized citizens)
This zip code:
0.7%
Whole state:
14.4%
25%France
25%Netherlands
12%North Macedonia (Macedonia)
12%Honduras
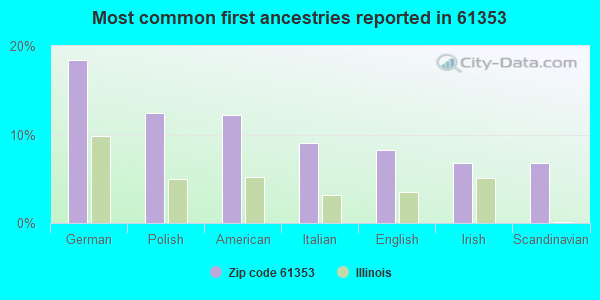
18%German
12%Polish
12%American
9%Italian
8%English
7%Irish
7%Scandinavian
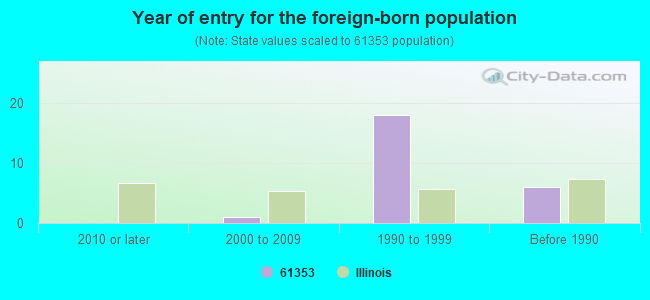
Year of entry for the foreign-born population
02010 or later
12000 to 2009
181990 to 1999
6Before 1990
Facilities with environmental interests located in this zip code:
IL DOT-WILLOW CREEK REST AREA (FAI ROUTE 39, APPROX 2 MILES in PAW PAW, IL)
STATE MASTER (Illinois EPA Project) - National Pollutant Discharge Elimination System Permit National Pollutant Discharge Elimination System NON-MAJOR (Tracking pollutant discharge elimination systems) - permit Business SIC classification: REGULATION AND ADMINISTRATION OF TRANSPORTATION PROGRAMS Alternative names: WILLOW CREEK REST AREA STP
PAW PAW COOP GRAIN CO (EARLVILLE ROAD in PAW PAW, IL)
STATE MASTER (Illinois EPA Project) - AIR PROGRAM AIR MINOR (AIRS/AFS) Business SIC classification: GRAIN AND FIELD BEANS
PAW PAW STP (WEST END OF LIONS DRIVE in PAW PAW, IL)
STATE MASTER (Illinois EPA Project) - National Pollutant Discharge Elimination System Permit National Pollutant Discharge Elimination System NON-MAJOR (Tracking pollutant discharge elimination systems) - permit Business SIC classification: SEWERAGE SYSTEMS Alternative names: PAW PAW STP, VILLAGE OF
RICHARD I MOOREHEAD (P O BOX 5 in PAW PAW, IL)
STATE MASTER (Illinois EPA Project) - AIR PROGRAM AIR MINOR (AIRS/AFS) Business SIC classification: PETROLEUM BULK STATIONS AND TERMINALS
PAW PAW SCHOOL (511 N CHAPMAN in PAW PAW, IL)
STATE MASTER (Illinois EPA Project) - HAZARDOUS WASTE PROGRAM Conditionally Exempt Small Quantity Generators, less than 100 kg/month of hazardous waste (Resource Conservation and Recovery Act (tracking hazardous waste)) - notification Organizations: LEE SCHOOL DISTRICT (CONTACT/OWNER)
PAW PAW ELEM SCHOOL (PO BOX 37 in PAW PAW, IL)
(National Center for Education Statistics) - STATE ID-4705227102005 Organizations: LEE CENTER C U SCHOOL DIST 271 (SCHOOL DISTRICT)
PAW PAW JR/SR HIGH SCHOOL (PO BOX 37 in PAW PAW, IL)
(National Center for Education Statistics) - STATE ID-4705227100004 Organizations: LEE CENTER C U SCHOOL DIST 271 (SCHOOL DISTRICT)
LEE CENTER COMMUNITY UNIT SD #271 (511 CHAPMAN ST in PAW PAW, IL)
COMPLIANCE ACTIVITY (Tracking inspections of insecticide, fungicide, and rodenticide, and toxic substances)
Housing units lacking complete plumbing facilities: 5.3% Housing units lacking complete kitchen facilities: 6.5%
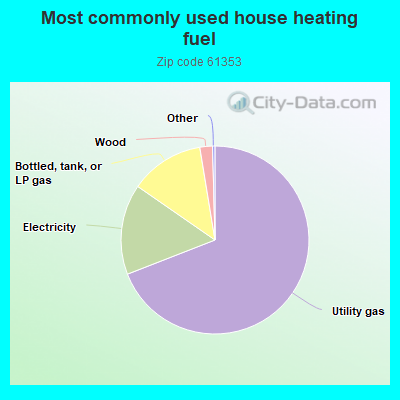
69.3%Utility gas
15.6%Electricity
12.8%Bottled, tank, or LP gas
2.2%Wood
Population in 1990: 1,539.
Place of birth for U.S.-born residents:
This state: 1,036
Northeast: 20
Midwest: 55
South: 33
West: 42
69% of the 61353 zip code residents lived in the same house 5 years ago. Out of people who lived in different houses, 32% lived in this county. Out of people who lived in different counties, 50% lived in Illinois.
92% of the 61353 zip code residents lived in the same house 1 year ago. Out of people who lived in different houses, 26% moved from this county. Out of people who lived in different houses, 63% moved from different county within same state. Out of people who lived in different houses, 11% moved from different state. Out of people who lived in different houses, 3% moved from abroad.
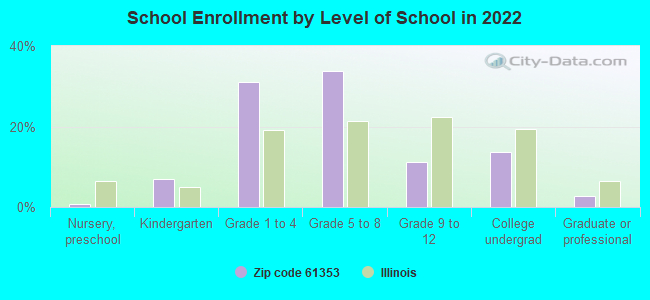
Private vs. public school enrollment:
Students in private schools in grades 1 to 8 (elementary and middle school): 18
Here:
9.1%
Illinois:
13.3%
Students in private schools in grades 9 to 12 (high school): 16
Here:
46.7%
Illinois:
9.9%
Students in private undergraduate colleges: 4
Here:
10.6%
Illinois:
27.4%
Occupation by median earnings in the past 12 months ($)
77,840Construction and extraction occupations
66,577Health technologists and technicians
66,420Management occupations
59,300Health diagnosing and treating practitioners and other technical occupations
56,401Production occupations
46,995Transportation occupations
Top industries in this zip code by the number of employees in 2005:
Finance and Insurance: Commercial Banking (5-9 employees: 1 establishment)
Wholesale Trade: Stationery and Office Supplies Merchant Wholesalers (5-9: 1)
Health Care and Social Assistance: Child Day Care Services (5-9: 1)
Construction: Roofing Contractors (1-4: 2)
Accommodation and Food Services: Limited-Service Restaurants (1-4: 2)
Construction: Plumbing, Heating, and Air-Conditioning Contractors (1-4: 1)
Health Care and Social Assistance: Offices of Physicians (except Mental Health Specialists) (1-4: 1)
Administrative and Support and Waste Management and Remediation Services: Landscaping Services (1-4: 1)
Fatal accident statistics in 2012:
Fatal accident count: 1
Vehicles involved in fatal accidents: 2
Fatal accidents caused by drunken drivers: 0
Fatalities: 1
Persons involved in fatal accidents: 2
Pedestrians involved in fatal accidents: 0
2006 - 2018 National Fire Incident Reporting System (NFIRS) incidents
According to the data from the years 2006 - 2018 the average number of fire incidents per year is 11. The highest number of reported fires - 30 took place in 2010, and the least - 1 in 2018. The data has a dropping trend.
When looking into fire subcategories, the most reports belonged to: Structure Fires (43.8%), and Outside Fires (37.5%).
Fire incident types reported to NFIRS in Zip Code 61353

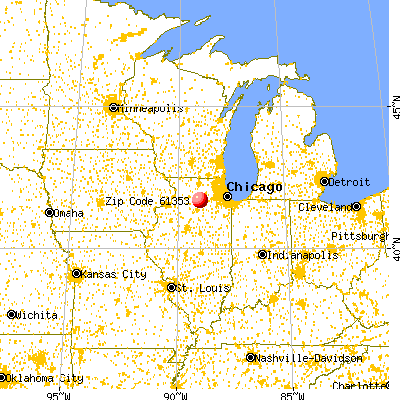


 Nearest zip codes: 61318, 60530, 60518, 60553, 60550, 61378.


 According to the data from the years 2006 - 2018 the average number of fire incidents per year is 11. The highest number of reported fires - 30 took place in 2010, and the least - 1 in 2018. The data has a dropping trend.
 When looking into fire subcategories, the most reports belonged to: Structure Fires (43.8%), and Outside Fires (37.5%).