Estimated zip code population in 2022: 1,295 Zip code population in 2010: 1,489 Zip code population in 2000: 1,476
Houses and condos: 629 Renter-occupied apartments: 122
% of renters here:
22%
State:
33%
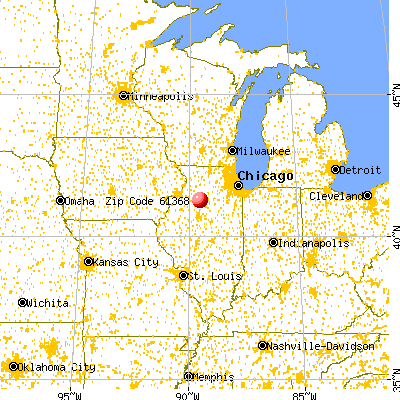
March 2022 cost of living index in zip code 61368: 84.3 (less than average, U.S. average is 100)
Land area: 73.5 sq. mi. Water area: 0.1 sq. mi.
Population density: 18 people per square mile
(very low).
OSM Map
General Map
Google Map
MSN Map
OSM Map
General Map
Google Map
MSN Map
OSM Map
General Map
Google Map
MSN Map
OSM Map
General Map
Google Map
MSN Map
Please wait while loading the map...
Real estate property taxes paid for housing units in 2022:
This zip code:
1.9% ($2,307)
Illinois:
2.0% ($4,912)
Median real estate property taxes paid for housing units with mortgages in 2022: $2,334 (1.6%) Median real estate property taxes paid for housing units with no mortgage in 2022: $2,317 (2.3%)
Business Search- 14 Million verified businesses
Males: 687
(53.1%)
Females: 608
(46.9%)
For population 25 years and over in 61368:
High school or higher: 91.1%
Bachelor's degree or higher: 24.4%
Graduate or professional degree: 8.9%
Unemployed: 1.9%
Mean travel time to work (commute): 23.1 minutes
For population 15 years and over in 61368:
Never married: 38.1%
Now married: 48.4%
Separated: 1.1%
Widowed: 5.3%
Divorced: 7.1%
Zip code 61368 compared to state average:
Median house value below state average.
Unemployed percentage below state average.
Black race population percentage significantly below state average.
Hispanic race population percentage significantly below state average.
Foreign-born population percentage significantly below state average.
Length of stay since moving in significantly above state average.
Number of rooms per house above state average.
House age above state average.
Number of college students below state average.
Percentage of population with a bachelor's degree or higher below state average.
Estimated median house/condo value in 2022: $124,064
61368:
$124,064
Illinois:
$251,600
According to our research of Illinois and other state lists, there were 2 registered sex offenders living in 61368 zip code as of May 28, 2024. The ratio of all residents to sex offenders in zip code 61368 is 756 to 1. The ratio of registered sex offenders to all residents in this zip code is near the state average.
Median resident age:
This zip code:
41.0 years
Illinois median age:
39.1 years
Average household size:
This zip code:
2.3 people
Illinois:
2.4 people
Averages for the 2020 tax year for zip code 61368, filed in 2021:
Average Adjusted Gross Income (AGI) in 2020: $56,553 (Individual Income Tax Returns)
Here:
$56,553
State:
$82,626
Salary/wage: $46,524 (reported on 76.6% of returns)
Here:
$46,524
State:
$66,640
(% of AGI for various income ranges: 1160.0% for AGIs below $25k, 3237.7% for AGIs $25k-50k, 5998.3% for AGIs $50k-75k, 7725.0% for AGIs $75k-100k, 21825.0% for AGIs $100k-200k)
Taxable interest for individuals: $883 (reported on 35.9% of returns)
This zip code:
$883
Illinois:
$2,376
(% of AGI for various income ranges: 29.3% for AGIs below $25k, 25.4% for AGIs $25k-50k, 11.7% for AGIs $50k-75k, 103.3% for AGIs $75k-100k, 150.0% for AGIs $100k-200k)
Ordinary dividends: $2,221 (reported on 21.9% of returns)
Here:
$2,221
State:
$9,061
(% of AGI for various income ranges: 36.4% for AGIs below $25k, 37.7% for AGIs $25k-50k, 131.7% for AGIs $75k-100k, 330.0% for AGIs $100k-200k)
Net capital gain/loss in AGI: +$8,558 (reported on 18.8% of returns)
Here:
+$8,558
State:
+$31,684
(% of AGI for various income ranges: 22.9% for AGIs below $25k, 58.3% for AGIs $50k-75k, 256.7% for AGIs $75k-100k, 2015.0% for AGIs $100k-200k)
Profit/loss from business: +$6,714 (reported on 10.9% of returns)
Here:
+$6,714
State:
+$12,175
(% of AGI for various income ranges: 31.4% for AGIs below $25k, 130.0% for AGIs $25k-50k, 428.3% for AGIs $75k-100k)
Taxable individual retirement arrangement distribution: $10,057 (reported on 10.9% of returns)
61368:
$10,057
Illinois:
$21,613
(% of AGI for various income ranges: 76.4% for AGIs below $25k, 120.8% for AGIs $25k-50k, 733.3% for AGIs $75k-100k)
Earned income credit: $2,657 (reported on 10.9% of returns)
Here:
$2,657
State:
$2,311
(% of AGI for various income ranges: 80.7% for AGIs below $25k, 56.2% for AGIs $25k-50k)
Percentage of individuals using paid preparers for their 2020 taxes: 96.9%
Here:
97%
State:
93%
(% for various income ranges: 95.2% for AGIs below $25k, 94.1% for AGIs $25k-50k, 100.0% for AGIs $50k-75k, 100.0% for AGIs $75k-100k, 100.0% for AGIs $100k-200k)
Averages for the 2012 tax year for zip code 61368, filed in 2013:
Average Adjusted Gross Income (AGI) in 2012: $47,612 (Individual Income Tax Returns)
Here:
$47,612
State:
$68,058
Salary/wage: $36,521 (reported on 79.1% of returns)
Here:
$36,521
State:
$55,396
(% of AGI for various income ranges: 62.0% for AGIs below $25k, 71.5% for AGIs $25k-50k, 73.8% for AGIs $50k-75k, 68.7% for AGIs $75k-100k, 38.4% for AGIs $100k-200k)
Taxable interest for individuals: $1,012 (reported on 37.3% of returns)
This zip code:
$1,012
Illinois:
$1,969
(% of AGI for various income ranges: 2.0% for AGIs below $25k, 1.1% for AGIs $25k-50k, 0.6% for AGIs $50k-75k, 0.5% for AGIs $75k-100k, 0.6% for AGIs $100k-200k)
Ordinary dividends: $1,435 (reported on 25.4% of returns)
Here:
$1,435
State:
$7,786
(% of AGI for various income ranges: 1.1% for AGIs below $25k, 1.3% for AGIs $25k-50k, 1.0% for AGIs $50k-75k, 0.3% for AGIs $75k-100k, 0.5% for AGIs $100k-200k)
Net capital gain/loss in AGI: +$209 (reported on 16.4% of returns)
Here:
+$209
State:
+$22,183
(% of AGI for various income ranges: 0.5% for AGIs $75k-100k)
Profit/loss from business: +$6,138 (reported on 11.9% of returns)
Here:
+$6,138
State:
+$12,903
Taxable individual retirement arrangement distribution: $10,222 (reported on 13.4% of returns)
61368:
$10,222
Illinois:
$17,929
(% of AGI for various income ranges: 5.3% for AGIs below $25k, 2.7% for AGIs $25k-50k, 4.1% for AGIs $50k-75k, 4.8% for AGIs $75k-100k)
Total itemized deductions: $16,900 (23% of AGI, reported on 22.4% of returns)
Here:
$16,900
State:
$26,433
Here:
22.8% of AGI
State:
19.2% of AGI
(% of AGI for various income ranges: 10.1% for AGIs $25k-50k, 8.3% for AGIs $50k-75k, 7.7% for AGIs $75k-100k, 9.1% for AGIs $100k-200k)
Charity contributions: $4,222 (reported on 13.4% of returns)
Here:
$4,222
State:
$4,525
(% of AGI for various income ranges: 1.9% for AGIs below $25k, 2.5% for AGIs $50k-75k, 1.4% for AGIs $100k-200k)
Taxes paid: $5,600 (reported on 20.9% of returns)
61368:
$5,600
State:
$11,968
(% of AGI for various income ranges: 2.8% for AGIs $25k-50k, 2.3% for AGIs $50k-75k, 2.7% for AGIs $75k-100k, 3.1% for AGIs $100k-200k)
Earned income credit: $2,322 (reported on 13.4% of returns)
Here:
$2,322
State:
$2,349
(% of AGI for various income ranges: 4.8% for AGIs below $25k, 1.2% for AGIs $25k-50k)
Percentage of individuals using paid preparers for their 2012 taxes: 64.2%
Here:
64%
State:
57%
(% for various income ranges: 53.8% for AGIs below $25k, 62.5% for AGIs $25k-50k, 75.0% for AGIs $50k-75k, 71.4% for AGIs $75k-100k, 83.3% for AGIs $100k-200k)
Averages for the 2004 tax year for zip code 61368, filed in 2005:
Average Adjusted Gross Income (AGI) in 2004: $36,428 (Individual Income Tax Returns)
Here:
$36,428
State:
$54,625
Salary/wage: $31,121 (reported on 78.6% of returns)
Here:
$31,121
State:
$46,811
(% of AGI for various income ranges: 112.8% for AGIs below $10k, 60.7% for AGIs $10k-25k, 72.6% for AGIs $25k-50k, 77.0% for AGIs $50k-75k, 72.2% for AGIs $75k-100k, 32.5% for AGIs over 100k)
Taxable interest for individuals: $1,870 (reported on 53.6% of returns)
This zip code:
$1,870
Illinois:
$2,101
(% of AGI for various income ranges: 20.5% for AGIs below $10k, 3.5% for AGIs $10k-25k, 1.9% for AGIs $25k-50k, 3.1% for AGIs $50k-75k, 2.0% for AGIs $75k-100k, 2.5% for AGIs over 100k)
Taxable dividends: $1,513 (reported on 29.3% of returns)
Here:
$1,513
State:
$4,306
(% of AGI for various income ranges: 3.4% for AGIs below $10k, 1.7% for AGIs $10k-25k, 1.0% for AGIs $25k-50k, 0.6% for AGIs $50k-75k, 1.9% for AGIs $75k-100k, 1.1% for AGIs over 100k)
Net capital gain/loss: +$768 (reported on 22.4% of returns)
Here:
+$768
State:
+$17,321
(% of AGI for various income ranges: 2.3% for AGIs below $10k, -0.2% for AGIs $10k-25k, 1.0% for AGIs $25k-50k, -0.1% for AGIs $50k-75k, 1.1% for AGIs $75k-100k)
Profit/loss from business: +$6,220 (reported on 14.9% of returns)
Here:
+$6,220
State:
+$11,771
(% of AGI for various income ranges: 12.3% for AGIs below $10k, 6.7% for AGIs $10k-25k, 2.5% for AGIs $25k-50k, 0.5% for AGIs $50k-75k, 3.9% for AGIs $75k-100k)
IRA payment deduction: $2,667 (reported on 2.2% of returns)
61368:
$2,667
Illinois:
$3,087
Total itemized deductions: $15,286 (26% of AGI, reported on 20.8% of returns)
Here:
$15,286
State:
$20,239
Here:
25.8% of AGI
State:
19.5% of AGI
(% of AGI for various income ranges: 16.4% for AGIs $10k-25k, 7.0% for AGIs $25k-50k, 8.4% for AGIs $50k-75k, 14.3% for AGIs $75k-100k)
Charity contributions deductions: $3,701 (6% of AGI, reported on 15.9% of returns)
Here:
$3,701
State:
$3,719
Here:
5.6% of AGI
State:
3.4% of AGI
(% of AGI for various income ranges: 1.3% for AGIs $10k-25k, 0.9% for AGIs $25k-50k, 1.6% for AGIs $50k-75k, 4.2% for AGIs $75k-100k)
Total tax: $4,593 (reported on 73.4% of returns)
61368:
$4,593
State:
$9,882
(% of AGI for various income ranges: 3.4% for AGIs below $10k, 4.6% for AGIs $10k-25k, 6.8% for AGIs $25k-50k, 7.7% for AGIs $50k-75k, 11.1% for AGIs $75k-100k, 18.8% for AGIs over 100k)
Earned income credit: $1,575 (reported on 12.9% of returns)
Here:
$1,575
State:
$1,788
Percentage of individuals using paid preparers for their 2004 taxes: 67.3%
Here:
67%
State:
61%
(% for various income ranges: 58.6% for AGIs below $10k, 66.5% for AGIs $10k-25k, 67.9% for AGIs $25k-50k, 70.9% for AGIs $50k-75k, 79.6% for AGIs $75k-100k, 75.0% for AGIs over 100k)
Household received Food Stamps/SNAP in the past 12 months: 88 Household did not receive Food Stamps/SNAP in the past 12 months: 471
Women who had a birth in the past 12 months: 9 (8 now married, 0 unmarried) Women who did not have a birth in the past 12 months: 273 (107 now married, 166 unmarried)
Housing units in zip code 61368 with a mortgage: 243 (5 second mortgage, 5 both second mortgage and home equity loan) Median monthly owner costs for units with a mortgage: $1,115 Median monthly owner costs for units without a mortgage: $525
Residents with income below the poverty level in 2022:
This zip code:
8.4%
Whole state:
11.9%
Residents with income below 50% of the poverty level in 2022:
This zip code:
4.7%
Whole state:
5.7%
Median number of rooms in houses and condos:
Here:
7.4
State:
6.4
Median number of rooms in apartments:
Here:
6.0
State:
4.1
Notable locations in this zip code not listed on our city pages
Notable locations in zip code 61368: Camp Menno-Haven (A), Tiskilwa Fire Protection District Station 1 and Ambulance Service (B). Display/hide their locations on the map
Cemeteries: Mount Bloom Cemetery (1), Oak Hill Cemetery (2), Catholic Cemetery (3), Saint Marys Cemetery (4), Lone Tree Cemetery (5), Willow Springs Cemetery (6). Display/hide their locations on the map
Size of family households: 148 2-persons, 75 3-persons, 42 4-persons, 27 5-persons, 33 6-persons
Size of nonfamily households: 173 1-person, 60 2-persons
214 married couples with children.
49 single-parent households (28 men, 21 women).
96.1% of residents of 61368 zip code speak English at home.
0.1% of residents speak Spanish at home (100% very well).
0.2% of residents speak other Indo-European language at home (100% well).
3.0% of residents speak Asian or Pacific Island language at home (84% very well, 16% not well).
Foreign born population: 22 (1.7%) (32.0% of them are naturalized citizens)
This zip code:
1.7%
Whole state:
14.4%
41%Cambodia
23%Thailand
31%German
18%Irish
15%American
14%English
8%Italian
1%Swedish
1%Scottish
Year of entry for the foreign-born population
02010 or later
42000 to 2009
141990 to 1999
1Before 1990
Facilities with environmental interests located in this zip code:
ADE MFG & CHEMICAL CO (SYCAMORE in TISKILWA, IL)
STATE MASTER (Illinois EPA Project) - HAZARDOUS WASTE PROGRAM, AIR PROGRAM, SOLID WASTE PROGRAM AIR MINOR (AIRS/AFS) CRITERIA AND HAZARDOUS AIR POLLUTANT INVENTORY (Inventory of air pollution sources) HAZARDOUS WASTE BIENNIAL REPORTER (Resource Conservation and Recovery Act (tracking hazardous waste)) Large Quantity Generators, more that 1000 kg of hazardous waste/month (Resource Conservation and Recovery Act (tracking hazardous waste)) - notification Business SIC classification: PREPARED FEEDS AND FEED INGREDIENTS FOR ANIMALS AND FOWLS, EXCEPT DOGS AND CATS Organizations: ADE MANUFACTURING AND CHEMICAL (CONTACT/OPERATOR)
, ROBERT WAGNER (CONTACT/OWNER)
Alternative names: ADE CHEMICAL
DEVER & SONS TRUCKING INC (225 E. MAIN in TISKILWA, IL)
STATE MASTER (Illinois EPA Project) - National Pollutant Discharge Elimination System Permit National Pollutant Discharge Elimination System NON-MAJOR (Tracking pollutant discharge elimination systems) - permit Organizations: DEVER & SONS TRUCKING, INC (CONTACT/OWNER)
REAGAN MIDDLE SCHOOL (PO BOX 329 in TISKILWA, IL)
(National Center for Education Statistics) - STATE ID-2800611502006 Organizations: PRINCETON ELEM SCHOOL DIST 115 (SCHOOL DISTRICT)
HARMON?LESLIE (405 CHURCH ST. in TISKILWA, IL)
National Pollutant Discharge Elimination System NON-MAJOR (Tracking pollutant discharge elimination systems) - permit Alternative names: HARMON, LESLIE
INDIANTOWN TOWNSHIP (600 W BREWSTER ST in TISKILWA, IL)
Small Quantity Generators, between 100 kg and 1000 kg of hazardous waste/month (Resource Conservation and Recovery Act (tracking hazardous waste)) - notification
CHUCKS AUTO RPR (330 WASHINGTON ST in TISKILWA, IL)
Conditionally Exempt Small Quantity Generators, less than 100 kg/month of hazardous waste (Resource Conservation and Recovery Act (tracking hazardous waste)) - notification Organizations: LUCAS CHARLES (CONTACT/OWNER)
AG VIEW FS INC. (235 EAST OWENS in TISKILWA, IL)
ENFORCEMENT/COMPLIANCE ACTIVITY (Integrated Compliance Information System)
Housing units lacking complete plumbing facilities: 4.3% Housing units lacking complete kitchen facilities: 3.7%
58.5%Utility gas
34.7%Bottled, tank, or LP gas
7.1%Electricity
Population in 1990: 1,587.
Place of birth for U.S.-born residents:
This state: 1,079
Northeast: 31
Midwest: 120
South: 27
West: 11
65% of the 61368 zip code residents lived in the same house 5 years ago. Out of people who lived in different houses, 68% lived in this county. Out of people who lived in different counties, 50% lived in Illinois.
97% of the 61368 zip code residents lived in the same house 1 year ago. Out of people who lived in different houses, 88% moved from this county. Out of people who lived in different houses, 4% moved from different county within same state.
Private vs. public school enrollment:
Students in private schools in grades 1 to 8 (elementary and middle school): 25
Here:
23.9%
Illinois:
13.3%
Students in private schools in grades 9 to 12 (high school): 10
Here:
14.0%
Illinois:
9.9%
Students in private undergraduate colleges: 3
Here:
9.5%
Illinois:
27.4%
Occupation by median earnings in the past 12 months ($)
84,205Construction and extraction occupations
65,688Management occupations
64,141Health diagnosing and treating practitioners and other technical occupations
55,103Material moving occupations
39,723Transportation occupations
39,012Production occupations
Top industries in this zip code by the number of employees in 2005:
Accommodation and Food Services: Mobile Food Services (10-19 employees: 1 establishment)
Other Services (except Public Administration): Religious Organizations (1-4: 4)
Accommodation and Food Services: Drinking Places (Alcoholic Beverages) (5-9: 1)
Accommodation and Food Services: Recreational and Vacation Camps (except Campgrounds) (5-9: 1)
Construction: Poured Concrete Foundation and Structure Contractors (1-4: 2)
Construction: New Single-Family Housing Construction (except Operative Builders) (1-4: 1)
Finance and Insurance: Commercial Banking (1-4: 1)
Finance and Insurance: Insurance Agencies and Brokerages (1-4: 1)
2002 - 2018 National Fire Incident Reporting System (NFIRS) incidents
According to the data from the years 2002 - 2018 the average number of fire incidents per year is 12. The highest number of reported fires - 44 took place in 2011, and the least - 2 in 2006. The data has a constant trend.
When looking into fire subcategories, the most reports belonged to: Outside Fires (37.0%), and Structure Fires (29.0%).
Fire incident types reported to NFIRS in Zip Code 61368


 Nearest zip codes: 61560, 61421, 61379, 61537, 61356, 61315.


 According to the data from the years 2002 - 2018 the average number of fire incidents per year is 12. The highest number of reported fires - 44 took place in 2011, and the least - 2 in 2006. The data has a constant trend.
 When looking into fire subcategories, the most reports belonged to: Outside Fires (37.0%), and Structure Fires (29.0%).