Estimated zip code population in 2022: 577 Zip code population in 2010: 754 Zip code population in 2000: 705
Houses and condos: 653 Renter-occupied apartments: 23
% of renters here:
7%
State:
33%
March 2022 cost of living index in zip code 61560: 83.4 (less than average, U.S. average is 100)
Land area: 33.1 sq. mi. Water area: 8.2 sq. mi.
Population density: 17 people per square mile
(very low).
OSM Map
General Map
Google Map
MSN Map
OSM Map
General Map
Google Map
MSN Map
OSM Map
General Map
Google Map
MSN Map
OSM Map
General Map
Google Map
MSN Map
Please wait while loading the map...
Real estate property taxes paid for housing units in 2022:
This zip code:
1.9% ($4,240)
Illinois:
2.0% ($4,912)
Median real estate property taxes paid for housing units with mortgages in 2022: $3,600 (1.5%) Median real estate property taxes paid for housing units with no mortgage in 2022: $4,542 (2.0%)
Business Search- 14 Million verified businesses
Males: 308
(53.4%)
Females: 269
(46.6%)
For population 25 years and over in 61560:
High school or higher: 91.5%
Bachelor's degree or higher: 51.8%
Graduate or professional degree: 22.3%
Unemployed: 4.2%
Mean travel time to work (commute): 29.7 minutes
For population 15 years and over in 61560:
Never married: 17.2%
Now married: 72.8%
Separated: 0.0%
Widowed: 1.6%
Divorced: 8.4%
Zip code 61560 compared to state average:
Black race population percentage significantly below state average.
Hispanic race population percentage significantly below state average.
Median age significantly above state average.
Foreign-born population percentage significantly below state average.
Renting percentage significantly below state average.
Length of stay since moving in significantly above state average.
Number of rooms per house above state average.
House age significantly below state average.
Number of college students below state average.
Percentage of population with a bachelor's degree or higher above state average.
Estimated median house/condo value in 2022: $227,082
61560:
$227,082
Illinois:
$251,600
Median resident age:
This zip code:
69.0 years
Illinois median age:
39.1 years
Average household size:
This zip code:
1.9 people
Illinois:
2.4 people
Averages for the 2020 tax year for zip code 61560, filed in 2021:
Average Adjusted Gross Income (AGI) in 2020: $73,712 (Individual Income Tax Returns)
Here:
$73,712
State:
$82,626
Salary/wage: $62,174 (reported on 67.6% of returns)
Here:
$62,174
State:
$66,640
(% of AGI for various income ranges: 1056.0% for AGIs below $25k, 3070.0% for AGIs $25k-50k, 4103.3% for AGIs $50k-75k, 7796.7% for AGIs $75k-100k, 21667.5% for AGIs $100k-200k)
Taxable interest for individuals: $1,075 (reported on 47.1% of returns)
This zip code:
$1,075
Illinois:
$2,376
(% of AGI for various income ranges: 30.0% for AGIs below $25k, 130.0% for AGIs $25k-50k, 60.0% for AGIs $50k-75k, 16.7% for AGIs $75k-100k, 172.5% for AGIs $100k-200k)
Ordinary dividends: $2,567 (reported on 26.5% of returns)
Here:
$2,567
State:
$9,061
(% of AGI for various income ranges: 98.0% for AGIs below $25k, 140.0% for AGIs $50k-75k, 350.0% for AGIs $100k-200k)
Net capital gain/loss in AGI: +$3,043 (reported on 20.6% of returns)
Here:
+$3,043
State:
+$31,684
(% of AGI for various income ranges: 104.0% for AGIs below $25k, 156.7% for AGIs $50k-75k, 285.0% for AGIs $100k-200k)
Profit/loss from business: +$11,000 (reported on 11.8% of returns)
Here:
+$11,000
State:
+$12,175
(% of AGI for various income ranges: 372.0% for AGIs below $25k, 846.7% for AGIs $50k-75k)
Taxable individual retirement arrangement distribution: $19,071 (reported on 20.6% of returns)
61560:
$19,071
Illinois:
$21,613
(% of AGI for various income ranges: 976.0% for AGIs $25k-50k, 2117.5% for AGIs $100k-200k)
Percentage of individuals using paid preparers for their 2020 taxes: 94.1%
Here:
94%
State:
93%
(% for various income ranges: 88.9% for AGIs below $25k, 100.0% for AGIs $25k-50k, 100.0% for AGIs $50k-75k, 80.0% for AGIs $75k-100k, 100.0% for AGIs $100k-200k)
Averages for the 2012 tax year for zip code 61560, filed in 2013:
Average Adjusted Gross Income (AGI) in 2012: $56,276 (Individual Income Tax Returns)
Here:
$56,276
State:
$68,058
Salary/wage: $38,518 (reported on 66.7% of returns)
Here:
$38,518
State:
$55,396
(% of AGI for various income ranges: 53.5% for AGIs below $25k, 55.4% for AGIs $25k-50k, 41.4% for AGIs $50k-75k, 50.5% for AGIs $75k-100k, 42.0% for AGIs $100k-200k)
Taxable interest for individuals: $1,743 (reported on 42.4% of returns)
This zip code:
$1,743
Illinois:
$1,969
(% of AGI for various income ranges: 3.5% for AGIs below $25k, 0.9% for AGIs $25k-50k, 1.1% for AGIs $50k-75k, 0.6% for AGIs $75k-100k, 1.4% for AGIs $100k-200k)
Ordinary dividends: $1,610 (reported on 30.3% of returns)
Here:
$1,610
State:
$7,786
(% of AGI for various income ranges: 2.9% for AGIs below $25k, 2.2% for AGIs $50k-75k, 0.5% for AGIs $100k-200k)
Net capital gain/loss in AGI: +$400 (reported on 27.3% of returns)
Here:
+$400
State:
+$22,183
(% of AGI for various income ranges: 0.7% for AGIs $100k-200k)
Profit/loss from business: +$7,450 (reported on 12.1% of returns)
Here:
+$7,450
State:
+$12,903
Taxable individual retirement arrangement distribution: $13,083 (reported on 18.2% of returns)
61560:
$13,083
Illinois:
$17,929
Total itemized deductions: $21,000 (21% of AGI, reported on 30.3% of returns)
Here:
$21,000
State:
$26,433
Here:
20.9% of AGI
State:
19.2% of AGI
(% of AGI for various income ranges: 23.0% for AGIs $25k-50k, 18.3% for AGIs $50k-75k, 11.3% for AGIs $100k-200k)
Charity contributions: $2,350 (reported on 24.2% of returns)
Here:
$2,350
State:
$4,525
(% of AGI for various income ranges: 2.3% for AGIs below $25k, 0.9% for AGIs $50k-75k, 1.5% for AGIs $100k-200k)
Taxes paid: $7,155 (reported on 33.3% of returns)
61560:
$7,155
State:
$11,968
(% of AGI for various income ranges: 6.8% for AGIs $25k-50k, 6.0% for AGIs $50k-75k, 5.0% for AGIs $100k-200k)
Earned income credit: $1,850 (reported on 12.1% of returns)
Here:
$1,850
State:
$2,349
(% of AGI for various income ranges: 5.4% for AGIs below $25k)
Percentage of individuals using paid preparers for their 2012 taxes: 60.6%
Here:
61%
State:
57%
(% for various income ranges: 53.8% for AGIs below $25k, 66.7% for AGIs $25k-50k, 66.7% for AGIs $50k-75k, 66.7% for AGIs $75k-100k, 60.0% for AGIs $100k-200k)
Averages for the 2004 tax year for zip code 61560, filed in 2005:
Average Adjusted Gross Income (AGI) in 2004: $39,460 (Individual Income Tax Returns)
Here:
$39,460
State:
$54,625
Salary/wage: $35,868 (reported on 68.3% of returns)
Here:
$35,868
State:
$46,811
(% of AGI for various income ranges: 154.4% for AGIs below $10k, 57.4% for AGIs $10k-25k, 58.8% for AGIs $25k-50k, 61.4% for AGIs $50k-75k, 52.7% for AGIs $75k-100k, 70.8% for AGIs over 100k)
Taxable interest for individuals: $1,646 (reported on 59.6% of returns)
This zip code:
$1,646
Illinois:
$2,101
(% of AGI for various income ranges: 23.5% for AGIs below $10k, 4.2% for AGIs $10k-25k, 2.9% for AGIs $25k-50k, 1.8% for AGIs $50k-75k, 3.4% for AGIs $75k-100k, 0.7% for AGIs over 100k)
Taxable dividends: $1,306 (reported on 30.4% of returns)
Here:
$1,306
State:
$4,306
(% of AGI for various income ranges: 4.4% for AGIs below $10k, 1.2% for AGIs $10k-25k, 2.4% for AGIs $25k-50k, 0.6% for AGIs $50k-75k, 1.0% for AGIs $75k-100k)
Net capital gain/loss: +$1,788 (reported on 20.5% of returns)
Here:
+$1,788
State:
+$17,321
(% of AGI for various income ranges: 0.9% for AGIs $10k-25k, -0.5% for AGIs $25k-50k, 0.3% for AGIs $50k-75k, 5.1% for AGIs $75k-100k)
Profit/loss from business: +$3,830 (reported on 16.5% of returns)
Here:
+$3,830
State:
+$11,771
(% of AGI for various income ranges: 71.3% for AGIs below $10k, 5.6% for AGIs $10k-25k, 0.6% for AGIs $25k-50k, 0.7% for AGIs $50k-75k)
IRA payment deduction: $2,000 (reported on 3.1% of returns)
61560:
$2,000
Illinois:
$3,087
Total itemized deductions: $15,646 (24% of AGI, reported on 29.8% of returns)
Here:
$15,646
State:
$20,239
Here:
23.9% of AGI
State:
19.5% of AGI
(% of AGI for various income ranges: 13.1% for AGIs $10k-25k, 15.4% for AGIs $25k-50k, 12.2% for AGIs $50k-75k, 11.1% for AGIs $75k-100k, 8.6% for AGIs over 100k)
Charity contributions deductions: $1,608 (2% of AGI, reported on 24.5% of returns)
Here:
$1,608
State:
$3,719
Here:
2.4% of AGI
State:
3.4% of AGI
(% of AGI for various income ranges: 1.8% for AGIs $25k-50k, 1.2% for AGIs $50k-75k, 0.8% for AGIs $75k-100k, 0.6% for AGIs over 100k)
Total tax: $5,415 (reported on 80.1% of returns)
61560:
$5,415
State:
$9,882
(% of AGI for various income ranges: 8.1% for AGIs below $10k, 4.3% for AGIs $10k-25k, 7.0% for AGIs $25k-50k, 9.9% for AGIs $50k-75k, 11.7% for AGIs $75k-100k, 18.5% for AGIs over 100k)
Earned income credit: $1,368 (reported on 11.8% of returns)
Here:
$1,368
State:
$1,788
Percentage of individuals using paid preparers for their 2004 taxes: 63.0%
Here:
63%
State:
61%
(% for various income ranges: 60.0% for AGIs below $10k, 66.7% for AGIs $10k-25k, 53.5% for AGIs $25k-50k, 65.1% for AGIs $50k-75k, 76.0% for AGIs $75k-100k, 73.7% for AGIs over 100k)
Household received Food Stamps/SNAP in the past 12 months: 8 Household did not receive Food Stamps/SNAP in the past 12 months: 297
Women who did not have a birth in the past 12 months: 27 (0 now married, 27 unmarried)
Housing units in zip code 61560 with a mortgage: 122 (16 second mortgage, 16 both second mortgage and home equity loan) Median monthly owner costs for units with a mortgage: $1,281 Median monthly owner costs for units without a mortgage: $716
Residents with income below the poverty level in 2022:
This zip code:
16.1%
Whole state:
11.9%
Median number of rooms in houses and condos:
Here:
6.3
State:
6.4
Notable locations in this zip code not listed on our city pages
Notable locations in zip code 61560: Henry Fire Protection District Station 3 (A), Tiskilwa Fire Protection District Station 2 (B). Display/hide their locations on the map
Size of family households: 192 2-persons, 33 3-persons
Size of nonfamily households: 86 1-person
6 married couples with children.
17 single-parent households (17 men).
97.5% of residents of 61560 zip code speak English at home.
3.7% of residents speak other Indo-European language at home (100% very well).
0.7% of residents speak Asian or Pacific Island language at home (100% very well).
Foreign born population: 28 (4.9%) (100.0% of them are naturalized citizens)
This zip code:
4.9%
Whole state:
14.4%
39%France
29%Taiwan
11%Malaysia
7%Germany
40%American
30%German
9%Polish
5%Dutch
3%European
3%Swedish
1%Scottish
Year of entry for the foreign-born population
02010 or later
32000 to 2009
01990 to 1999
23Before 1990
Facilities with environmental interests located in this zip code:
RUMBOLD & KUHN INC (IL ROUTE 29 in PUTNAM, IL)
STATE MASTER (Illinois EPA Project) - AIR PROGRAM, HAZARDOUS WASTE PROGRAM, SCRAP TIRE MANAGEMENT AIR MINOR (AIRS/AFS) CRITERIA AND HAZARDOUS AIR POLLUTANT INVENTORY (Inventory of air pollution sources) Business SIC classification: GRAIN AND FIELD BEANS
PUTNAM GRAIN CO (RTE 29 in PUTNAM, IL)
Small Quantity Generators, between 100 kg and 1000 kg of hazardous waste/month (Resource Conservation and Recovery Act (tracking hazardous waste)) - notification
Housing units lacking complete plumbing facilities: 3.0% Housing units lacking complete kitchen facilities: 3.0%
52.0%Bottled, tank, or LP gas
26.3%Electricity
20.1%Utility gas
2.0%Wood
Population in 1990: 724.
Place of birth for U.S.-born residents:
This state: 470
Northeast: 25
Midwest: 53
58% of the 61560 zip code residents lived in the same house 5 years ago. Out of people who lived in different houses, 19% lived in this county. Out of people who lived in different counties, 50% lived in Illinois.
74% of the 61560 zip code residents lived in the same house 1 year ago. Out of people who lived in different houses, 107% moved from different county within same state.
Students in private schools in grades 9 to 12 (high school):
Here:
0.0%
Illinois:
9.9%
Occupation by median earnings in the past 12 months ($)
26,706Construction and extraction occupations
23,484Health diagnosing and treating practitioners and other technical occupations
Top industries in this zip code by the number of employees in 2005:
Other Services (except Public Administration): Other Similar Organizations (except Business, Professional, Labor, and Political Organizations) (5-9: 1)
Professional, Scientific, and Technical Services: Administrative Management and General Management Consulting Services (5-9: 1)
Arts, Entertainment, and Recreation: Fitness and Recreational Sports Centers (1-4: 1)
Construction: Framing Contractors (1-4: 1)
Accommodation and Food Services: Full-Service Restaurants (1-4: 1)
Wholesale Trade: Grain and Field Bean Merchant Wholesalers (1-4: 1)
Accommodation and Food Services: RV (Recreational Vehicle) Parks and Campgrounds (1-4: 1)
Professional, Scientific, and Technical Services: Other Scientific and Technical Consulting Services (1-4: 1)
Fatal accident statistics in 2011:
Fatal accident count: 1
Vehicles involved in fatal accidents: 1
Fatal accidents caused by drunken drivers: 0
Fatalities: 1
Persons involved in fatal accidents: 1
Pedestrians involved in fatal accidents: 0
Most common first names in zip code 61560 among deceased individuals
Name
Count
Lived (average)
William
6
76.3 years
Clarence
5
78.0 years
Charles
5
63.6 years
Donald
4
71.3 years
Raymond
4
68.3 years
Robert
4
73.2 years
Dorothy
3
73.0 years
George
3
81.3 years
Edward
3
72.0 years
Mary
3
70.7 years
Most common last names in zip code 61560 among deceased individuals
Last name
Count
Lived (average)
Wright
7
77.2 years
Eckard
4
76.5 years
Fox
3
77.0 years
Lefman
3
78.3 years
Maas
3
75.7 years
Wheeler
3
88.0 years
Dylo
2
70.0 years
Eckhoff
2
74.0 years
Anderson
2
86.5 years
Atkins
2
78.0 years
Discuss , Illinois (IL) on our hugely popular Illinois forum.

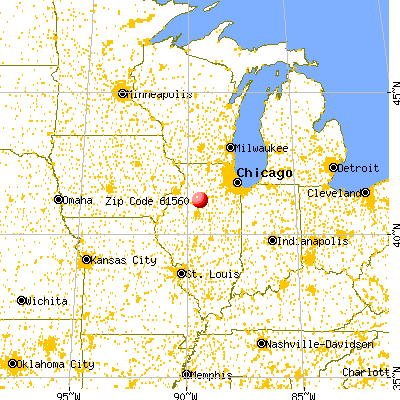


 Nearest zip codes: 61537, 61315, 61327, 61368, 61322, 61565.


