Estimated zip code population in 2022: 1,283 Zip code population in 2010: 1,410 Zip code population in 2000: 1,431
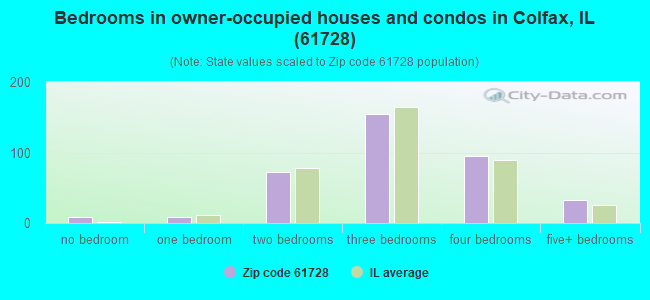
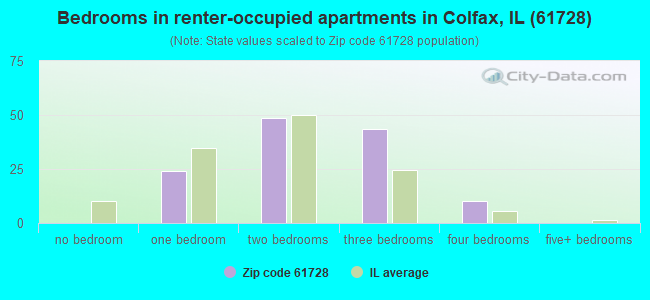
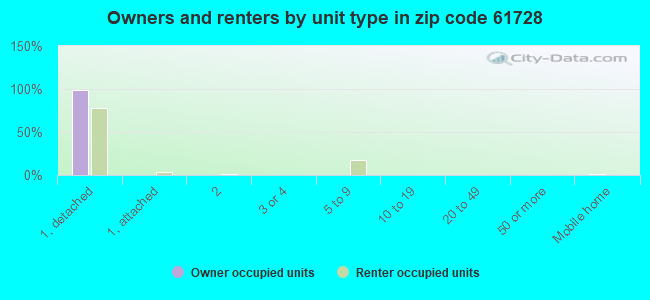
Houses and condos: 530 Renter-occupied apartments: 129
% of renters here:
26%
State:
33%
March 2022 cost of living index in zip code 61728: 84.5 (less than average, U.S. average is 100)
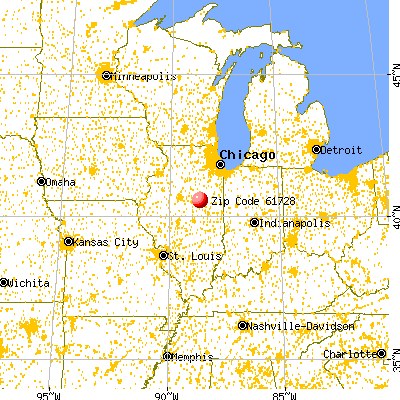
Land area: 65.6 sq. mi. Water area: 0.0 sq. mi.
Population density: 20 people per square mile
(very low).
OSM Map
General Map
Google Map
MSN Map
OSM Map
General Map
Google Map
MSN Map
OSM Map
General Map
Google Map
MSN Map
OSM Map
General Map
Google Map
MSN Map
Please wait while loading the map...
Real estate property taxes paid for housing units in 2022:
This zip code:
2.0% ($2,944)
Illinois:
2.0% ($4,912)
Median real estate property taxes paid for housing units with mortgages in 2022: $2,811 (2.0%) Median real estate property taxes paid for housing units with no mortgage in 2022: $3,480 (2.0%)
Business Search- 14 Million verified businesses
Males: 571
(44.5%)
Females: 711
(55.5%)
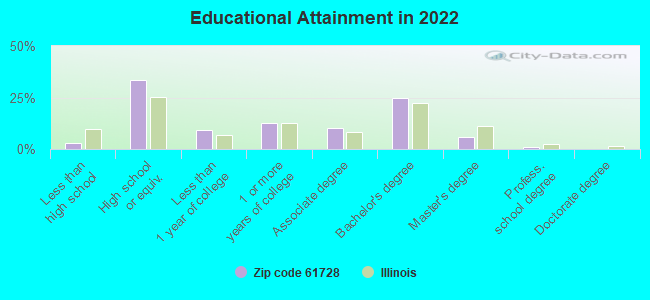
For population 25 years and over in 61728:
High school or higher: 96.7%
Bachelor's degree or higher: 31.4%
Graduate or professional degree: 6.7%
Unemployed: 4.0%
Mean travel time to work (commute): 25.1 minutes
For population 15 years and over in 61728:
Never married: 28.6%
Now married: 50.4%
Separated: 0.0%
Widowed: 5.7%
Divorced: 15.2%
Zip code 61728 compared to state average:
Median house value below state average.
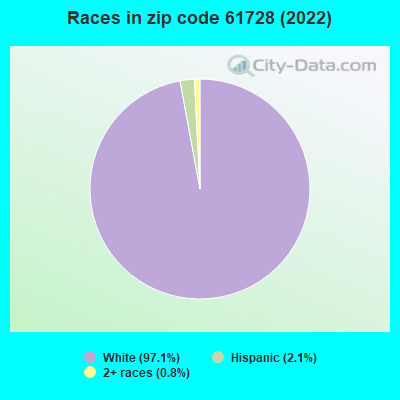
Black race population percentage significantly below state average.
Hispanic race population percentage significantly below state average.
Foreign-born population percentage significantly below state average.
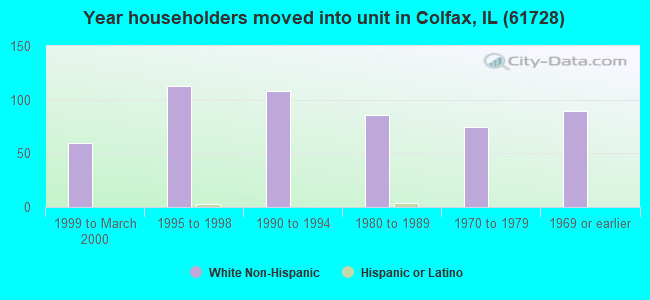
Length of stay since moving in significantly above state average.
Averages for the 2020 tax year for zip code 61728, filed in 2021:
Average Adjusted Gross Income (AGI) in 2020: $66,087 (Individual Income Tax Returns)
Here:
$66,087
State:
$82,626
Salary/wage: $53,088 (reported on 85.3% of returns)
Here:
$53,088
State:
$66,640
(% of AGI for various income ranges: 1351.4% for AGIs below $25k, 3439.2% for AGIs $25k-50k, 6686.2% for AGIs $50k-75k, 8395.0% for AGIs $75k-100k, 15974.3% for AGIs $100k-200k)
Taxable interest for individuals: $750 (reported on 41.2% of returns)
This zip code:
$750
Illinois:
$2,376
(% of AGI for various income ranges: 8.6% for AGIs below $25k, 21.5% for AGIs $25k-50k, 18.8% for AGIs $50k-75k, 65.0% for AGIs $75k-100k, 140.0% for AGIs $100k-200k)
Ordinary dividends: $3,467 (reported on 13.2% of returns)
Here:
$3,467
State:
$9,061
(% of AGI for various income ranges: 19.3% for AGIs below $25k, 115.0% for AGIs $50k-75k, 275.7% for AGIs $100k-200k)
Net capital gain/loss in AGI: +$13,538 (reported on 11.8% of returns)
Here:
+$13,538
State:
+$31,684
(% of AGI for various income ranges: 69.2% for AGIs $25k-50k, 1418.6% for AGIs $100k-200k)
Profit/loss from business: +$3,800 (reported on 13.2% of returns)
Here:
+$3,800
State:
+$12,175
(% of AGI for various income ranges: 137.1% for AGIs below $25k, 100.0% for AGIs $50k-75k, 100.0% for AGIs $100k-200k)
Taxable individual retirement arrangement distribution: $9,680 (reported on 7.4% of returns)
61728:
$9,680
Illinois:
$21,613
(% of AGI for various income ranges: 806.7% for AGIs $75k-100k)
Total itemized deductions: $28,767 (reported on 4.4% of returns)
Here:
$28,767
State:
$34,948
(% of AGI for various income ranges: 1078.8% for AGIs $50k-75k)
Taxes paid: $5,167 (reported on 4.4% of returns)
61728:
$5,167
State:
$8,563
(% of AGI for various income ranges: 193.8% for AGIs $50k-75k)
Earned income credit: $2,467 (reported on 13.2% of returns)
Here:
$2,467
State:
$2,311
(% of AGI for various income ranges: 112.1% for AGIs below $25k, 50.0% for AGIs $25k-50k)
Percentage of individuals using paid preparers for their 2020 taxes: 94.1%
Here:
94%
State:
93%
(% for various income ranges: 90.0% for AGIs below $25k, 100.0% for AGIs $25k-50k, 90.9% for AGIs $50k-75k, 100.0% for AGIs $75k-100k, 91.7% for AGIs $100k-200k, 100.0% for AGIs over 200k)
Averages for the 2012 tax year for zip code 61728, filed in 2013:
Average Adjusted Gross Income (AGI) in 2012: $58,204 (Individual Income Tax Returns)
Here:
$58,204
State:
$68,058
Salary/wage: $46,726 (reported on 83.8% of returns)
Here:
$46,726
State:
$55,396
(% of AGI for various income ranges: 78.6% for AGIs below $25k, 82.1% for AGIs $25k-50k, 82.5% for AGIs $50k-75k, 76.9% for AGIs $75k-100k, 52.4% for AGIs $100k-200k)
Taxable interest for individuals: $627 (reported on 38.2% of returns)
This zip code:
$627
Illinois:
$1,969
(% of AGI for various income ranges: 0.5% for AGIs below $25k, 0.2% for AGIs $25k-50k, 0.3% for AGIs $50k-75k, 0.2% for AGIs $75k-100k, 0.6% for AGIs $100k-200k)
Ordinary dividends: $1,855 (reported on 16.2% of returns)
Here:
$1,855
State:
$7,786
(% of AGI for various income ranges: 0.9% for AGIs $25k-50k, 0.1% for AGIs $50k-75k, 0.7% for AGIs $100k-200k)
Net capital gain/loss in AGI: +$3,460 (reported on 7.4% of returns)
Here:
+$3,460
State:
+$22,183
Profit/loss from business: +$8,527 (reported on 16.2% of returns)
Here:
+$8,527
State:
+$12,903
(% of AGI for various income ranges: 6.9% for AGIs below $25k, 6.5% for AGIs $25k-50k, 2.4% for AGIs $50k-75k, 1.1% for AGIs $100k-200k)
Taxable individual retirement arrangement distribution: $7,143 (reported on 10.3% of returns)
61728:
$7,143
Illinois:
$17,929
(% of AGI for various income ranges: 3.0% for AGIs below $25k, 2.8% for AGIs $25k-50k, 3.5% for AGIs $75k-100k)
Total itemized deductions: $18,905 (19% of AGI, reported on 29.4% of returns)
Here:
$18,905
State:
$26,433
Here:
19.0% of AGI
State:
19.2% of AGI
(% of AGI for various income ranges: 9.2% for AGIs $25k-50k, 7.4% for AGIs $50k-75k, 12.1% for AGIs $75k-100k, 10.7% for AGIs $100k-200k)
Charity contributions: $3,767 (reported on 22.1% of returns)
Here:
$3,767
State:
$4,525
(% of AGI for various income ranges: 1.0% for AGIs $25k-50k, 1.6% for AGIs $75k-100k, 2.1% for AGIs $100k-200k)
Taxes paid: $7,820 (reported on 29.4% of returns)
61728:
$7,820
State:
$11,968
(% of AGI for various income ranges: 3.2% for AGIs $25k-50k, 2.2% for AGIs $50k-75k, 4.5% for AGIs $75k-100k, 5.1% for AGIs $100k-200k)
Earned income credit: $2,260 (reported on 14.7% of returns)
Here:
$2,260
State:
$2,349
(% of AGI for various income ranges: 6.2% for AGIs below $25k, 1.0% for AGIs $25k-50k)
Percentage of individuals using paid preparers for their 2012 taxes: 54.4%
Here:
54%
State:
57%
(% for various income ranges: 45.5% for AGIs below $25k, 52.9% for AGIs $25k-50k, 55.6% for AGIs $50k-75k, 62.5% for AGIs $75k-100k, 66.7% for AGIs $100k-200k)
Averages for the 2004 tax year for zip code 61728, filed in 2005:
Average Adjusted Gross Income (AGI) in 2004: $41,722 (Individual Income Tax Returns)
Here:
$41,722
State:
$54,625
Salary/wage: $35,796 (reported on 85.5% of returns)
Here:
$35,796
State:
$46,811
(% of AGI for various income ranges: 130.7% for AGIs below $10k, 70.8% for AGIs $10k-25k, 78.7% for AGIs $25k-50k, 77.2% for AGIs $50k-75k, 78.1% for AGIs $75k-100k, 55.0% for AGIs over 100k)
Taxable interest for individuals: $1,027 (reported on 53.7% of returns)
This zip code:
$1,027
Illinois:
$2,101
(% of AGI for various income ranges: 4.9% for AGIs below $10k, 2.6% for AGIs $10k-25k, 1.3% for AGIs $25k-50k, 1.0% for AGIs $50k-75k, 0.7% for AGIs $75k-100k, 1.5% for AGIs over 100k)
Taxable dividends: $1,076 (reported on 20.7% of returns)
Here:
$1,076
State:
$4,306
(% of AGI for various income ranges: 0.9% for AGIs below $10k, 0.1% for AGIs $10k-25k, 0.5% for AGIs $25k-50k, 0.2% for AGIs $50k-75k, 0.1% for AGIs $75k-100k, 1.5% for AGIs over 100k)
Net capital gain/loss: +$5,000 (reported on 10.8% of returns)
Here:
+$5,000
State:
+$17,321
(% of AGI for various income ranges: -0.6% for AGIs below $10k, -0.0% for AGIs $25k-50k, -0.1% for AGIs $50k-75k, 0.1% for AGIs $75k-100k, 6.0% for AGIs over 100k)
Profit/loss from business: +$7,048 (reported on 18.0% of returns)
Here:
+$7,048
State:
+$11,771
(% of AGI for various income ranges: 9.3% for AGIs below $10k, 7.1% for AGIs $10k-25k, 4.1% for AGIs $25k-50k, 5.3% for AGIs $50k-75k, -0.8% for AGIs $75k-100k, 0.9% for AGIs over 100k)
Profit/loss from farming: +$16,795 (reported on 10.5% of returns)
Here:
+$16,795
State:
+$2,327
(% of AGI for various income ranges: 0.9% for AGIs $25k-50k, 3.7% for AGIs $50k-75k, 6.1% for AGIs $75k-100k, 8.1% for AGIs over 100k)
Total itemized deductions: $14,152 (21% of AGI, reported on 28.3% of returns)
Here:
$14,152
State:
$20,239
Here:
20.5% of AGI
State:
19.5% of AGI
(% of AGI for various income ranges: 21.7% for AGIs $10k-25k, 7.8% for AGIs $25k-50k, 8.0% for AGIs $50k-75k, 9.5% for AGIs $75k-100k, 10.3% for AGIs over 100k)
Charity contributions deductions: $2,185 (3% of AGI, reported on 21.7% of returns)
Here:
$2,185
State:
$3,719
Here:
2.8% of AGI
State:
3.4% of AGI
(% of AGI for various income ranges: 1.2% for AGIs $10k-25k, 0.6% for AGIs $25k-50k, 0.9% for AGIs $50k-75k, 1.5% for AGIs $75k-100k, 1.7% for AGIs over 100k)
Total tax: $5,672 (reported on 76.7% of returns)
61728:
$5,672
State:
$9,882
(% of AGI for various income ranges: 5.1% for AGIs below $10k, 4.5% for AGIs $10k-25k, 7.2% for AGIs $25k-50k, 9.2% for AGIs $50k-75k, 11.7% for AGIs $75k-100k, 16.2% for AGIs over 100k)
Earned income credit: $1,451 (reported on 11.8% of returns)
Here:
$1,451
State:
$1,788
Percentage of individuals using paid preparers for their 2004 taxes: 60.1%
Here:
60%
State:
61%
(% for various income ranges: 49.4% for AGIs below $10k, 61.2% for AGIs $10k-25k, 59.3% for AGIs $25k-50k, 67.5% for AGIs $50k-75k, 67.1% for AGIs $75k-100k, 66.7% for AGIs over 100k)
Likely homosexual households (counted as self-reported same-sex unmarried-partner households)
Lesbian couples: 2.0% of all households
Gay men: 1.0% of all households
Household received Food Stamps/SNAP in the past 12 months: 101 Household did not receive Food Stamps/SNAP in the past 12 months: 399
Women who had a birth in the past 12 months: 11 (11 now married, 0 unmarried) Women who did not have a birth in the past 12 months: 272 (96 now married, 176 unmarried)
Housing units in zip code 61728 with a mortgage: 245 (7 second mortgage, 4 both second mortgage and home equity loan) Median monthly owner costs for units with a mortgage: $1,284 Median monthly owner costs for units without a mortgage: $590
Residents with income below the poverty level in 2022:
This zip code:
10.2%
Whole state:
11.9%
Residents with income below 50% of the poverty level in 2022:
This zip code:
3.6%
Whole state:
5.7%
Median number of rooms in houses and condos:
Here:
6.8
State:
6.4
Median number of rooms in apartments:
Here:
5.3
State:
4.1
Notable locations in this zip code not listed on our city pages
Cemeteries: Antioch Cemetery (1), Wiley Cemetery (2), Plymouth Cemetery (3), Immanuel Lutheran Church Cemetery (4), Evergreen Cemetery (5). Display/hide their locations on the map
In group quarters: 31 (-1 institutionalized population)
Size of family households: 154 2-persons, 52 3-persons, 57 4-persons, 57 5-persons, 7 7-or-more-persons
Size of nonfamily households: 126 1-person, 34 2-persons, 5 4-persons
148 married couples with children.
141 single-parent households (63 men, 78 women).
98.9% of residents of 61728 zip code speak English at home.
0.2% of residents speak Spanish at home (100% very well).
0.3% of residents speak other Indo-European language at home (100% very well).
0.2% of residents speak Asian or Pacific Island language at home (100% very well).
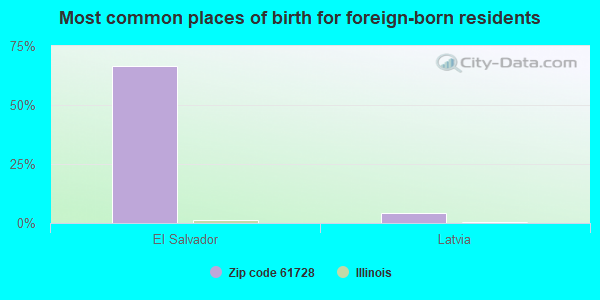
Foreign born population: 24 (1.9%) (75.2% of them are naturalized citizens)
This zip code:
1.9%
Whole state:
14.4%
67%El Salvador
4%Latvia
20%German
16%English
15%Irish
15%American
8%Dutch
7%Italian
3%European
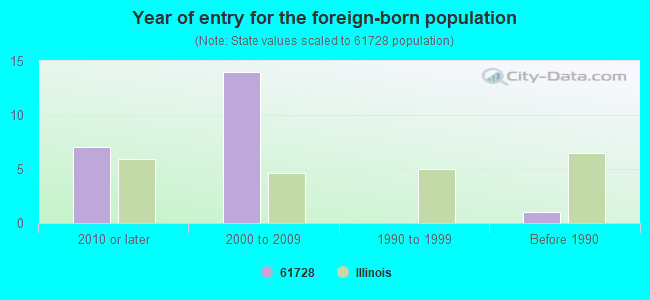
Year of entry for the foreign-born population
72010 or later
142000 to 2009
01990 to 1999
1Before 1990
Facilities with environmental interests located in this zip code:
ALLIANCE GRAIN CO (115 S CENTER ST in COLFAX, IL)
STATE MASTER (Illinois EPA Project) - AIR PROGRAM AIR MINOR (AIRS/AFS) CRITERIA AND HAZARDOUS AIR POLLUTANT INVENTORY (Inventory of air pollution sources) Business SIC classification: GRAIN AND FIELD BEANS
MEYER BULK SERVICE (110 S GROVE in COLFAX, IL)
STATE MASTER (Illinois EPA Project) - AIR PROGRAM AIR MINOR (AIRS/AFS) CRITERIA AND HAZARDOUS AIR POLLUTANT INVENTORY (Inventory of air pollution sources) Business SIC classification: PETROLEUM BULK STATIONS AND TERMINALS
CROP-FAX INC (500 E MAIN in COLFAX, IL)
STATE MASTER (Illinois EPA Project) - AIR PROGRAM AIR MINOR (AIRS/AFS) Business SIC classification: NONCLASSIFIABLE ESTABLISHMENTS
COLFAX MFG INC (131 E MAIN ST in COLFAX, IL)
STATE MASTER (Illinois EPA Project) - SOLID WASTE PROGRAM, HAZARDOUS WASTE PROGRAM Small Quantity Generators, between 100 kg and 1000 kg of hazardous waste/month (Resource Conservation and Recovery Act (tracking hazardous waste)) - notification Organizations: WARSAW AARON (CONTACT/OWNER)
COLFAX STP (COUNTY HIGHWAY 13 EAST in COLFAX, IL)
STATE MASTER (Illinois EPA Project) - National Pollutant Discharge Elimination System Permit National Pollutant Discharge Elimination System NON-MAJOR (Tracking pollutant discharge elimination systems) - permit Business SIC classification: SEWERAGE SYSTEMS Alternative names: COLFAX STP, VILLAGE OF
RIDGEVIEW CUSD 19 (202 E WOOD in COLFAX, IL)
STATE MASTER (Illinois EPA Project) - SOLID WASTE PROGRAM Small Quantity Generators, between 100 kg and 1000 kg of hazardous waste/month (Resource Conservation and Recovery Act (tracking hazardous waste)) - notification Organizations: RIDGEVIEW CUSD #19 (CONTACT/OWNER)
Alternative names: RIDGEVIEW CUSD #19
RIDGEVIEW HIGH SCHOOL (RR 2 BOX 49B in COLFAX, IL)
(Geographic Names Information System) (National Center for Education Statistics) - STATE ID-1706401900001 Organizations: RIDGEVIEW COMM UNIT SCH DIST 19 (SCHOOL DISTRICT)
RIDGEVIEW COMM JR HIGH SCHOOL (RR 2 BOX 49B in COLFAX, IL)
(National Center for Education Statistics) - STATE ID-1706401901001 Organizations: RIDGEVIEW COMM UNIT SCH DIST 19 (SCHOOL DISTRICT)
COLFAX ELEMENTARY SCHOOL (RR 2 BOX 49C in COLFAX, IL)
(National Center for Education Statistics) - STATE ID-1706401902002 Organizations: RIDGEVIEW COMM UNIT SCH DIST 19 (SCHOOL DISTRICT)
Housing units lacking complete plumbing facilities: 2.2%
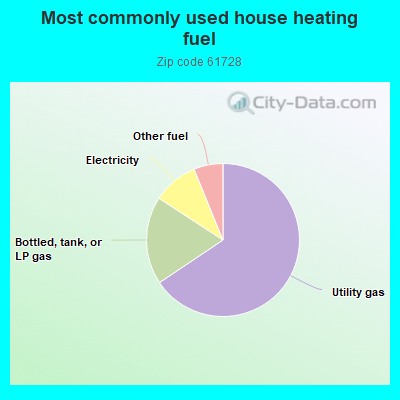
66.0%Utility gas
18.7%Bottled, tank, or LP gas
9.7%Electricity
6.2%Other fuel
Population in 1990: 1,391. Population change in the 1990s: +40 (+2.9%).
Place of birth for U.S.-born residents:
This state: 1,073
Northeast: 11
Midwest: 113
South: 17
West: 40
68% of the 61728 zip code residents lived in the same house 5 years ago. Out of people who lived in different houses, 83% lived in this county. Out of people who lived in different counties, 50% lived in Illinois.
95% of the 61728 zip code residents lived in the same house 1 year ago. Out of people who lived in different houses, 52% moved from this county. Out of people who lived in different houses, 45% moved from different county within same state.
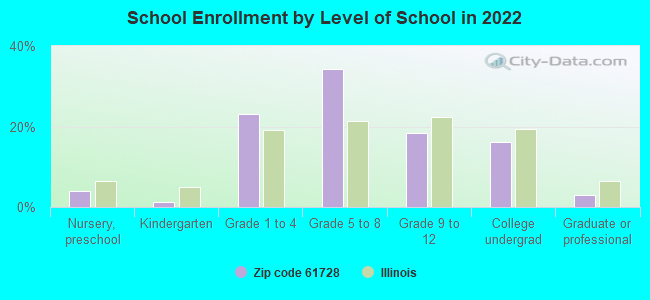
Private vs. public school enrollment:
Students in private schools in grades 1 to 8 (elementary and middle school):
Here:
0.0%
Illinois:
13.3%
Students in private schools in grades 9 to 12 (high school):
Here:
0.0%
Illinois:
9.9%
Students in private undergraduate colleges:
Here:
0.0%
Illinois:
27.4%
Occupation by median earnings in the past 12 months ($)
81,029Business and financial operations occupations
71,656Management occupations
59,582Building and grounds cleaning and maintenance occupations
55,735Construction and extraction occupations
50,485Healthcare support occupations
47,587Installation, maintenance, and repair occupations
Top industries in this zip code by the number of employees in 2005:
Health Care and Social Assistance: Nursing Care Facilities (50-99 employees: 1 establishment)
Accommodation and Food Services: Full-Service Restaurants (10-19: 1, 1-4: 1)
Wholesale Trade: Industrial Machinery and Equipment Merchant Wholesalers (10-19: 1)
Finance and Insurance: Insurance Agencies and Brokerages (5-9: 1, 1-4: 1)
Other Services (except Public Administration): Religious Organizations (1-4: 4)
Finance and Insurance: Commercial Banking (5-9: 1)
Construction: Masonry Contractors (5-9: 1)
Other Services (except Public Administration): Funeral Homes and Funeral Services (1-4: 2)
People in group quarters in 2010:
37 people in nursing facilities/skilled-nursing facilities
People in group quarters in 2000:
44 people in nursing homes
Fatal accident statistics in 2014:
Fatal accident count: 1
Vehicles involved in fatal accidents: 1
Fatal accidents caused by drunken drivers: 1
Fatalities: 1
Persons involved in fatal accidents: 1
Pedestrians involved in fatal accidents: 0
Fatal accident statistics in 2013:
Fatal accident count: 1
Vehicles involved in fatal accidents: 2
Fatal accidents caused by drunken drivers: 0
Fatalities: 1
Persons involved in fatal accidents: 2
Pedestrians involved in fatal accidents: 0
Home Mortgage Disclosure Act Aggregated Statistics For Year 2009 (Based on 4 partial tracts)
A) FHA, FSA/RHS & VA Home Purchase Loans
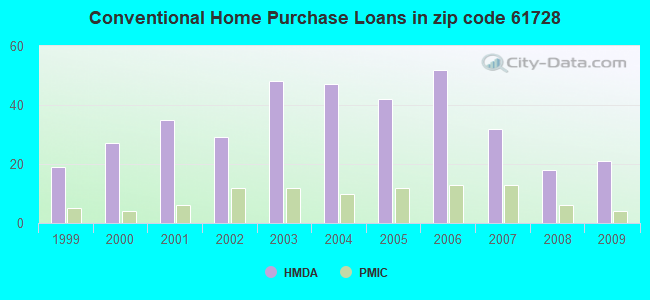
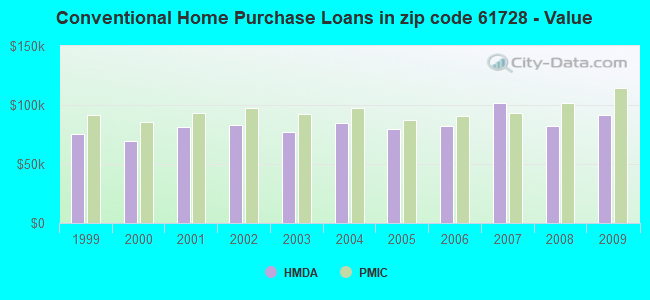
B) Conventional Home Purchase Loans
C) Refinancings
D) Home Improvement Loans
F) Non-occupant Loans on < 5 Family Dwellings (A B C & D)
G) Loans On Manufactured Home Dwelling (A B C & D)
Number
Average Value
Number
Average Value
Number
Average Value
Number
Average Value
Number
Average Value
Number
Average Value
LOANS ORIGINATED
15
$109,682
21
$91,930
85
$104,934
10
$52,664
8
$59,909
0
$0
APPLICATIONS APPROVED, NOT ACCEPTED
0
$0
2
$92,055
4
$102,930
0
$0
1
$71,980
0
$0
APPLICATIONS DENIED
4
$75,905
6
$65,773
22
$96,525
6
$52,878
1
$11,060
3
$63,517
APPLICATIONS WITHDRAWN
3
$93,663
1
$121,720
13
$117,565
0
$0
0
$0
0
$0
FILES CLOSED FOR INCOMPLETENESS
0
$0
0
$0
2
$81,565
0
$0
1
$15,980
0
$0
Aggregated Statistics For Year 2008 (Based on 4 partial tracts)
A) FHA, FSA/RHS & VA Home Purchase Loans
B) Conventional Home Purchase Loans
C) Refinancings
D) Home Improvement Loans
F) Non-occupant Loans on < 5 Family Dwellings (A B C & D)
G) Loans On Manufactured Home Dwelling (A B C & D)
Number
Average Value
Number
Average Value
Number
Average Value
Number
Average Value
Number
Average Value
Number
Average Value
LOANS ORIGINATED
11
$91,058
18
$82,017
51
$103,027
8
$25,858
8
$59,279
2
$27,755
APPLICATIONS APPROVED, NOT ACCEPTED
0
$0
1
$71,170
7
$103,507
2
$67,005
0
$0
0
$0
APPLICATIONS DENIED
3
$65,637
5
$72,120
27
$89,726
6
$38,565
0
$0
1
$55,290
APPLICATIONS WITHDRAWN
1
$65,910
2
$186,430
14
$106,656
0
$0
0
$0
1
$7,990
FILES CLOSED FOR INCOMPLETENESS
0
$0
1
$56,620
1
$100,040
0
$0
0
$0
0
$0
Aggregated Statistics For Year 2007 (Based on 4 partial tracts)
A) FHA, FSA/RHS & VA Home Purchase Loans
B) Conventional Home Purchase Loans
C) Refinancings
D) Home Improvement Loans
F) Non-occupant Loans on < 5 Family Dwellings (A B C & D)
G) Loans On Manufactured Home Dwelling (A B C & D)
Number
Average Value
Number
Average Value
Number
Average Value
Number
Average Value
Number
Average Value
Number
Average Value
LOANS ORIGINATED
11
$96,857
32
$102,112
40
$89,798
15
$37,909
8
$77,222
1
$57,420
APPLICATIONS APPROVED, NOT ACCEPTED
0
$0
5
$80,822
6
$99,438
5
$18,012
0
$0
0
$0
APPLICATIONS DENIED
1
$108,380
8
$59,738
41
$95,994
10
$55,440
2
$45,255
2
$39,575
APPLICATIONS WITHDRAWN
0
$0
2
$72,185
15
$101,628
0
$0
0
$0
0
$0
FILES CLOSED FOR INCOMPLETENESS
0
$0
1
$33,190
4
$116,045
0
$0
0
$0
0
$0
Aggregated Statistics For Year 2006 (Based on 4 partial tracts)
A) FHA, FSA/RHS & VA Home Purchase Loans
B) Conventional Home Purchase Loans
C) Refinancings
D) Home Improvement Loans
F) Non-occupant Loans on < 5 Family Dwellings (A B C & D)
G) Loans On Manufactured Home Dwelling (A B C & D)
Number
Average Value
Number
Average Value
Number
Average Value
Number
Average Value
Number
Average Value
Number
Average Value
LOANS ORIGINATED
12
$94,356
52
$82,113
49
$82,196
15
$40,380
10
$51,288
0
$0
APPLICATIONS APPROVED, NOT ACCEPTED
1
$105,120
3
$83,537
7
$97,834
3
$31,610
0
$0
0
$0
APPLICATIONS DENIED
1
$68,630
6
$66,082
41
$84,284
13
$46,331
0
$0
1
$48,510
APPLICATIONS WITHDRAWN
2
$91,490
5
$101,536
26
$97,452
3
$69,200
0
$0
1
$28,270
FILES CLOSED FOR INCOMPLETENESS
0
$0
0
$0
7
$86,147
0
$0
0
$0
0
$0
Aggregated Statistics For Year 2005 (Based on 4 partial tracts)
A) FHA, FSA/RHS & VA Home Purchase Loans
B) Conventional Home Purchase Loans
C) Refinancings
D) Home Improvement Loans
F) Non-occupant Loans on < 5 Family Dwellings (A B C & D)
G) Loans On Manufactured Home Dwelling (A B C & D)
Number
Average Value
Number
Average Value
Number
Average Value
Number
Average Value
Number
Average Value
Number
Average Value
LOANS ORIGINATED
8
$98,276
42
$79,403
54
$88,112
17
$40,498
8
$52,106
2
$38,820
APPLICATIONS APPROVED, NOT ACCEPTED
1
$65,920
7
$65,600
7
$93,340
2
$15,365
1
$9,830
1
$59,540
APPLICATIONS DENIED
2
$79,465
7
$76,927
56
$90,722
7
$41,129
0
$0
5
$59,740
APPLICATIONS WITHDRAWN
0
$0
4
$119,705
28
$95,288
2
$115,305
1
$158,520
0
$0
FILES CLOSED FOR INCOMPLETENESS
0
$0
0
$0
2
$73,600
0
$0
0
$0
0
$0
Aggregated Statistics For Year 2004 (Based on 4 partial tracts)
A) FHA, FSA/RHS & VA Home Purchase Loans
B) Conventional Home Purchase Loans
C) Refinancings
D) Home Improvement Loans
F) Non-occupant Loans on < 5 Family Dwellings (A B C & D)
G) Loans On Manufactured Home Dwelling (A B C & D)
Number
Average Value
Number
Average Value
Number
Average Value
Number
Average Value
Number
Average Value
Number
Average Value
LOANS ORIGINATED
10
$95,035
47
$84,520
75
$84,219
13
$39,718
10
$61,893
4
$49,540
APPLICATIONS APPROVED, NOT ACCEPTED
0
$0
4
$89,978
11
$75,546
5
$33,578
0
$0
2
$54,545
APPLICATIONS DENIED
0
$0
12
$74,000
44
$77,847
8
$25,570
1
$73,750
4
$52,838
APPLICATIONS WITHDRAWN
1
$42,460
4
$95,938
39
$90,753
3
$48,123
2
$63,485
1
$27,660
FILES CLOSED FOR INCOMPLETENESS
0
$0
0
$0
3
$113,877
0
$0
0
$0
0
$0
Aggregated Statistics For Year 2003 (Based on 4 partial tracts)
A) FHA, FSA/RHS & VA Home Purchase Loans
B) Conventional Home Purchase Loans
C) Refinancings
D) Home Improvement Loans
F) Non-occupant Loans on < 5 Family Dwellings (A B C & D)
Number
Average Value
Number
Average Value
Number
Average Value
Number
Average Value
Number
Average Value
LOANS ORIGINATED
15
$90,909
48
$76,860
179
$88,626
10
$20,106
14
$64,678
APPLICATIONS APPROVED, NOT ACCEPTED
1
$64,300
2
$44,720
15
$83,390
1
$9,300
0
$0
APPLICATIONS DENIED
0
$0
4
$61,970
46
$84,138
8
$29,548
2
$39,760
APPLICATIONS WITHDRAWN
0
$0
1
$117,850
33
$79,776
2
$61,720
0
$0
FILES CLOSED FOR INCOMPLETENESS
0
$0
0
$0
2
$105,345
0
$0
0
$0
Aggregated Statistics For Year 2002 (Based on 2 partial tracts)
A) FHA, FSA/RHS & VA Home Purchase Loans
B) Conventional Home Purchase Loans
C) Refinancings
D) Home Improvement Loans
F) Non-occupant Loans on < 5 Family Dwellings (A B C & D)
Number
Average Value
Number
Average Value
Number
Average Value
Number
Average Value
Number
Average Value
LOANS ORIGINATED
7
$99,829
29
$83,307
100
$93,829
10
$16,257
11
$55,917
APPLICATIONS APPROVED, NOT ACCEPTED
0
$0
2
$46,305
7
$83,364
2
$27,700
0
$0
APPLICATIONS DENIED
2
$92,205
4
$61,368
23
$80,687
6
$10,515
0
$0
APPLICATIONS WITHDRAWN
0
$0
1
$67,940
10
$85,126
1
$30,330
0
$0
FILES CLOSED FOR INCOMPLETENESS
0
$0
1
$94,630
1
$120,510
0
$0
0
$0
Aggregated Statistics For Year 2001 (Based on 2 partial tracts)
A) FHA, FSA/RHS & VA Home Purchase Loans
B) Conventional Home Purchase Loans
C) Refinancings
D) Home Improvement Loans
F) Non-occupant Loans on < 5 Family Dwellings (A B C & D)
Number
Average Value
Number
Average Value
Number
Average Value
Number
Average Value
Number
Average Value
LOANS ORIGINATED
6
$93,820
35
$81,458
72
$74,780
12
$13,682
8
$77,139
APPLICATIONS APPROVED, NOT ACCEPTED
0
$0
2
$51,155
7
$76,431
2
$6,875
0
$0
APPLICATIONS DENIED
0
$0
13
$50,705
23
$59,148
4
$10,110
0
$0
APPLICATIONS WITHDRAWN
0
$0
1
$45,700
10
$71,215
1
$36,400
1
$58,640
FILES CLOSED FOR INCOMPLETENESS
0
$0
0
$0
1
$156,100
0
$0
0
$0
Aggregated Statistics For Year 2000 (Based on 2 partial tracts)
A) FHA, FSA/RHS & VA Home Purchase Loans
B) Conventional Home Purchase Loans
C) Refinancings
D) Home Improvement Loans
F) Non-occupant Loans on < 5 Family Dwellings (A B C & D)
Number
Average Value
Number
Average Value
Number
Average Value
Number
Average Value
Number
Average Value
LOANS ORIGINATED
3
$80,747
27
$69,811
26
$62,402
15
$84,439
5
$221,530
APPLICATIONS APPROVED, NOT ACCEPTED
0
$0
3
$56,347
6
$62,278
2
$15,570
0
$0
APPLICATIONS DENIED
0
$0
13
$48,684
11
$49,631
7
$21,201
1
$48,120
APPLICATIONS WITHDRAWN
0
$0
2
$55,200
7
$46,621
1
$10,920
0
$0
FILES CLOSED FOR INCOMPLETENESS
0
$0
0
$0
1
$31,950
0
$0
0
$0
Aggregated Statistics For Year 1999 (Based on 2 partial tracts)
A) FHA, FSA/RHS & VA Home Purchase Loans
B) Conventional Home Purchase Loans
C) Refinancings
D) Home Improvement Loans
E) Loans on Dwellings For 5+ Families
F) Non-occupant Loans on < 5 Family Dwellings (A B C & D)
Detailed PMIC statistics for the following Tracts:0056.01
, 0057.00
2002 - 2018 National Fire Incident Reporting System (NFIRS) incidents
Based on the data from the years 2002 - 2018 the average number of fire incidents per year is 16. The highest number of fires - 34 took place in 2010, and the least - 1 in 2004. The data has an increasing trend.
When looking into fire subcategories, the most incidents belonged to: Structure Fires (43.8%), and Outside Fires (38.5%).
Fire incident types reported to NFIRS in Zip Code 61728


 Nearest zip codes: 61730, 61720, 61731, 61722, 61737, 61770.
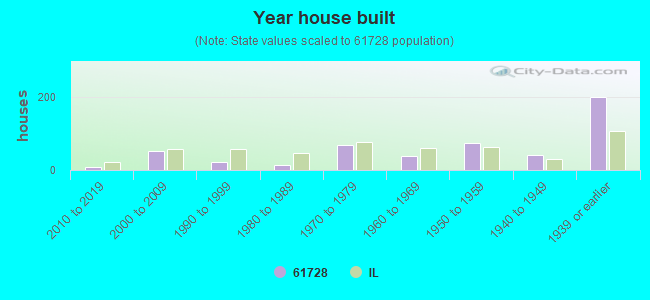


 Based on the data from the years 2002 - 2018 the average number of fire incidents per year is 16. The highest number of fires - 34 took place in 2010, and the least - 1 in 2004. The data has an increasing trend.
 When looking into fire subcategories, the most incidents belonged to: Structure Fires (43.8%), and Outside Fires (38.5%).