Estimated zip code population in 2022: 1,130 Zip code population in 2010: 1,108 Zip code population in 2000: 1,143
Houses and condos: 466 Renter-occupied apartments: 89
% of renters here:
21%
State:
33%
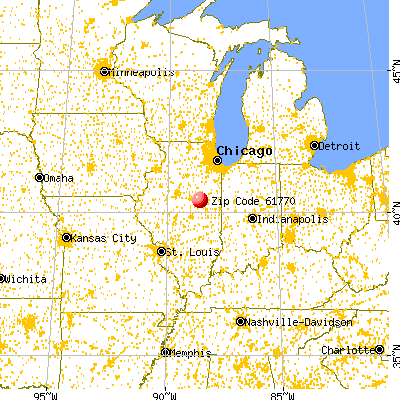
March 2022 cost of living index in zip code 61770: 84.6 (less than average, U.S. average is 100)
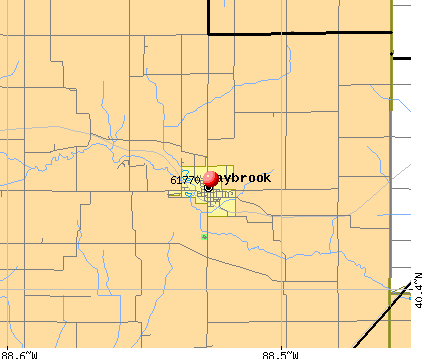
Land area: 62.3 sq. mi. Water area: 0.1 sq. mi.
Population density: 18 people per square mile
(very low).
OSM Map
General Map
Google Map
MSN Map
OSM Map
General Map
Google Map
MSN Map
OSM Map
General Map
Google Map
MSN Map
OSM Map
General Map
Google Map
MSN Map
Please wait while loading the map...
Real estate property taxes paid for housing units in 2022:
This zip code:
2.2% ($2,481)
Illinois:
2.0% ($4,912)
Median real estate property taxes paid for housing units with mortgages in 2022: $2,846 (2.1%) Median real estate property taxes paid for housing units with no mortgage in 2022: $1,706 (2.3%)
Business Search- 14 Million verified businesses
Males: 531
(47.1%)
Females: 598
(52.9%)
For population 25 years and over in 61770:
High school or higher: 86.5%
Bachelor's degree or higher: 17.3%
Graduate or professional degree: 2.5%
Unemployed: 3.8%
Mean travel time to work (commute): 34.0 minutes
For population 15 years and over in 61770:
Never married: 21.1%
Now married: 55.8%
Separated: 2.1%
Widowed: 8.5%
Divorced: 12.5%
Zip code 61770 compared to state average:
Median house value below state average.
Black race population percentage significantly below state average.
Hispanic race population percentage significantly below state average.
Foreign-born population percentage significantly below state average.
Renting percentage below state average.
Length of stay since moving in significantly above state average.
Number of rooms per house above state average.
Number of college students below state average.
Percentage of population with a bachelor's degree or higher significantly below state average.
Averages for the 2020 tax year for zip code 61770, filed in 2021:
Average Adjusted Gross Income (AGI) in 2020: $61,629 (Individual Income Tax Returns)
Here:
$61,629
State:
$82,626
Salary/wage: $46,665 (reported on 84.3% of returns)
Here:
$46,665
State:
$66,640
(% of AGI for various income ranges: 1266.0% for AGIs below $25k, 3425.6% for AGIs $25k-50k, 5902.9% for AGIs $50k-75k, 10873.3% for AGIs $75k-100k, 20807.5% for AGIs $100k-200k)
Taxable interest for individuals: $576 (reported on 41.2% of returns)
This zip code:
$576
Illinois:
$2,376
(% of AGI for various income ranges: 8.0% for AGIs below $25k, 33.3% for AGIs $25k-50k, 37.1% for AGIs $50k-75k, 43.3% for AGIs $75k-100k, 110.0% for AGIs $100k-200k)
Ordinary dividends: $2,629 (reported on 13.7% of returns)
Here:
$2,629
State:
$9,061
(% of AGI for various income ranges: 40.0% for AGIs below $25k, 95.7% for AGIs $50k-75k, 192.5% for AGIs $100k-200k)
Net capital gain/loss in AGI: +$1,980 (reported on 9.8% of returns)
Here:
+$1,980
State:
+$31,684
(% of AGI for various income ranges: 22.2% for AGIs $25k-50k, 197.5% for AGIs $100k-200k)
Profit/loss from business: +$4,900 (reported on 13.7% of returns)
Here:
+$4,900
State:
+$12,175
(% of AGI for various income ranges: 185.6% for AGIs $25k-50k, 586.7% for AGIs $75k-100k)
Taxable individual retirement arrangement distribution: $15,825 (reported on 7.8% of returns)
61770:
$15,825
Illinois:
$21,613
(% of AGI for various income ranges: 904.3% for AGIs $50k-75k)
Total itemized deductions: $31,500 (reported on 5.9% of returns)
Here:
$31,500
State:
$34,948
(% of AGI for various income ranges: 1350.0% for AGIs $50k-75k)
Charity contributions: $7,650 (reported on 3.9% of returns)
Here:
$7,650
State:
$13,122
(% of AGI for various income ranges: 170.0% for AGIs $25k-50k)
Taxes paid: $6,700 (reported on 5.9% of returns)
61770:
$6,700
State:
$8,563
(% of AGI for various income ranges: 287.1% for AGIs $50k-75k)
Earned income credit: $1,686 (reported on 13.7% of returns)
Here:
$1,686
State:
$2,311
(% of AGI for various income ranges: 58.0% for AGIs below $25k, 66.7% for AGIs $25k-50k)
Percentage of individuals using paid preparers for their 2020 taxes: 96.1%
Here:
96%
State:
93%
(% for various income ranges: 93.3% for AGIs below $25k, 100.0% for AGIs $25k-50k, 90.0% for AGIs $50k-75k, 100.0% for AGIs $75k-100k, 100.0% for AGIs $100k-200k)
Averages for the 2012 tax year for zip code 61770, filed in 2013:
Average Adjusted Gross Income (AGI) in 2012: $50,766 (Individual Income Tax Returns)
Here:
$50,766
State:
$68,058
Salary/wage: $39,809 (reported on 83.0% of returns)
Here:
$39,809
State:
$55,396
(% of AGI for various income ranges: 67.8% for AGIs below $25k, 79.6% for AGIs $25k-50k, 73.1% for AGIs $50k-75k, 78.6% for AGIs $75k-100k, 41.2% for AGIs $100k-200k)
Taxable interest for individuals: $529 (reported on 39.6% of returns)
This zip code:
$529
Illinois:
$1,969
(% of AGI for various income ranges: 0.7% for AGIs below $25k, 0.3% for AGIs $25k-50k, 0.5% for AGIs $50k-75k, 0.2% for AGIs $75k-100k, 0.4% for AGIs $100k-200k)
Ordinary dividends: $1,762 (reported on 15.1% of returns)
Here:
$1,762
State:
$7,786
(% of AGI for various income ranges: 0.4% for AGIs below $25k, 0.7% for AGIs $25k-50k, 1.9% for AGIs $75k-100k)
Net capital gain/loss in AGI: +$1,820 (reported on 9.4% of returns)
Here:
+$1,820
State:
+$22,183
Profit/loss from business: +$4,488 (reported on 15.1% of returns)
Here:
+$4,488
State:
+$12,903
(% of AGI for various income ranges: 5.1% for AGIs below $25k, 2.4% for AGIs $25k-50k, 2.1% for AGIs $50k-75k)
Taxable individual retirement arrangement distribution: $5,440 (reported on 9.4% of returns)
61770:
$5,440
Illinois:
$17,929
Total itemized deductions: $14,921 (19% of AGI, reported on 26.4% of returns)
Here:
$14,921
State:
$26,433
Here:
18.6% of AGI
State:
19.2% of AGI
(% of AGI for various income ranges: 8.1% for AGIs $25k-50k, 8.4% for AGIs $50k-75k, 8.8% for AGIs $75k-100k, 8.3% for AGIs $100k-200k)
Charity contributions: $3,410 (reported on 18.9% of returns)
Here:
$3,410
State:
$4,525
(% of AGI for various income ranges: 2.2% for AGIs below $25k, 1.4% for AGIs $50k-75k, 1.2% for AGIs $75k-100k, 1.8% for AGIs $100k-200k)
Taxes paid: $6,408 (reported on 24.5% of returns)
61770:
$6,408
State:
$11,968
(% of AGI for various income ranges: 2.8% for AGIs $25k-50k, 2.9% for AGIs $50k-75k, 3.9% for AGIs $75k-100k, 3.7% for AGIs $100k-200k)
Earned income credit: $2,088 (reported on 15.1% of returns)
Here:
$2,088
State:
$2,349
(% of AGI for various income ranges: 5.1% for AGIs below $25k, 1.3% for AGIs $25k-50k)
Percentage of individuals using paid preparers for their 2012 taxes: 64.2%
Here:
64%
State:
57%
(% for various income ranges: 55.6% for AGIs below $25k, 64.3% for AGIs $25k-50k, 60.0% for AGIs $50k-75k, 83.3% for AGIs $75k-100k, 80.0% for AGIs $100k-200k)
Averages for the 2004 tax year for zip code 61770, filed in 2005:
Average Adjusted Gross Income (AGI) in 2004: $36,689 (Individual Income Tax Returns)
Here:
$36,689
State:
$54,625
Salary/wage: $33,500 (reported on 82.6% of returns)
Here:
$33,500
State:
$46,811
(% of AGI for various income ranges: 104.9% for AGIs below $10k, 67.9% for AGIs $10k-25k, 79.5% for AGIs $25k-50k, 79.6% for AGIs $50k-75k, 78.2% for AGIs $75k-100k, 61.2% for AGIs over 100k)
Taxable interest for individuals: $1,000 (reported on 52.9% of returns)
This zip code:
$1,000
Illinois:
$2,101
(% of AGI for various income ranges: 12.1% for AGIs below $10k, 2.2% for AGIs $10k-25k, 0.8% for AGIs $25k-50k, 2.0% for AGIs $50k-75k, 0.5% for AGIs $75k-100k, 0.6% for AGIs over 100k)
Taxable dividends: $745 (reported on 25.4% of returns)
Here:
$745
State:
$4,306
(% of AGI for various income ranges: 1.5% for AGIs below $10k, 0.3% for AGIs $10k-25k, 0.4% for AGIs $25k-50k, 0.6% for AGIs $50k-75k, 0.1% for AGIs $75k-100k, 0.9% for AGIs over 100k)
Net capital gain/loss: +$2,250 (reported on 13.0% of returns)
Here:
+$2,250
State:
+$17,321
(% of AGI for various income ranges: 3.9% for AGIs below $10k, -0.7% for AGIs $10k-25k, -0.2% for AGIs $25k-50k, 0.2% for AGIs $50k-75k, 4.6% for AGIs over 100k)
Profit/loss from business: +$3,676 (reported on 17.4% of returns)
Here:
+$3,676
State:
+$11,771
(% of AGI for various income ranges: 16.2% for AGIs below $10k, 3.6% for AGIs $10k-25k, 3.0% for AGIs $25k-50k, 0.7% for AGIs $50k-75k, 0.6% for AGIs $75k-100k)
Profit/loss from farming: +$14,833 (reported on 9.2% of returns)
Here:
+$14,833
State:
+$2,327
(% of AGI for various income ranges: -1.8% for AGIs below $10k, 0.6% for AGIs $25k-50k, 1.8% for AGIs $50k-75k, 21.5% for AGIs $75k-100k)
Total itemized deductions: $14,261 (25% of AGI, reported on 24.2% of returns)
Here:
$14,261
State:
$20,239
Here:
24.8% of AGI
State:
19.5% of AGI
(% of AGI for various income ranges: 14.6% for AGIs $10k-25k, 10.4% for AGIs $25k-50k, 7.5% for AGIs $50k-75k, 7.4% for AGIs $75k-100k, 10.7% for AGIs over 100k)
Charity contributions deductions: $2,288 (4% of AGI, reported on 18.9% of returns)
Here:
$2,288
State:
$3,719
Here:
3.8% of AGI
State:
3.4% of AGI
(% of AGI for various income ranges: 1.2% for AGIs $10k-25k, 0.7% for AGIs $25k-50k, 1.5% for AGIs $50k-75k, 1.0% for AGIs $75k-100k, 1.5% for AGIs over 100k)
Total tax: $4,679 (reported on 75.4% of returns)
61770:
$4,679
State:
$9,882
(% of AGI for various income ranges: 3.1% for AGIs below $10k, 4.0% for AGIs $10k-25k, 7.3% for AGIs $25k-50k, 9.2% for AGIs $50k-75k, 11.8% for AGIs $75k-100k, 16.2% for AGIs over 100k)
Earned income credit: $1,614 (reported on 11.9% of returns)
Here:
$1,614
State:
$1,788
Percentage of individuals using paid preparers for their 2004 taxes: 66.7%
Here:
67%
State:
61%
(% for various income ranges: 60.8% for AGIs below $10k, 71.8% for AGIs $10k-25k, 61.5% for AGIs $25k-50k, 70.5% for AGIs $50k-75k, 69.4% for AGIs $75k-100k, 82.1% for AGIs over 100k)
Likely homosexual households (counted as self-reported same-sex unmarried-partner households)
Lesbian couples: 0.0% of all households
Gay men: 0.5% of all households
Household received Food Stamps/SNAP in the past 12 months: 69 Household did not receive Food Stamps/SNAP in the past 12 months: 356
Women who had a birth in the past 12 months: 41 (33 now married, 7 unmarried) Women who did not have a birth in the past 12 months: 195 (94 now married, 100 unmarried)
Housing units in zip code 61770 with a mortgage: 212 (12 second mortgage, 12 both second mortgage and home equity loan) Median monthly owner costs for units with a mortgage: $1,070 Median monthly owner costs for units without a mortgage: $443
Residents with income below the poverty level in 2022:
This zip code:
12.4%
Whole state:
11.9%
Residents with income below 50% of the poverty level in 2022:
This zip code:
3.0%
Whole state:
5.7%
Median number of rooms in houses and condos:
Here:
7.0
State:
6.4
Median number of rooms in apartments:
Here:
6.2
State:
4.1
Notable locations in this zip code not listed on our city pages
Size of family households: 102 2-persons, 73 3-persons, 31 4-persons, 43 5-persons, 10 6-persons, 15 7-or-more-persons
Size of nonfamily households: 116 1-person, 28 2-persons, 2 3-persons
203 married couples with children.
75 single-parent households (33 men, 42 women).
97.4% of residents of 61770 zip code speak English at home.
1.5% of residents speak Spanish at home (100% very well).
0.5% of residents speak other Indo-European language at home (100% very well).
Foreign born population: 8 (0.7%) (62.7% of them are naturalized citizens)
This zip code:
0.7%
Whole state:
14.4%
62%France
25%Honduras
27%German
19%American
9%English
7%Irish
6%Polish
2%Brazilian
2%French
Year of entry for the foreign-born population
02010 or later
02000 to 2009
21990 to 1999
8Before 1990
Facilities with environmental interests located in this zip code:
COILE'S DIESEL (110 S. MAIN ST. in SAYBROOK, IL)
National Pollutant Discharge Elimination System NON-MAJOR (Tracking pollutant discharge elimination systems) - permit Conditionally Exempt Small Quantity Generators, less than 100 kg/month of hazardous waste (Resource Conservation and Recovery Act (tracking hazardous waste)) Organizations: COILE MERLE (CONTACT/OWNER)
Alternative names: COILES GARAGE
AT AND T LONG LINES SAYBROOK (3 AND A HALF MI NW OF SAYBROOK in SAYBROOK, IL)
(Resource Conservation and Recovery Act (tracking hazardous waste))
ALLIANCE GRAIN CO (PO BOX 131 in SAYBROOK, IL)
AIR MINOR (AIRS/AFS) CRITERIA AND HAZARDOUS AIR POLLUTANT INVENTORY (Inventory of air pollution sources) Business SIC classification: GRAIN AND FIELD BEANS
NICOR GAS (3 MI SRT 9-1MI E SAYBROOK in SAYBROOK, IL)
AIR MINOR (AIRS/AFS) CRITERIA AND HAZARDOUS AIR POLLUTANT INVENTORY (Inventory of air pollution sources) Business SIC and NAICS classification: NATURAL GAS DISTRIBUTION
Housing units lacking complete plumbing facilities: 3.7% Housing units lacking complete kitchen facilities: 2.7%
61.2%Utility gas
29.5%Bottled, tank, or LP gas
7.4%Electricity
2.2%Wood
Population in 1990: 1,051. Population change in the 1990s: +92 (+8.8%).
Place of birth for U.S.-born residents:
This state: 986
Northeast: 1
Midwest: 77
South: 17
West: 31
65% of the 61770 zip code residents lived in the same house 5 years ago. Out of people who lived in different houses, 75% lived in this county. Out of people who lived in different counties, 50% lived in Illinois.
92% of the 61770 zip code residents lived in the same house 1 year ago. Out of people who lived in different houses, 22% moved from this county. Out of people who lived in different houses, 79% moved from different county within same state.
Private vs. public school enrollment:
Students in private schools in grades 1 to 8 (elementary and middle school): 16
Here:
14.8%
Illinois:
13.3%
Students in private schools in grades 9 to 12 (high school): 7
Here:
8.9%
Illinois:
9.9%
Students in private undergraduate colleges: 1
Here:
7.3%
Illinois:
27.4%
Occupation by median earnings in the past 12 months ($)
122,437Computer and mathematical occupations
86,337Management occupations
70,314Construction and extraction occupations
48,451Business and financial operations occupations
44,512Installation, maintenance, and repair occupations
42,367Transportation occupations
Top industries in this zip code by the number of employees in 2005:
Finance and Insurance: Insurance Agencies and Brokerages (10-19 employees: 1 establishment, 1-4 employees: 1 establishment)
Other Services (except Public Administration): General Automotive Repair (5-9: 1, 1-4: 1)
Wholesale Trade: Farm and Garden Machinery and Equipment Merchant Wholesalers (5-9: 1)
Finance and Insurance: Commercial Banking (5-9: 1)
Accommodation and Food Services: Full-Service Restaurants (1-4: 2)
Other Services (except Public Administration): Religious Organizations (1-4: 2)
Fatal accident statistics in 2010:
Fatal accident count: 1
Vehicles involved in fatal accidents: 2
Fatal accidents caused by drunken drivers: 0
Fatalities: 1
Persons involved in fatal accidents: 3
Pedestrians involved in fatal accidents: 0
Home Mortgage Disclosure Act Aggregated Statistics For Year 2009 (Based on 2 partial tracts)
A) FHA, FSA/RHS & VA Home Purchase Loans
B) Conventional Home Purchase Loans
C) Refinancings
D) Home Improvement Loans
F) Non-occupant Loans on < 5 Family Dwellings (A B C & D)
G) Loans On Manufactured Home Dwelling (A B C & D)
Number
Average Value
Number
Average Value
Number
Average Value
Number
Average Value
Number
Average Value
Number
Average Value
LOANS ORIGINATED
1
$110,120
5
$112,786
28
$123,605
3
$71,027
5
$55,624
0
$0
APPLICATIONS APPROVED, NOT ACCEPTED
0
$0
0
$0
3
$151,270
0
$0
0
$0
0
$0
APPLICATIONS DENIED
2
$81,185
1
$12,810
9
$102,156
1
$30,730
0
$0
1
$30,730
APPLICATIONS WITHDRAWN
2
$60,695
0
$0
5
$136,860
0
$0
0
$0
0
$0
FILES CLOSED FOR INCOMPLETENESS
0
$0
0
$0
1
$44,050
0
$0
0
$0
0
$0
Aggregated Statistics For Year 2008 (Based on 2 partial tracts)
A) FHA, FSA/RHS & VA Home Purchase Loans
B) Conventional Home Purchase Loans
C) Refinancings
D) Home Improvement Loans
F) Non-occupant Loans on < 5 Family Dwellings (A B C & D)
G) Loans On Manufactured Home Dwelling (A B C & D)
Number
Average Value
Number
Average Value
Number
Average Value
Number
Average Value
Number
Average Value
Number
Average Value
LOANS ORIGINATED
5
$104,592
9
$77,968
18
$101,928
2
$72,730
3
$81,953
1
$30,730
APPLICATIONS APPROVED, NOT ACCEPTED
0
$0
1
$59,420
2
$128,820
0
$0
1
$59,420
0
$0
APPLICATIONS DENIED
0
$0
2
$79,905
12
$110,550
2
$96,035
0
$0
0
$0
APPLICATIONS WITHDRAWN
1
$76,320
2
$65,305
5
$113,402
0
$0
0
$0
0
$0
FILES CLOSED FOR INCOMPLETENESS
0
$0
0
$0
0
$0
0
$0
0
$0
0
$0
Aggregated Statistics For Year 2007 (Based on 2 partial tracts)
A) FHA, FSA/RHS & VA Home Purchase Loans
B) Conventional Home Purchase Loans
C) Refinancings
D) Home Improvement Loans
F) Non-occupant Loans on < 5 Family Dwellings (A B C & D)
G) Loans On Manufactured Home Dwelling (A B C & D)
Number
Average Value
Number
Average Value
Number
Average Value
Number
Average Value
Number
Average Value
Number
Average Value
LOANS ORIGINATED
3
$96,807
8
$93,540
18
$100,761
5
$47,224
3
$61,633
0
$0
APPLICATIONS APPROVED, NOT ACCEPTED
0
$0
1
$74,780
4
$87,585
1
$79,390
1
$13,830
0
$0
APPLICATIONS DENIED
0
$0
3
$95,440
16
$120,495
6
$47,720
1
$121,900
1
$33,290
APPLICATIONS WITHDRAWN
1
$62,490
2
$96,295
4
$113,580
1
$143,420
1
$135,220
0
$0
FILES CLOSED FOR INCOMPLETENESS
0
$0
1
$30,220
2
$88,610
0
$0
2
$41,745
0
$0
Aggregated Statistics For Year 2006 (Based on 2 partial tracts)
A) FHA, FSA/RHS & VA Home Purchase Loans
B) Conventional Home Purchase Loans
C) Refinancings
D) Home Improvement Loans
F) Non-occupant Loans on < 5 Family Dwellings (A B C & D)
G) Loans On Manufactured Home Dwelling (A B C & D)
Number
Average Value
Number
Average Value
Number
Average Value
Number
Average Value
Number
Average Value
Number
Average Value
LOANS ORIGINATED
5
$86,870
9
$87,813
14
$110,781
3
$13,317
1
$54,810
0
$0
APPLICATIONS APPROVED, NOT ACCEPTED
1
$73,240
2
$113,965
5
$124,158
1
$20,490
0
$0
0
$0
APPLICATIONS DENIED
0
$0
2
$80,160
12
$98,684
5
$96,498
1
$87,590
0
$0
APPLICATIONS WITHDRAWN
1
$19,980
2
$35,340
7
$107,123
5
$77,342
0
$0
1
$114,220
FILES CLOSED FOR INCOMPLETENESS
0
$0
0
$0
2
$52,245
0
$0
0
$0
0
$0
Aggregated Statistics For Year 2005 (Based on 2 partial tracts)
A) FHA, FSA/RHS & VA Home Purchase Loans
B) Conventional Home Purchase Loans
C) Refinancings
D) Home Improvement Loans
F) Non-occupant Loans on < 5 Family Dwellings (A B C & D)
G) Loans On Manufactured Home Dwelling (A B C & D)
Number
Average Value
Number
Average Value
Number
Average Value
Number
Average Value
Number
Average Value
Number
Average Value
LOANS ORIGINATED
5
$80,518
15
$85,299
22
$98,249
4
$42,898
4
$50,965
1
$19,460
APPLICATIONS APPROVED, NOT ACCEPTED
0
$0
1
$143,420
4
$96,678
1
$2,560
0
$0
0
$0
APPLICATIONS DENIED
0
$0
8
$68,059
20
$103,618
1
$99,370
0
$0
1
$50,710
APPLICATIONS WITHDRAWN
1
$43,020
3
$80,927
11
$120,879
1
$25,610
1
$131,120
0
$0
FILES CLOSED FOR INCOMPLETENESS
0
$0
2
$81,950
1
$124,980
1
$25,610
0
$0
0
$0
Aggregated Statistics For Year 2004 (Based on 2 partial tracts)
A) FHA, FSA/RHS & VA Home Purchase Loans
B) Conventional Home Purchase Loans
C) Refinancings
D) Home Improvement Loans
F) Non-occupant Loans on < 5 Family Dwellings (A B C & D)
G) Loans On Manufactured Home Dwelling (A B C & D)
Number
Average Value
Number
Average Value
Number
Average Value
Number
Average Value
Number
Average Value
Number
Average Value
LOANS ORIGINATED
4
$75,292
12
$107,605
24
$102,376
6
$39,353
2
$68,890
1
$46,100
APPLICATIONS APPROVED, NOT ACCEPTED
0
$0
1
$48,660
2
$76,320
1
$4,610
0
$0
0
$0
APPLICATIONS DENIED
0
$0
3
$61,463
16
$113,708
5
$61,260
0
$0
1
$54,810
APPLICATIONS WITHDRAWN
1
$40,980
2
$30,220
18
$103,180
0
$0
0
$0
0
$0
FILES CLOSED FOR INCOMPLETENESS
0
$0
1
$50,710
1
$90,660
0
$0
0
$0
0
$0
Aggregated Statistics For Year 2003 (Based on 2 partial tracts)
A) FHA, FSA/RHS & VA Home Purchase Loans
B) Conventional Home Purchase Loans
C) Refinancings
D) Home Improvement Loans
F) Non-occupant Loans on < 5 Family Dwellings (A B C & D)
Number
Average Value
Number
Average Value
Number
Average Value
Number
Average Value
Number
Average Value
LOANS ORIGINATED
4
$52,758
9
$97,090
62
$95,360
4
$21,512
4
$69,402
APPLICATIONS APPROVED, NOT ACCEPTED
1
$75,290
1
$97,830
4
$65,305
0
$0
0
$0
APPLICATIONS DENIED
0
$0
3
$40,633
20
$79,929
2
$28,685
2
$48,660
APPLICATIONS WITHDRAWN
0
$0
1
$63,510
16
$92,068
0
$0
1
$24,070
FILES CLOSED FOR INCOMPLETENESS
0
$0
0
$0
1
$30,730
0
$0
0
$0
Aggregated Statistics For Year 1999 (Based on 1 partial tract)
Detailed PMIC statistics for the following Tracts:0056.02
2002 - 2018 National Fire Incident Reporting System (NFIRS) incidents
Based on the data from the years 2002 - 2018 the average number of fires per year is 9. The highest number of fires - 29 took place in 2013, and the least - 0 in 2004. The data has a rising trend.
When looking into fire subcategories, the most incidents belonged to: Structure Fires (59.5%), and Outside Fires (30.1%).
Fire incident types reported to NFIRS in Zip Code 61770


 Nearest zip codes: 61722, 61720, 61724, 61845, 61728, 60936.


 Based on the data from the years 2002 - 2018 the average number of fires per year is 9. The highest number of fires - 29 took place in 2013, and the least - 0 in 2004. The data has a rising trend.
 When looking into fire subcategories, the most incidents belonged to: Structure Fires (59.5%), and Outside Fires (30.1%).