Estimated zip code population in 2022: 2,485 Zip code population in 2010: 2,867 Zip code population in 2000: 3,054
Houses and condos: 1,155 Renter-occupied apartments: 170
% of renters here:
17%
State:
33%
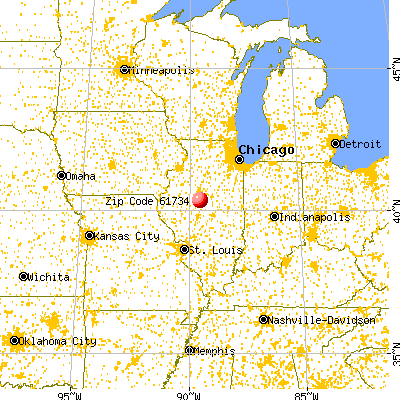
March 2022 cost of living index in zip code 61734: 84.9 (less than average, U.S. average is 100)
Land area: 82.8 sq. mi. Water area: 0.0 sq. mi.
Population density: 30 people per square mile
(very low).
OSM Map
General Map
Google Map
MSN Map
OSM Map
General Map
Google Map
MSN Map
OSM Map
General Map
Google Map
MSN Map
OSM Map
General Map
Google Map
MSN Map
Please wait while loading the map...
Real estate property taxes paid for housing units in 2022:
This zip code:
2.0% ($2,885)
Illinois:
2.0% ($4,912)
Median real estate property taxes paid for housing units with mortgages in 2022: $2,935 (2.1%) Median real estate property taxes paid for housing units with no mortgage in 2022: $2,860 (1.9%)
Business Search- 14 Million verified businesses
Males: 1,194
(48.1%)
Females: 1,290
(51.9%)
For population 25 years and over in 61734:
High school or higher: 92.0%
Bachelor's degree or higher: 20.2%
Graduate or professional degree: 3.7%
Unemployed: 4.4%
Mean travel time to work (commute): 28.8 minutes
For population 15 years and over in 61734:
Never married: 18.5%
Now married: 59.8%
Separated: 1.9%
Widowed: 6.9%
Divorced: 13.0%
Zip code 61734 compared to state average:
Median house value below state average.
Black race population percentage significantly below state average.
Hispanic race population percentage significantly below state average.
Median age above state average.
Foreign-born population percentage significantly below state average.
Renting percentage below state average.
Length of stay since moving in significantly above state average.
Number of college students below state average.
Percentage of population with a bachelor's degree or higher below state average.
Averages for the 2020 tax year for zip code 61734, filed in 2021:
Average Adjusted Gross Income (AGI) in 2020: $63,457 (Individual Income Tax Returns)
Here:
$63,457
State:
$82,626
Salary/wage: $48,356 (reported on 80.0% of returns)
Here:
$48,356
State:
$66,640
(% of AGI for various income ranges: 1024.3% for AGIs below $25k, 3346.5% for AGIs $25k-50k, 6089.2% for AGIs $50k-75k, 8476.0% for AGIs $75k-100k, 12943.8% for AGIs $100k-200k)
Taxable interest for individuals: $766 (reported on 51.2% of returns)
This zip code:
$766
Illinois:
$2,376
(% of AGI for various income ranges: 22.0% for AGIs below $25k, 29.1% for AGIs $25k-50k, 57.7% for AGIs $50k-75k, 44.0% for AGIs $75k-100k, 103.8% for AGIs $100k-200k)
Ordinary dividends: $4,241 (reported on 17.6% of returns)
Here:
$4,241
State:
$9,061
(% of AGI for various income ranges: 17.7% for AGIs below $25k, 27.8% for AGIs $25k-50k, 56.9% for AGIs $50k-75k, 64.0% for AGIs $75k-100k, 201.5% for AGIs $100k-200k)
Net capital gain/loss in AGI: +$18,989 (reported on 14.4% of returns)
Here:
+$18,989
State:
+$31,684
(% of AGI for various income ranges: 2.7% for AGIs below $25k, 19.6% for AGIs $25k-50k, 0.8% for AGIs $50k-75k, 147.0% for AGIs $75k-100k, 230.8% for AGIs $100k-200k)
Profit/loss from business: +$8,842 (reported on 9.6% of returns)
Here:
+$8,842
State:
+$12,175
(% of AGI for various income ranges: 71.0% for AGIs below $25k, 116.9% for AGIs $50k-75k, 101.0% for AGIs $75k-100k, 457.7% for AGIs $100k-200k)
Taxable individual retirement arrangement distribution: $15,847 (reported on 12.0% of returns)
61734:
$15,847
Illinois:
$21,613
(% of AGI for various income ranges: 35.3% for AGIs below $25k, 97.0% for AGIs $25k-50k, 373.8% for AGIs $50k-75k, 1201.5% for AGIs $100k-200k)
Total itemized deductions: $29,467 (reported on 4.8% of returns)
Here:
$29,467
State:
$34,948
(% of AGI for various income ranges: 293.5% for AGIs $25k-50k, 840.8% for AGIs $100k-200k)
Charity contributions: $11,800 (reported on 2.4% of returns)
Here:
$11,800
State:
$13,122
(% of AGI for various income ranges: 272.3% for AGIs $100k-200k)
Taxes paid: $7,380 (reported on 4.0% of returns)
61734:
$7,380
State:
$8,563
(% of AGI for various income ranges: 50.4% for AGIs $25k-50k, 194.6% for AGIs $100k-200k)
Earned income credit: $2,022 (reported on 14.4% of returns)
Here:
$2,022
State:
$2,311
(% of AGI for various income ranges: 74.0% for AGIs below $25k, 61.7% for AGIs $25k-50k)
Percentage of individuals using paid preparers for their 2020 taxes: 94.4%
Here:
94%
State:
93%
(% for various income ranges: 92.3% for AGIs below $25k, 96.6% for AGIs $25k-50k, 94.4% for AGIs $50k-75k, 100.0% for AGIs $75k-100k, 95.0% for AGIs $100k-200k, 80.0% for AGIs over 200k)
Averages for the 2012 tax year for zip code 61734, filed in 2013:
Average Adjusted Gross Income (AGI) in 2012: $56,956 (Individual Income Tax Returns)
Here:
$56,956
State:
$68,058
Salary/wage: $43,638 (reported on 80.9% of returns)
Here:
$43,638
State:
$55,396
(% of AGI for various income ranges: 64.6% for AGIs below $25k, 71.7% for AGIs $25k-50k, 70.7% for AGIs $50k-75k, 67.6% for AGIs $75k-100k, 65.6% for AGIs $100k-200k, 26.6% for AGIs over 200k)
Taxable interest for individuals: $1,053 (reported on 51.9% of returns)
This zip code:
$1,053
Illinois:
$1,969
(% of AGI for various income ranges: 1.5% for AGIs below $25k, 0.7% for AGIs $25k-50k, 0.4% for AGIs $50k-75k, 1.1% for AGIs $75k-100k, 0.7% for AGIs $100k-200k, 1.9% for AGIs over 200k)
Ordinary dividends: $3,247 (reported on 22.9% of returns)
Here:
$3,247
State:
$7,786
(% of AGI for various income ranges: 1.3% for AGIs below $25k, 0.5% for AGIs $25k-50k, 1.0% for AGIs $50k-75k, 0.6% for AGIs $75k-100k, 1.4% for AGIs $100k-200k, 3.1% for AGIs over 200k)
Net capital gain/loss in AGI: +$6,284 (reported on 14.5% of returns)
Here:
+$6,284
State:
+$22,183
(% of AGI for various income ranges: 0.3% for AGIs $25k-50k, 0.2% for AGIs $50k-75k, 0.9% for AGIs $75k-100k, 1.2% for AGIs $100k-200k, 7.0% for AGIs over 200k)
Profit/loss from business: +$9,218 (reported on 13.0% of returns)
Here:
+$9,218
State:
+$12,903
(% of AGI for various income ranges: 3.6% for AGIs below $25k, 3.3% for AGIs $25k-50k, 1.6% for AGIs $50k-75k, 2.5% for AGIs $75k-100k, 2.3% for AGIs $100k-200k)
Taxable individual retirement arrangement distribution: $10,674 (reported on 14.5% of returns)
61734:
$10,674
Illinois:
$17,929
(% of AGI for various income ranges: 4.1% for AGIs below $25k, 2.3% for AGIs $25k-50k, 3.0% for AGIs $50k-75k, 2.0% for AGIs $75k-100k, 4.2% for AGIs $100k-200k)
Total itemized deductions: $18,100 (18% of AGI, reported on 27.5% of returns)
Here:
$18,100
State:
$26,433
Here:
17.6% of AGI
State:
19.2% of AGI
(% of AGI for various income ranges: 5.6% for AGIs below $25k, 6.5% for AGIs $25k-50k, 6.6% for AGIs $50k-75k, 10.1% for AGIs $75k-100k, 11.1% for AGIs $100k-200k, 8.9% for AGIs over 200k)
Charity contributions: $4,033 (reported on 20.6% of returns)
Here:
$4,033
State:
$4,525
(% of AGI for various income ranges: 0.9% for AGIs $25k-50k, 0.6% for AGIs $50k-75k, 1.5% for AGIs $75k-100k, 1.9% for AGIs $100k-200k, 2.8% for AGIs over 200k)
Taxes paid: $7,306 (reported on 27.5% of returns)
61734:
$7,306
State:
$11,968
(% of AGI for various income ranges: 1.2% for AGIs below $25k, 2.1% for AGIs $25k-50k, 2.5% for AGIs $50k-75k, 3.6% for AGIs $75k-100k, 5.0% for AGIs $100k-200k, 4.3% for AGIs over 200k)
Earned income credit: $2,088 (reported on 13.0% of returns)
Here:
$2,088
State:
$2,349
(% of AGI for various income ranges: 4.5% for AGIs below $25k, 1.1% for AGIs $25k-50k)
Percentage of individuals using paid preparers for their 2012 taxes: 61.8%
Here:
62%
State:
57%
(% for various income ranges: 54.5% for AGIs below $25k, 61.3% for AGIs $25k-50k, 59.1% for AGIs $50k-75k, 71.4% for AGIs $75k-100k, 70.6% for AGIs $100k-200k, 100.0% for AGIs over 200k)
Averages for the 2004 tax year for zip code 61734, filed in 2005:
Average Adjusted Gross Income (AGI) in 2004: $40,970 (Individual Income Tax Returns)
Here:
$40,970
State:
$54,625
Salary/wage: $33,959 (reported on 84.3% of returns)
Here:
$33,959
State:
$46,811
(% of AGI for various income ranges: 93.5% for AGIs below $10k, 61.0% for AGIs $10k-25k, 72.8% for AGIs $25k-50k, 77.9% for AGIs $50k-75k, 72.4% for AGIs $75k-100k, 58.2% for AGIs over 100k)
Taxable interest for individuals: $1,716 (reported on 52.5% of returns)
This zip code:
$1,716
Illinois:
$2,101
(% of AGI for various income ranges: 7.5% for AGIs below $10k, 3.1% for AGIs $10k-25k, 1.5% for AGIs $25k-50k, 1.7% for AGIs $50k-75k, 2.4% for AGIs $75k-100k, 2.6% for AGIs over 100k)
Taxable dividends: $1,843 (reported on 26.9% of returns)
Here:
$1,843
State:
$4,306
(% of AGI for various income ranges: 1.4% for AGIs below $10k, 1.7% for AGIs $10k-25k, 0.9% for AGIs $25k-50k, 0.7% for AGIs $50k-75k, 1.2% for AGIs $75k-100k, 1.8% for AGIs over 100k)
Net capital gain/loss: +$6,799 (reported on 16.2% of returns)
Here:
+$6,799
State:
+$17,321
(% of AGI for various income ranges: -2.0% for AGIs below $10k, 0.5% for AGIs $10k-25k, 0.3% for AGIs $25k-50k, 0.4% for AGIs $50k-75k, 2.0% for AGIs $75k-100k, 9.2% for AGIs over 100k)
Profit/loss from business: +$7,817 (reported on 14.5% of returns)
Here:
+$7,817
State:
+$11,771
(% of AGI for various income ranges: 9.1% for AGIs below $10k, 7.0% for AGIs $10k-25k, 4.2% for AGIs $25k-50k, 2.8% for AGIs $50k-75k, 0.2% for AGIs $75k-100k, 1.2% for AGIs over 100k)
Profit/loss from farming: +$7,469 (reported on 6.0% of returns)
Here:
+$7,469
State:
+$2,327
(% of AGI for various income ranges: -1.8% for AGIs $10k-25k, -1.3% for AGIs $25k-50k, 1.4% for AGIs $50k-75k, 6.7% for AGIs $75k-100k)
IRA payment deduction: $2,571 (reported on 2.6% of returns)
61734:
$2,571
Illinois:
$3,087
Total itemized deductions: $14,780 (21% of AGI, reported on 23.8% of returns)
Here:
$14,780
State:
$20,239
Here:
20.6% of AGI
State:
19.5% of AGI
(% of AGI for various income ranges: 11.4% for AGIs $10k-25k, 7.5% for AGIs $25k-50k, 9.2% for AGIs $50k-75k, 8.8% for AGIs $75k-100k, 8.5% for AGIs over 100k)
Charity contributions deductions: $3,426 (5% of AGI, reported on 19.6% of returns)
Here:
$3,426
State:
$3,719
Here:
4.6% of AGI
State:
3.4% of AGI
(% of AGI for various income ranges: 1.0% for AGIs $10k-25k, 1.3% for AGIs $25k-50k, 1.3% for AGIs $50k-75k, 1.5% for AGIs $75k-100k, 2.8% for AGIs over 100k)
Total tax: $5,410 (reported on 76.2% of returns)
61734:
$5,410
State:
$9,882
(% of AGI for various income ranges: 2.7% for AGIs below $10k, 4.4% for AGIs $10k-25k, 6.8% for AGIs $25k-50k, 8.6% for AGIs $50k-75k, 11.0% for AGIs $75k-100k, 16.8% for AGIs over 100k)
Earned income credit: $1,418 (reported on 10.8% of returns)
Here:
$1,418
State:
$1,788
Percentage of individuals using paid preparers for their 2004 taxes: 60.1%
Here:
60%
State:
61%
(% for various income ranges: 46.8% for AGIs below $10k, 61.1% for AGIs $10k-25k, 65.1% for AGIs $25k-50k, 61.9% for AGIs $50k-75k, 61.9% for AGIs $75k-100k, 72.7% for AGIs over 100k)
Likely homosexual households (counted as self-reported same-sex unmarried-partner households)
Lesbian couples: 0.8% of all households
Gay men: 0.0% of all households
Household received Food Stamps/SNAP in the past 12 months: 104 Household did not receive Food Stamps/SNAP in the past 12 months: 909
Women who had a birth in the past 12 months: 17 (13 now married, 3 unmarried) Women who did not have a birth in the past 12 months: 447 (223 now married, 221 unmarried)
Housing units in zip code 61734 with a mortgage: 437 (49 second mortgage, 49 both second mortgage and home equity loan) Houses without a mortgage: 22
Median monthly owner costs for units with a mortgage: $1,222 Median monthly owner costs for units without a mortgage: $594
Residents with income below the poverty level in 2022:
This zip code:
9.5%
Whole state:
11.9%
Residents with income below 50% of the poverty level in 2022:
This zip code:
4.6%
Whole state:
5.7%
Median number of rooms in houses and condos:
Here:
6.2
State:
6.4
Median number of rooms in apartments:
Here:
5.5
State:
4.1
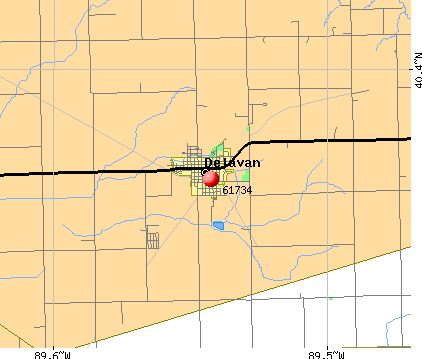
Notable locations in this zip code not listed on our city pages
Notable locations in zip code 61734: Dillon Townhall (A), Delavan Ambulance Service (B), Delavan Fire Protection District (C). Display/hide their locations on the map
Cemeteries: Prairie Rest Cemetery (1), Patterson Cemetery (2), Saint Mary's Catholic Cemetery (3), Freeman Cemetery (4), Danforth Cemetery (5), Bratt Cemetery (6). Display/hide their locations on the map
Size of family households: 378 2-persons, 145 3-persons, 131 4-persons, 35 5-persons, 20 6-persons, 11 7-or-more-persons
Size of nonfamily households: 236 1-person, 59 2-persons
357 married couples with children.
153 single-parent households (57 men, 96 women).
99.3% of residents of 61734 zip code speak English at home.
0.4% of residents speak Spanish at home (20% very well, 80% well).
0.1% of residents speak other Indo-European language at home (100% very well).
Foreign born population: 16 (0.6%) (68.9% of them are naturalized citizens)
This zip code:
0.6%
Whole state:
14.4%
12%Malaysia
6%Honduras
48%German
14%English
7%Irish
7%American
6%European
2%French
1%Dutch
Year of entry for the foreign-born population
392010 or later
72000 to 2009
21990 to 1999
4Before 1990
Major facilities with environmental interests located in this zip code:
DELAVAN (219 LOCUST in DELAVAN, IL)
STATE MASTER (Illinois EPA Project) - DRINKING WATER PROGRAM STATE MASTER (Illinois EPA Project) - National Pollutant Discharge Elimination System Permit National Pollutant Discharge Elimination System NON-MAJOR (Tracking pollutant discharge elimination systems) - permit Business SIC classification: SEWERAGE SYSTEMS Alternative names: DELAVAN, CITY OF, DELAVAN STP
HAYCOCK SOIL SERVICE (RT. 122 W in DELAVAN, IL)
STATE MASTER (Illinois EPA Project) - AIR PROGRAM AIR MINOR (AIRS/AFS) CRITERIA AND HAZARDOUS AIR POLLUTANT INVENTORY (Inventory of air pollution sources) Business SIC classification: FERTILIZERS, MIXING ONLY
ONEY S FOODS (505 LOCUST STREET in DELAVAN, IL)
STATE MASTER (Illinois EPA Project) - AIR PROGRAM AIR MINOR (AIRS/AFS) CRITERIA AND HAZARDOUS AIR POLLUTANT INVENTORY (Inventory of air pollution sources) Business SIC classification: GROCERY STORES Alternative names: ONEYS BIRITE
RIVERVIEW HATCHERIES (309 E 6TH STREET in DELAVAN, IL)
STATE MASTER (Illinois EPA Project) - AIR PROGRAM AIR MINOR (AIRS/AFS) Business SIC classification: FARM MACHINERY AND EQUIPMENT
MILITARY AND NAVAL DEPARTMENT (206 E. THIRD STREET in DELAVAN, IL)
STATE MASTER (Illinois EPA Project) - HAZARDOUS WASTE PROGRAM, AIR PROGRAM AIR MINOR (AIRS/AFS) Business SIC classification: NATIONAL SECURITY Alternative names: DEPT. OF MILITARY AFFAIRS
DELAVAN HIGH SCHOOL (907 LOCUST in DELAVAN, IL)
(Geographic Names Information System) (National Center for Education Statistics) - STATE ID-5309070300001 Organizations: DELAVAN COMM UNIT DIST 703 (SCHOOL DISTRICT)
ROLAND RICH FORD (RTE 122 E in DELAVAN, IL)
STATE MASTER (Illinois EPA Project) - HAZARDOUS WASTE PROGRAM, SCRAP TIRE MANAGEMENT, SOLID WASTE PROGRAM Conditionally Exempt Small Quantity Generators, less than 100 kg/month of hazardous waste (Resource Conservation and Recovery Act (tracking hazardous waste)) Alternative names: RICH ROLAND FORD
DELAVAN ELEMENTARY SCHOOL (907 LOCUST in DELAVAN, IL)
(National Center for Education Statistics) - STATE ID-5309070302001 Organizations: DELAVAN COMM UNIT DIST 703 (SCHOOL DISTRICT)
DELAVAN JR HIGH SCHOOL (907 LOCUST in DELAVAN, IL)
(National Center for Education Statistics) - STATE ID-5309070301001 Organizations: DELAVAN COMM UNIT DIST 703 (SCHOOL DISTRICT)
IDOT (BRG 090-9912 in DELAVAN, IL)
(Resource Conservation and Recovery Act (tracking hazardous waste))
MARCO FARM SUPPLY UNIT 199 (RR 1 in DELAVAN, IL)
(Resource Conservation and Recovery Act (tracking hazardous waste))
RYDER STUDENT TRANSPORTATION (907 LOCUST in DELAVAN, IL)
National Pollutant Discharge Elimination System NON-MAJOR (Tracking pollutant discharge elimination systems) - permit Organizations: PAXTON DISTRICT #2 (CONTACT/OWNER)
DELAVAN STP, CITY OF (1420 LINDEN ST in DELAVAN, IL)
National Pollutant Discharge Elimination System NON-MAJOR (Tracking pollutant discharge elimination systems) - permit Business SIC classification: SEWERAGE SYSTEMS
Housing units lacking complete plumbing facilities: 0.7% Housing units lacking complete kitchen facilities: 1.7%
64.3%Utility gas
19.3%Electricity
13.5%Bottled, tank, or LP gas
1.1%Other fuel
0.8%Wood
Population in 1990: 2,285. Population change in the 1990s: +769 (+33.7%).
Place of birth for U.S.-born residents:
This state: 2,035
Northeast: 48
Midwest: 164
South: 103
West: 75
68% of the 61734 zip code residents lived in the same house 5 years ago. Out of people who lived in different houses, 61% lived in this county. Out of people who lived in different counties, 50% lived in Illinois.
96% of the 61734 zip code residents lived in the same house 1 year ago. Out of people who lived in different houses, 83% moved from this county. Out of people who lived in different houses, 14% moved from different county within same state.
Private vs. public school enrollment:
Students in private schools in grades 1 to 8 (elementary and middle school): 37
Here:
11.0%
Illinois:
13.3%
Students in private schools in grades 9 to 12 (high school):
Here:
0.0%
Illinois:
9.9%
Students in private undergraduate colleges: 14
Here:
23.7%
Illinois:
27.4%
Occupation by median earnings in the past 12 months ($)
81,747Installation, maintenance, and repair occupations
79,544Production occupations
68,267Architecture and engineering occupations
65,168Management occupations
54,459Health diagnosing and treating practitioners and other technical occupations
54,458Construction and extraction occupations
Top industries in this zip code by the number of employees in 2005:
Administrative and Support and Waste Management and Remediation Services: Professional Employer Organizations (50-99 employees: 1 establishment)
Accommodation and Food Services: Full-Service Restaurants (10-19: 2)
Other Services (except Public Administration): Religious Organizations (5-9: 2, 1-4: 2)
Other Services (except Public Administration): Labor Unions and Similar Labor Organizations (10-19: 1, 1-4: 1)
Construction: Siding Contractors (10-19: 1)
Construction: Plumbing, Heating, and Air-Conditioning Contractors (5-9: 1, 1-4: 2)
Wholesale Trade: Grain and Field Bean Merchant Wholesalers (5-9: 1, 1-4: 1)
Fatal accident statistics in 2014:
Fatal accident count: 1
Vehicles involved in fatal accidents: 1
Fatal accidents caused by drunken drivers: 0
Fatalities: 1
Persons involved in fatal accidents: 1
Pedestrians involved in fatal accidents: 0
Home Mortgage Disclosure Act Aggregated Statistics For Year 2009 (Based on 4 partial tracts)
A) FHA, FSA/RHS & VA Home Purchase Loans
B) Conventional Home Purchase Loans
C) Refinancings
D) Home Improvement Loans
E) Loans on Dwellings For 5+ Families
F) Non-occupant Loans on < 5 Family Dwellings (A B C & D)
G) Loans On Manufactured Home Dwelling (A B C & D)
Number
Average Value
Number
Average Value
Number
Average Value
Number
Average Value
Number
Average Value
Number
Average Value
Number
Average Value
LOANS ORIGINATED
21
$106,681
34
$102,277
147
$118,073
9
$89,413
2
$457,785
7
$100,453
0
$0
APPLICATIONS APPROVED, NOT ACCEPTED
0
$0
0
$0
10
$145,460
1
$14,620
0
$0
0
$0
0
$0
APPLICATIONS DENIED
5
$145,262
12
$94,928
29
$104,647
7
$37,743
0
$0
1
$39,320
0
$0
APPLICATIONS WITHDRAWN
2
$82,100
3
$97,793
27
$113,794
1
$171,750
0
$0
1
$101,340
1
$58,460
FILES CLOSED FOR INCOMPLETENESS
1
$70,860
0
$0
2
$93,185
0
$0
0
$0
0
$0
0
$0
Aggregated Statistics For Year 2008 (Based on 4 partial tracts)
A) FHA, FSA/RHS & VA Home Purchase Loans
B) Conventional Home Purchase Loans
C) Refinancings
D) Home Improvement Loans
F) Non-occupant Loans on < 5 Family Dwellings (A B C & D)
G) Loans On Manufactured Home Dwelling (A B C & D)
Number
Average Value
Number
Average Value
Number
Average Value
Number
Average Value
Number
Average Value
Number
Average Value
LOANS ORIGINATED
20
$89,413
36
$104,769
91
$107,160
11
$51,695
11
$62,395
0
$0
APPLICATIONS APPROVED, NOT ACCEPTED
1
$200,180
2
$113,375
6
$69,675
4
$15,742
0
$0
1
$83,800
APPLICATIONS DENIED
2
$90,870
8
$66,585
44
$102,396
12
$91,402
1
$177,340
0
$0
APPLICATIONS WITHDRAWN
0
$0
1
$54,320
16
$104,251
2
$51,645
2
$53,105
1
$93,540
FILES CLOSED FOR INCOMPLETENESS
0
$0
1
$52,620
6
$110,585
0
$0
0
$0
0
$0
Aggregated Statistics For Year 2007 (Based on 4 partial tracts)
A) FHA, FSA/RHS & VA Home Purchase Loans
B) Conventional Home Purchase Loans
C) Refinancings
D) Home Improvement Loans
F) Non-occupant Loans on < 5 Family Dwellings (A B C & D)
Number
Average Value
Number
Average Value
Number
Average Value
Number
Average Value
Number
Average Value
LOANS ORIGINATED
7
$96,350
78
$98,784
73
$98,331
20
$33,400
11
$72,519
APPLICATIONS APPROVED, NOT ACCEPTED
0
$0
3
$88,103
19
$101,928
5
$50,522
0
$0
APPLICATIONS DENIED
1
$116,740
13
$59,009
63
$80,457
28
$46,365
3
$32,227
APPLICATIONS WITHDRAWN
1
$131,210
2
$70,610
23
$87,489
5
$49,884
0
$0
FILES CLOSED FOR INCOMPLETENESS
0
$0
0
$0
7
$93,981
0
$0
0
$0
Aggregated Statistics For Year 2006 (Based on 4 partial tracts)
A) FHA, FSA/RHS & VA Home Purchase Loans
B) Conventional Home Purchase Loans
C) Refinancings
D) Home Improvement Loans
F) Non-occupant Loans on < 5 Family Dwellings (A B C & D)
Number
Average Value
Number
Average Value
Number
Average Value
Number
Average Value
Number
Average Value
LOANS ORIGINATED
15
$93,124
64
$98,273
94
$85,014
23
$34,333
11
$80,217
APPLICATIONS APPROVED, NOT ACCEPTED
0
$0
4
$62,998
10
$104,256
3
$17,650
1
$31,180
APPLICATIONS DENIED
0
$0
16
$93,348
46
$90,722
16
$31,235
2
$83,840
APPLICATIONS WITHDRAWN
0
$0
3
$76,010
30
$120,821
3
$92,890
0
$0
FILES CLOSED FOR INCOMPLETENESS
0
$0
4
$68,118
6
$90,475
0
$0
0
$0
Aggregated Statistics For Year 2005 (Based on 4 partial tracts)
A) FHA, FSA/RHS & VA Home Purchase Loans
B) Conventional Home Purchase Loans
C) Refinancings
D) Home Improvement Loans
F) Non-occupant Loans on < 5 Family Dwellings (A B C & D)
G) Loans On Manufactured Home Dwelling (A B C & D)
Number
Average Value
Number
Average Value
Number
Average Value
Number
Average Value
Number
Average Value
Number
Average Value
LOANS ORIGINATED
15
$105,141
80
$89,109
104
$94,335
12
$24,372
12
$89,908
2
$40,400
APPLICATIONS APPROVED, NOT ACCEPTED
1
$208,050
4
$65,243
17
$93,023
0
$0
0
$0
0
$0
APPLICATIONS DENIED
1
$84,380
13
$57,397
59
$83,511
15
$38,645
0
$0
1
$30,720
APPLICATIONS WITHDRAWN
0
$0
7
$97,244
44
$113,284
2
$83,140
1
$60,620
0
$0
FILES CLOSED FOR INCOMPLETENESS
0
$0
1
$60,410
6
$109,535
0
$0
1
$60,410
0
$0
Aggregated Statistics For Year 2004 (Based on 4 partial tracts)
A) FHA, FSA/RHS & VA Home Purchase Loans
B) Conventional Home Purchase Loans
C) Refinancings
D) Home Improvement Loans
F) Non-occupant Loans on < 5 Family Dwellings (A B C & D)
G) Loans On Manufactured Home Dwelling (A B C & D)
Number
Average Value
Number
Average Value
Number
Average Value
Number
Average Value
Number
Average Value
Number
Average Value
LOANS ORIGINATED
9
$80,142
61
$90,814
139
$87,246
15
$35,043
12
$79,817
1
$4,870
APPLICATIONS APPROVED, NOT ACCEPTED
0
$0
8
$69,224
20
$87,030
3
$50,143
0
$0
0
$0
APPLICATIONS DENIED
1
$75,370
11
$55,345
64
$87,512
8
$30,502
1
$83,040
1
$8,190
APPLICATIONS WITHDRAWN
0
$0
6
$68,620
41
$96,536
2
$33,255
0
$0
0
$0
FILES CLOSED FOR INCOMPLETENESS
0
$0
1
$63,340
4
$94,508
2
$22,410
1
$63,340
0
$0
Aggregated Statistics For Year 2003 (Based on 4 partial tracts)
A) FHA, FSA/RHS & VA Home Purchase Loans
B) Conventional Home Purchase Loans
C) Refinancings
D) Home Improvement Loans
F) Non-occupant Loans on < 5 Family Dwellings (A B C & D)
Number
Average Value
Number
Average Value
Number
Average Value
Number
Average Value
Number
Average Value
LOANS ORIGINATED
13
$91,128
79
$83,097
336
$89,628
18
$21,771
14
$54,072
APPLICATIONS APPROVED, NOT ACCEPTED
1
$86,720
2
$61,385
26
$74,420
0
$0
1
$58,460
APPLICATIONS DENIED
1
$68,210
16
$72,358
99
$93,336
13
$14,978
3
$66,583
APPLICATIONS WITHDRAWN
0
$0
6
$94,582
49
$100,903
1
$15,970
0
$0
FILES CLOSED FOR INCOMPLETENESS
0
$0
2
$74,730
4
$96,988
0
$0
0
$0
Aggregated Statistics For Year 2002 (Based on 4 partial tracts)
A) FHA, FSA/RHS & VA Home Purchase Loans
B) Conventional Home Purchase Loans
C) Refinancings
D) Home Improvement Loans
E) Loans on Dwellings For 5+ Families
F) Non-occupant Loans on < 5 Family Dwellings (A B C & D)
Number
Average Value
Number
Average Value
Number
Average Value
Number
Average Value
Number
Average Value
Number
Average Value
LOANS ORIGINATED
12
$91,921
70
$82,816
236
$83,938
21
$7,752
1
$77,940
10
$63,495
APPLICATIONS APPROVED, NOT ACCEPTED
2
$62,360
1
$163,880
19
$85,527
7
$22,361
0
$0
0
$0
APPLICATIONS DENIED
0
$0
14
$63,234
81
$72,867
14
$10,501
0
$0
3
$51,697
APPLICATIONS WITHDRAWN
1
$76,980
3
$85,213
26
$96,827
2
$33,040
0
$0
0
$0
FILES CLOSED FOR INCOMPLETENESS
0
$0
0
$0
7
$70,824
0
$0
0
$0
0
$0
Aggregated Statistics For Year 2001 (Based on 4 partial tracts)
A) FHA, FSA/RHS & VA Home Purchase Loans
B) Conventional Home Purchase Loans
C) Refinancings
D) Home Improvement Loans
F) Non-occupant Loans on < 5 Family Dwellings (A B C & D)
Number
Average Value
Number
Average Value
Number
Average Value
Number
Average Value
Number
Average Value
LOANS ORIGINATED
21
$74,496
74
$85,666
223
$80,017
30
$16,712
4
$66,642
APPLICATIONS APPROVED, NOT ACCEPTED
1
$72,910
6
$47,258
13
$47,077
3
$14,950
0
$0
APPLICATIONS DENIED
0
$0
7
$66,589
55
$78,245
12
$23,486
4
$43,648
APPLICATIONS WITHDRAWN
0
$0
6
$85,380
29
$71,558
3
$14,787
0
$0
FILES CLOSED FOR INCOMPLETENESS
0
$0
0
$0
4
$53,792
0
$0
0
$0
Aggregated Statistics For Year 2000 (Based on 4 partial tracts)
A) FHA, FSA/RHS & VA Home Purchase Loans
B) Conventional Home Purchase Loans
C) Refinancings
D) Home Improvement Loans
F) Non-occupant Loans on < 5 Family Dwellings (A B C & D)
Number
Average Value
Number
Average Value
Number
Average Value
Number
Average Value
Number
Average Value
LOANS ORIGINATED
9
$77,418
79
$74,518
86
$62,412
36
$12,193
9
$52,062
APPLICATIONS APPROVED, NOT ACCEPTED
0
$0
4
$63,470
20
$66,396
11
$10,115
0
$0
APPLICATIONS DENIED
1
$53,590
8
$75,468
41
$71,479
17
$19,221
0
$0
APPLICATIONS WITHDRAWN
0
$0
11
$87,175
22
$61,569
2
$17,050
0
$0
FILES CLOSED FOR INCOMPLETENESS
0
$0
0
$0
7
$82,850
0
$0
0
$0
Aggregated Statistics For Year 1999 (Based on 2 partial tracts)
A) FHA, FSA/RHS & VA Home Purchase Loans
B) Conventional Home Purchase Loans
C) Refinancings
D) Home Improvement Loans
F) Non-occupant Loans on < 5 Family Dwellings (A B C & D)
Detailed PMIC statistics for the following Tracts:0219.00
, 0220.00
2002 - 2018 National Fire Incident Reporting System (NFIRS) incidents
Based on the data from the years 2002 - 2018 the average number of fire incidents per year is 20. The highest number of fires - 28 took place in 2004, and the least - 11 in 2006. The data has a decreasing trend.
When looking into fire subcategories, the most incidents belonged to: Outside Fires (51.5%), and Structure Fires (37.1%).
Fire incident types reported to NFIRS in Zip Code 61734


 Nearest zip codes: 61747, 62635, 61568, 62682, 62643, 61534.


 Based on the data from the years 2002 - 2018 the average number of fire incidents per year is 20. The highest number of fires - 28 took place in 2004, and the least - 11 in 2006. The data has a decreasing trend.
 When looking into fire subcategories, the most incidents belonged to: Outside Fires (51.5%), and Structure Fires (37.1%).