Estimated zip code population in 2022: 1,432 Zip code population in 2010: 1,560 Zip code population in 2000: 1,472
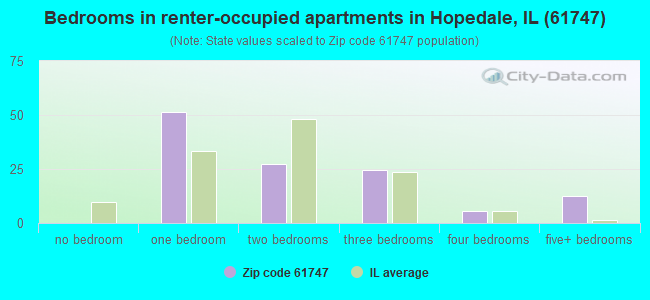
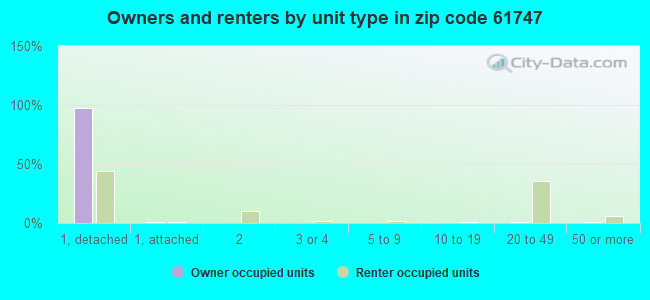
Houses and condos: 627 Renter-occupied apartments: 121
% of renters here:
20%
State:
33%
March 2022 cost of living index in zip code 61747: 84.9 (less than average, U.S. average is 100)
Land area: 27.8 sq. mi. Water area: 0.0 sq. mi.
Population density: 52 people per square mile
(very low).
OSM Map
General Map
Google Map
MSN Map
OSM Map
General Map
Google Map
MSN Map
OSM Map
General Map
Google Map
MSN Map
OSM Map
General Map
Google Map
MSN Map
Please wait while loading the map...
Real estate property taxes paid for housing units in 2022:
This zip code:
2.1% ($4,020)
Illinois:
2.0% ($4,912)
Median real estate property taxes paid for housing units with mortgages in 2022: $4,127 (1.8%) Median real estate property taxes paid for housing units with no mortgage in 2022: $2,865 (2.1%)
Business Search- 14 Million verified businesses
Males: 647
(45.2%)
Females: 784
(54.8%)
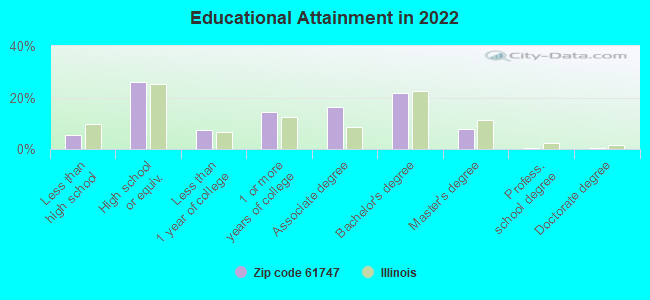
For population 25 years and over in 61747:
High school or higher: 94.4%
Bachelor's degree or higher: 30.6%
Graduate or professional degree: 9.0%
Unemployed: 4.1%
Mean travel time to work (commute): 24.6 minutes
For population 15 years and over in 61747:
Never married: 18.4%
Now married: 62.0%
Separated: 1.8%
Widowed: 10.0%
Divorced: 7.8%
Zip code 61747 compared to state average:
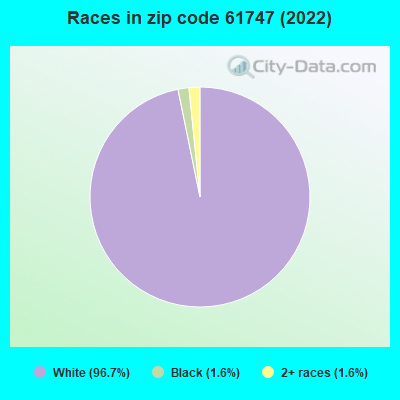
Black race population percentage significantly below state average.
Hispanic race population percentage significantly below state average.
Median age significantly above state average.
Foreign-born population percentage significantly below state average.
Estimated median house/condo value in 2022: $191,199
61747:
$191,199
Illinois:
$251,600
Median resident age:
This zip code:
50.7 years
Illinois median age:
39.1 years
Average household size:
This zip code:
2.2 people
Illinois:
2.4 people
Averages for the 2020 tax year for zip code 61747, filed in 2021:
Average Adjusted Gross Income (AGI) in 2020: $68,570 (Individual Income Tax Returns)
Here:
$68,570
State:
$82,626
Salary/wage: $57,658 (reported on 80.3% of returns)
Here:
$57,658
State:
$66,640
(% of AGI for various income ranges: 1074.6% for AGIs below $25k, 3214.5% for AGIs $25k-50k, 6311.2% for AGIs $50k-75k, 10662.5% for AGIs $75k-100k, 14115.0% for AGIs $100k-200k)
Taxable interest for individuals: $794 (reported on 50.7% of returns)
This zip code:
$794
Illinois:
$2,376
(% of AGI for various income ranges: 23.1% for AGIs below $25k, 26.4% for AGIs $25k-50k, 62.5% for AGIs $50k-75k, 22.5% for AGIs $75k-100k, 122.0% for AGIs $100k-200k)
Ordinary dividends: $3,712 (reported on 22.5% of returns)
Here:
$3,712
State:
$9,061
(% of AGI for various income ranges: 13.1% for AGIs below $25k, 37.3% for AGIs $25k-50k, 211.2% for AGIs $50k-75k, 367.0% for AGIs $100k-200k)
Net capital gain/loss in AGI: +$5,262 (reported on 18.3% of returns)
Here:
+$5,262
State:
+$31,684
(% of AGI for various income ranges: 6.2% for AGIs below $25k, 20.0% for AGIs $25k-50k, 160.0% for AGIs $50k-75k, 526.0% for AGIs $100k-200k)
Profit/loss from business: +$15,800 (reported on 11.3% of returns)
Here:
+$15,800
State:
+$12,175
(% of AGI for various income ranges: 153.8% for AGIs below $25k, 200.0% for AGIs $50k-75k, 904.0% for AGIs $100k-200k)
Taxable individual retirement arrangement distribution: $15,610 (reported on 14.1% of returns)
61747:
$15,610
Illinois:
$21,613
(% of AGI for various income ranges: 237.3% for AGIs $25k-50k, 447.5% for AGIs $50k-75k, 942.0% for AGIs $100k-200k)
Total itemized deductions: $42,475 (reported on 5.6% of returns)
Here:
$42,475
State:
$34,948
(% of AGI for various income ranges: 624.5% for AGIs $25k-50k, 1012.0% for AGIs $100k-200k)
Charity contributions: $13,550 (reported on 5.6% of returns)
Here:
$13,550
State:
$13,122
(% of AGI for various income ranges: 542.0% for AGIs $100k-200k)
Taxes paid: $8,175 (reported on 5.6% of returns)
61747:
$8,175
State:
$8,563
(% of AGI for various income ranges: 109.1% for AGIs $25k-50k, 207.0% for AGIs $100k-200k)
Earned income credit: $2,400 (reported on 8.5% of returns)
Here:
$2,400
State:
$2,311
(% of AGI for various income ranges: 68.5% for AGIs below $25k, 50.0% for AGIs $25k-50k)
Percentage of individuals using paid preparers for their 2020 taxes: 93.0%
Here:
93%
State:
93%
(% for various income ranges: 90.0% for AGIs below $25k, 93.3% for AGIs $25k-50k, 91.7% for AGIs $50k-75k, 100.0% for AGIs $75k-100k, 106.7% for AGIs $100k-200k, 0.0% for AGIs over 200k)
Averages for the 2012 tax year for zip code 61747, filed in 2013:
Average Adjusted Gross Income (AGI) in 2012: $63,544 (Individual Income Tax Returns)
Here:
$63,544
State:
$68,058
Salary/wage: $51,112 (reported on 80.0% of returns)
Here:
$51,112
State:
$55,396
(% of AGI for various income ranges: 71.4% for AGIs below $25k, 70.3% for AGIs $25k-50k, 71.7% for AGIs $50k-75k, 70.6% for AGIs $75k-100k, 94.1% for AGIs $100k-200k)
Taxable interest for individuals: $800 (reported on 55.7% of returns)
This zip code:
$800
Illinois:
$1,969
(% of AGI for various income ranges: 1.3% for AGIs below $25k, 1.6% for AGIs $25k-50k, 0.6% for AGIs $50k-75k, 0.6% for AGIs $75k-100k, 0.4% for AGIs $100k-200k, 0.6% for AGIs over 200k)
Ordinary dividends: $2,333 (reported on 21.4% of returns)
Here:
$2,333
State:
$7,786
(% of AGI for various income ranges: 0.5% for AGIs below $25k, 1.4% for AGIs $25k-50k, 0.6% for AGIs $50k-75k, 0.6% for AGIs $75k-100k, 1.3% for AGIs $100k-200k)
Net capital gain/loss in AGI: +$2,770 (reported on 14.3% of returns)
Here:
+$2,770
State:
+$22,183
(% of AGI for various income ranges: 0.3% for AGIs below $25k, 0.7% for AGIs $50k-75k, 1.6% for AGIs $100k-200k)
Profit/loss from business: +$8,870 (reported on 14.3% of returns)
Here:
+$8,870
State:
+$12,903
(% of AGI for various income ranges: 5.9% for AGIs below $25k, 1.8% for AGIs $50k-75k, 4.3% for AGIs $100k-200k)
Taxable individual retirement arrangement distribution: $8,867 (reported on 12.9% of returns)
61747:
$8,867
Illinois:
$17,929
(% of AGI for various income ranges: 6.6% for AGIs below $25k, 1.4% for AGIs $50k-75k, 7.6% for AGIs $75k-100k)
Total itemized deductions: $19,262 (18% of AGI, reported on 37.1% of returns)
Here:
$19,262
State:
$26,433
Here:
17.9% of AGI
State:
19.2% of AGI
(% of AGI for various income ranges: 16.9% for AGIs $25k-50k, 10.4% for AGIs $50k-75k, 11.1% for AGIs $75k-100k, 19.0% for AGIs $100k-200k)
Charity contributions: $4,781 (reported on 30.0% of returns)
Here:
$4,781
State:
$4,525
(% of AGI for various income ranges: 2.4% for AGIs $25k-50k, 1.9% for AGIs $50k-75k, 1.6% for AGIs $75k-100k, 4.6% for AGIs $100k-200k)
Taxes paid: $7,562 (reported on 37.1% of returns)
61747:
$7,562
State:
$11,968
(% of AGI for various income ranges: 4.1% for AGIs $25k-50k, 3.6% for AGIs $50k-75k, 4.6% for AGIs $75k-100k, 8.5% for AGIs $100k-200k)
Earned income credit: $2,000 (reported on 10.0% of returns)
Here:
$2,000
State:
$2,349
(% of AGI for various income ranges: 3.3% for AGIs below $25k, 1.0% for AGIs $25k-50k)
Percentage of individuals using paid preparers for their 2012 taxes: 58.6%
Here:
59%
State:
57%
(% for various income ranges: 47.8% for AGIs below $25k, 57.1% for AGIs $25k-50k, 66.7% for AGIs $50k-75k, 62.5% for AGIs $75k-100k, 81.8% for AGIs $100k-200k)
Averages for the 2004 tax year for zip code 61747, filed in 2005:
Average Adjusted Gross Income (AGI) in 2004: $46,337 (Individual Income Tax Returns)
Here:
$46,337
State:
$54,625
Salary/wage: $40,306 (reported on 82.6% of returns)
Here:
$40,306
State:
$46,811
(% of AGI for various income ranges: 76.5% for AGIs below $10k, 63.3% for AGIs $10k-25k, 71.4% for AGIs $25k-50k, 85.6% for AGIs $50k-75k, 80.4% for AGIs $75k-100k, 57.5% for AGIs over 100k)
Taxable interest for individuals: $2,076 (reported on 57.4% of returns)
This zip code:
$2,076
Illinois:
$2,101
(% of AGI for various income ranges: 10.3% for AGIs below $10k, 6.6% for AGIs $10k-25k, 2.7% for AGIs $25k-50k, 1.8% for AGIs $50k-75k, 0.9% for AGIs $75k-100k, 2.7% for AGIs over 100k)
Taxable dividends: $1,226 (reported on 22.6% of returns)
Here:
$1,226
State:
$4,306
(% of AGI for various income ranges: 6.3% for AGIs below $10k, 0.6% for AGIs $10k-25k, 0.8% for AGIs $25k-50k, 0.3% for AGIs $50k-75k, 0.2% for AGIs $75k-100k, 0.6% for AGIs over 100k)
Net capital gain/loss: +$6,979 (reported on 14.0% of returns)
Here:
+$6,979
State:
+$17,321
(% of AGI for various income ranges: 1.7% for AGIs below $10k, -0.6% for AGIs $10k-25k, -0.3% for AGIs $25k-50k, -0.1% for AGIs $50k-75k, 0.3% for AGIs $75k-100k, 7.3% for AGIs over 100k)
Profit/loss from business: +$6,732 (reported on 14.2% of returns)
Here:
+$6,732
State:
+$11,771
(% of AGI for various income ranges: 4.5% for AGIs below $10k, 2.7% for AGIs $10k-25k, 0.7% for AGIs $25k-50k, 0.8% for AGIs $50k-75k, 1.6% for AGIs $75k-100k, 3.9% for AGIs over 100k)
Profit/loss from farming: +$16,773 (reported on 6.4% of returns)
Here:
+$16,773
State:
+$2,327
IRA payment deduction: $2,364 (reported on 1.6% of returns)
61747:
$2,364
Illinois:
$3,087
Total itemized deductions: $16,500 (22% of AGI, reported on 30.9% of returns)
Here:
$16,500
State:
$20,239
Here:
22.2% of AGI
State:
19.5% of AGI
(% of AGI for various income ranges: 19.7% for AGIs $10k-25k, 11.8% for AGIs $25k-50k, 11.9% for AGIs $50k-75k, 9.8% for AGIs $75k-100k, 9.1% for AGIs over 100k)
Charity contributions deductions: $3,489 (4% of AGI, reported on 26.6% of returns)
Here:
$3,489
State:
$3,719
Here:
4.4% of AGI
State:
3.4% of AGI
(% of AGI for various income ranges: 4.9% for AGIs below $10k, 1.7% for AGIs $25k-50k, 1.6% for AGIs $50k-75k, 2.0% for AGIs $75k-100k, 2.8% for AGIs over 100k)
Total tax: $6,793 (reported on 76.4% of returns)
61747:
$6,793
State:
$9,882
(% of AGI for various income ranges: 2.6% for AGIs below $10k, 3.9% for AGIs $10k-25k, 6.6% for AGIs $25k-50k, 7.9% for AGIs $50k-75k, 10.6% for AGIs $75k-100k, 19.5% for AGIs over 100k)
Earned income credit: $1,649 (reported on 10.8% of returns)
Here:
$1,649
State:
$1,788
Percentage of individuals using paid preparers for their 2004 taxes: 61.9%
Here:
62%
State:
61%
(% for various income ranges: 51.1% for AGIs below $10k, 53.4% for AGIs $10k-25k, 70.3% for AGIs $25k-50k, 63.7% for AGIs $50k-75k, 76.1% for AGIs $75k-100k, 63.2% for AGIs over 100k)
Likely homosexual households (counted as self-reported same-sex unmarried-partner households)
Lesbian couples: 0.0% of all households
Gay men: 0.5% of all households
Household received Food Stamps/SNAP in the past 12 months: 17 Household did not receive Food Stamps/SNAP in the past 12 months: 571
Women who had a birth in the past 12 months: 44 (44 now married, 0 unmarried) Women who did not have a birth in the past 12 months: 206 (92 now married, 114 unmarried)
Housing units in zip code 61747 with a mortgage: 331 (10 second mortgage, 8 both second mortgage and home equity loan) Houses without a mortgage: 3
Median monthly owner costs for units with a mortgage: $1,789 Median monthly owner costs for units without a mortgage: $611
Residents with income below the poverty level in 2022:
This zip code:
5.1%
Whole state:
11.9%
Residents with income below 50% of the poverty level in 2022:
This zip code:
4.0%
Whole state:
5.7%
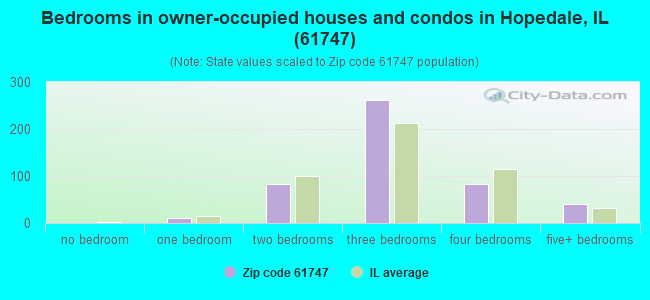
Median number of rooms in houses and condos:
Here:
6.6
State:
6.4
Median number of rooms in apartments:
Here:
4.3
State:
4.1
Notable locations in this zip code not listed on our city pages
199 married couples with children.
37 single-parent households (4 men, 33 women).
96.3% of residents of 61747 zip code speak English at home.
0.2% of residents speak Spanish at home (100% very well).
1.7% of residents speak other Indo-European language at home (100% very well).
1.2% of residents speak other language at home (100% not well).
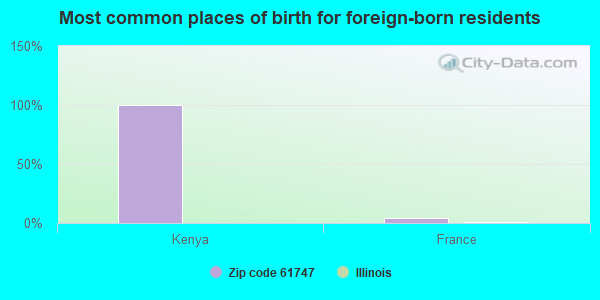
Foreign born population: 22 (1.6%) (0.0% of them are naturalized citizens)
:
1.6%
Whole state:
14.4%
100%Kenya
4%France
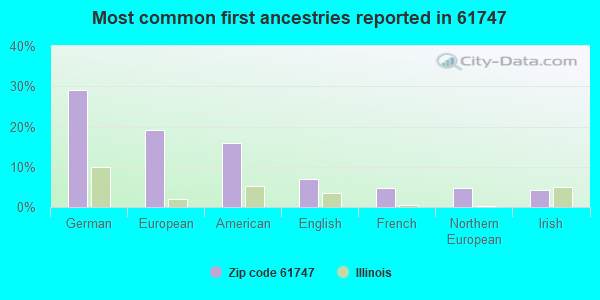
29%German
19%European
16%American
7%English
5%French
5%Northern European
4%Irish
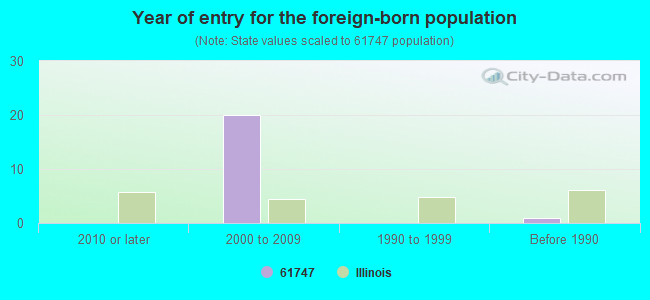
Year of entry for the foreign-born population
02010 or later
202000 to 2009
01990 to 1999
1Before 1990
Major facilities with environmental interests located in this zip code:
INDIAN CREEK LANDFILL 1 (R R #1 in HOPEDALE, IL)
STATE MASTER (Illinois EPA Project) - SOLID WASTE PROGRAM, HAZARDOUS WASTE PROGRAM, AIR PROGRAM STATE MASTER (Illinois EPA Project) - National Pollutant Discharge Elimination System Permit, AIR MINOR (AIRS/AFS) CRITERIA AND HAZARDOUS AIR POLLUTANT INVENTORY (Inventory of air pollution sources) National Pollutant Discharge Elimination System NON-MAJOR (Tracking pollutant discharge elimination systems) - permit National Pollutant Discharge Elimination System NON-MAJOR (Tracking pollutant discharge elimination systems) - permit TRANSPORTER (Resource Conservation and Recovery Act (tracking hazardous waste)) Business SIC classification: REFUSE SYSTEMS Business NAICS classification: SOLID WASTE LANDFILL. Organizations: AMERICAN FLY ASH COMPANY (CONTACT/OWNER)
, MINERAL SOLUTIONS INC (CONTACT/OWNER)
Alternative names: MINERAL SOLUTIONS
HOPEDALE STP (WEST WALNUT STREET in HOPEDALE, IL)
STATE MASTER (Illinois EPA Project) - National Pollutant Discharge Elimination System Permit National Pollutant Discharge Elimination System NON-MAJOR (Tracking pollutant discharge elimination systems) - permit National Pollutant Discharge Elimination System NON-MAJOR (Tracking pollutant discharge elimination systems) - permit Business SIC classification: SEWERAGE SYSTEMS Alternative names: HOPEDALE STP, VILLAGE OF, HOPEDALE, VILLAGE OF
AG LAND FS INC (RURAL ROUTE in HOPEDALE, IL)
STATE MASTER (Illinois EPA Project) - SOLID WASTE PROGRAM, AIR PROGRAM AIR MINOR (AIRS/AFS) CRITERIA AND HAZARDOUS AIR POLLUTANT INVENTORY (Inventory of air pollution sources) Business SIC classification: PETROLEUM BULK STATIONS AND TERMINALS
RA CULLINAN & SON INC (2 1/4 MILES N AND W OF HOPEDALE in HOPEDALE, IL)
STATE MASTER (Illinois EPA Project) - AIR PROGRAM AIR MINOR (AIRS/AFS) CRITERIA AND HAZARDOUS AIR POLLUTANT INVENTORY (Inventory of air pollution sources) Business SIC classification: CONSTRUCTION SAND AND GRAVEL Alternative names: R.A. CULLINAN & SONS INC.
IDOT (6923 PRAIRIE RD in HOPEDALE, IL)
STATE MASTER (Illinois EPA Project) - HAZARDOUS WASTE PROGRAM Conditionally Exempt Small Quantity Generators, less than 100 kg/month of hazardous waste (Resource Conservation and Recovery Act (tracking hazardous waste))
INDIAN CREEK LANDFILL #2 (2401 W MCMULLEN RD in HOPEDALE, IL)
STATE MASTER (Illinois EPA Project) - AIR PROGRAM AIR MINOR (AIRS/AFS) Business SIC classification: REFUSE SYSTEMS
DALES RED FOX (102-2ND ST in HOPEDALE, IL)
STATE MASTER (Illinois EPA Project) - AIR PROGRAM AIR MINOR (AIRS/AFS) Business SIC classification: GROCERY STORES
AMERICAN FLY ASH (R R 1 BOX 87 in HOPEDALE, IL)
STATE MASTER (Illinois EPA Project) - HAZARDOUS WASTE PROGRAM Small Quantity Generators, between 100 kg and 1000 kg of hazardous waste/month (Resource Conservation and Recovery Act (tracking hazardous waste)) - notification
CULLINAN & SON, INC.?R. A. (R.R. HOPEDALE TWP. - .5 MI. N. in HOPEDALE, IL)
National Pollutant Discharge Elimination System NON-MAJOR (Tracking pollutant discharge elimination systems) - permit National Pollutant Discharge Elimination System NON-MAJOR (Tracking pollutant discharge elimination systems) - permit Organizations: CULLINAN & SON, INC.?R.S. (CONTACT/OWNER)
Alternative names: CULLINAN & SON, INC.?R.S., CULLINAN, R.A. & SON, INC.
R A CULLINAN & SON INC (ILL RT 121 in HOPEDALE, IL)
STATE MASTER (Illinois EPA Project) - AIR PROGRAM AIR SYNTHETIC MINOR (AIRS/AFS) CRITERIA AND HAZARDOUS AIR POLLUTANT INVENTORY (Inventory of air pollution sources) Business SIC classification: ASPHALT PAVING MIXTURES AND BLOCKS Business NAICS classification: ASPHALT PAVING MIXTURE AND BLOCK MANUFACTURING. Alternative names: R.A. CULLINAN AND SONS, INC.
HOPEDALE ELEM SCHOOL (BOX 297 in HOPEDALE, IL)
(National Center for Education Statistics) - STATE ID-1706401602004 Organizations: OLYMPIA C U SCHOOL DIST 16 (SCHOOL DISTRICT)
HOPEDALE MEDICAL COMPLEX (RAILROAD STREET in HOPEDALE, IL)
AIR MINOR (AIRS/AFS) CRITERIA AND HAZARDOUS AIR POLLUTANT INVENTORY (Inventory of air pollution sources) Business SIC and NAICS classification: GENERAL MEDICAL AND SURGICAL HOSPITALS
ILDOT BRG 090 0092 (I 155 OVER MACKINAW RIVER in HOPEDALE, IL)
Large Quantity Generators, more that 1000 kg of hazardous waste/month (Resource Conservation and Recovery Act (tracking hazardous waste)) - notification
Housing units lacking complete plumbing facilities: 0.8% Housing units lacking complete kitchen facilities: 9.2%
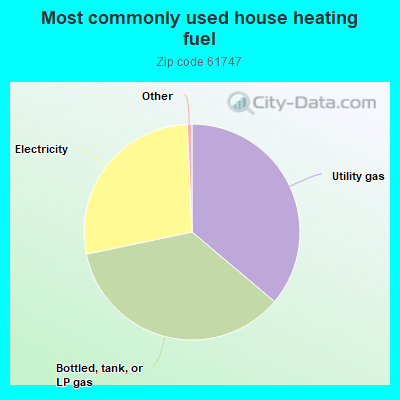
36.3%Utility gas
35.7%Bottled, tank, or LP gas
27.7%Electricity
Population in 1990: 1,355. Population change in the 1990s: +117 (+8.6%).
Place of birth for U.S.-born residents:
This state: 1,232
Midwest: 102
South: 45
West: 19
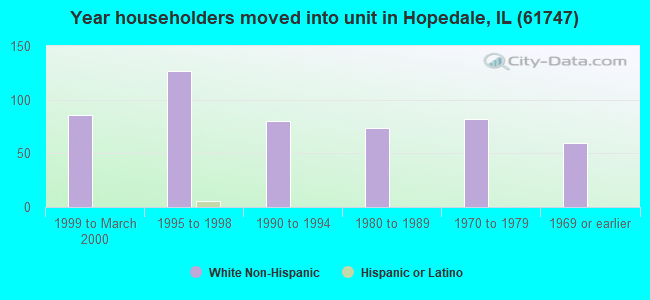
57% of the 61747 zip code residents lived in the same house 5 years ago. Out of people who lived in different houses, 60% lived in this county. Out of people who lived in different counties, 50% lived in Illinois.
91% of the 61747 zip code residents lived in the same house 1 year ago. Out of people who lived in different houses, 57% moved from this county. Out of people who lived in different houses, 28% moved from different county within same state. Out of people who lived in different houses, 13% moved from different state.
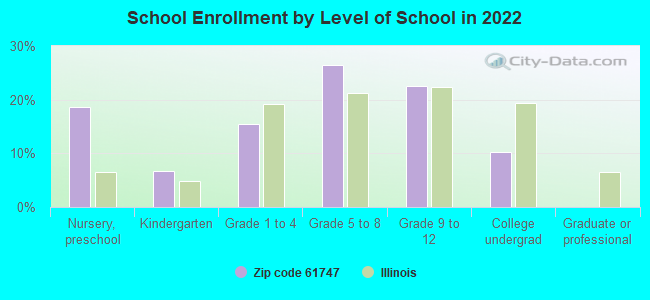
Private vs. public school enrollment:
Students in private schools in grades 1 to 8 (elementary and middle school): 20
Here:
21.6%
Illinois:
13.3%
Students in private schools in grades 9 to 12 (high school):
Here:
0.0%
Illinois:
9.9%
Students in private undergraduate colleges: 7
Here:
33.5%
Illinois:
27.4%
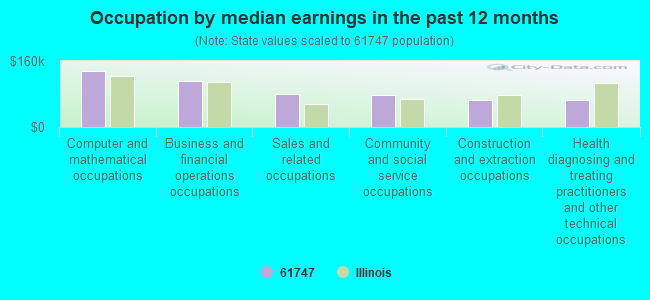
Occupation by median earnings in the past 12 months ($)
135,519Computer and mathematical occupations
112,297Business and financial operations occupations
80,617Sales and related occupations
78,339Community and social service occupations
66,444Construction and extraction occupations
65,956Health diagnosing and treating practitioners and other technical occupations
Top industries in this zip code by the number of employees in 2005:
Health Care and Social Assistance: General Medical and Surgical Hospitals (250-499 employees: 1 establishment)
Construction: Commercial and Institutional Building Construction (20-49: 1, 5-9: 1)
Construction: Site Preparation Contractors (20-49: 1)
Construction: Water and Sewer Line and Related Structures Construction (10-19: 1)
Other Services (except Public Administration): Religious Organizations (5-9: 1, 1-4: 3)
Administrative and Support and Waste Management and Remediation Services: Solid Waste Landfill (5-9: 1)
Construction: Electrical Contractors (5-9: 1)
Accommodation and Food Services: Full-Service Restaurants (5-9: 1)
People in group quarters in 2010:
51 people in nursing facilities/skilled-nursing facilities
People in group quarters in 2000:
98 people in wards in general hospitals for patients who have no usual home elsewhere
19 people in nursing homes
2 people in hospitals or wards for drug/alcohol abuse
Home Mortgage Disclosure Act Aggregated Statistics For Year 2009 (Based on 2 partial tracts)
A) FHA, FSA/RHS & VA Home Purchase Loans
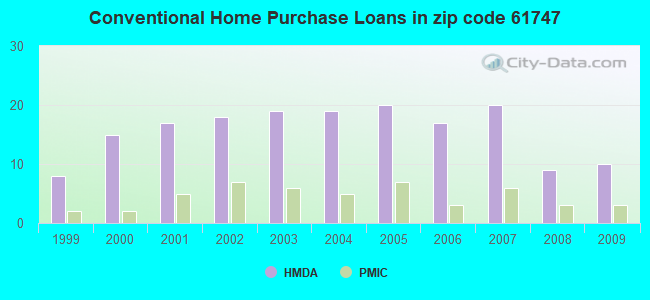
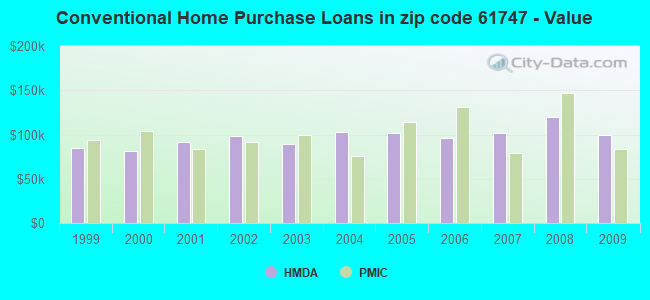
B) Conventional Home Purchase Loans
C) Refinancings
D) Home Improvement Loans
E) Loans on Dwellings For 5+ Families
F) Non-occupant Loans on < 5 Family Dwellings (A B C & D)
Number
Average Value
Number
Average Value
Number
Average Value
Number
Average Value
Number
Average Value
Number
Average Value
LOANS ORIGINATED
7
$122,893
10
$99,021
38
$131,544
6
$98,543
1
$89,540
2
$96,905
APPLICATIONS APPROVED, NOT ACCEPTED
0
$0
0
$0
4
$146,680
0
$0
0
$0
0
$0
APPLICATIONS DENIED
1
$74,050
4
$71,688
7
$146,047
3
$41,683
0
$0
1
$36,270
APPLICATIONS WITHDRAWN
1
$61,580
1
$153,760
6
$114,915
0
$0
0
$0
0
$0
FILES CLOSED FOR INCOMPLETENESS
1
$65,360
0
$0
2
$85,950
0
$0
0
$0
0
$0
Aggregated Statistics For Year 2008 (Based on 2 partial tracts)
A) FHA, FSA/RHS & VA Home Purchase Loans
B) Conventional Home Purchase Loans
C) Refinancings
D) Home Improvement Loans
F) Non-occupant Loans on < 5 Family Dwellings (A B C & D)
Number
Average Value
Number
Average Value
Number
Average Value
Number
Average Value
Number
Average Value
LOANS ORIGINATED
6
$87,965
9
$119,511
26
$112,890
3
$76,567
3
$92,687
APPLICATIONS APPROVED, NOT ACCEPTED
0
$0
1
$131,850
1
$97,090
1
$30,220
0
$0
APPLICATIONS DENIED
0
$0
3
$88,280
11
$105,955
3
$75,687
0
$0
APPLICATIONS WITHDRAWN
0
$0
0
$0
4
$100,400
0
$0
0
$0
FILES CLOSED FOR INCOMPLETENESS
0
$0
0
$0
2
$103,330
0
$0
0
$0
Aggregated Statistics For Year 2007 (Based on 2 partial tracts)
A) FHA, FSA/RHS & VA Home Purchase Loans
B) Conventional Home Purchase Loans
C) Refinancings
D) Home Improvement Loans
F) Non-occupant Loans on < 5 Family Dwellings (A B C & D)
Number
Average Value
Number
Average Value
Number
Average Value
Number
Average Value
Number
Average Value
LOANS ORIGINATED
2
$98,040
20
$101,496
21
$108,482
5
$50,248
4
$102,385
APPLICATIONS APPROVED, NOT ACCEPTED
0
$0
1
$60,450
3
$99,613
1
$8,310
0
$0
APPLICATIONS DENIED
1
$107,670
5
$73,746
11
$105,475
2
$41,935
0
$0
APPLICATIONS WITHDRAWN
0
$0
1
$69,140
3
$114,473
2
$36,835
0
$0
FILES CLOSED FOR INCOMPLETENESS
0
$0
0
$0
0
$0
0
$0
0
$0
Aggregated Statistics For Year 2006 (Based on 2 partial tracts)
A) FHA, FSA/RHS & VA Home Purchase Loans
B) Conventional Home Purchase Loans
C) Refinancings
D) Home Improvement Loans
F) Non-occupant Loans on < 5 Family Dwellings (A B C & D)
Number
Average Value
Number
Average Value
Number
Average Value
Number
Average Value
Number
Average Value
LOANS ORIGINATED
5
$88,178
17
$95,939
23
$82,656
7
$50,896
3
$107,420
APPLICATIONS APPROVED, NOT ACCEPTED
0
$0
2
$48,360
3
$86,263
1
$17,380
0
$0
APPLICATIONS DENIED
0
$0
3
$73,040
12
$93,159
4
$22,668
1
$42,310
APPLICATIONS WITHDRAWN
0
$0
0
$0
7
$109,886
1
$118,630
0
$0
FILES CLOSED FOR INCOMPLETENESS
0
$0
0
$0
4
$107,200
0
$0
0
$0
Aggregated Statistics For Year 2005 (Based on 2 partial tracts)
A) FHA, FSA/RHS & VA Home Purchase Loans
B) Conventional Home Purchase Loans
C) Refinancings
D) Home Improvement Loans
F) Non-occupant Loans on < 5 Family Dwellings (A B C & D)
G) Loans On Manufactured Home Dwelling (A B C & D)
Number
Average Value
Number
Average Value
Number
Average Value
Number
Average Value
Number
Average Value
Number
Average Value
LOANS ORIGINATED
2
$92,370
20
$101,874
25
$110,998
2
$45,905
5
$122,634
1
$69,140
APPLICATIONS APPROVED, NOT ACCEPTED
0
$0
2
$76,315
3
$97,347
0
$0
0
$0
0
$0
APPLICATIONS DENIED
1
$77,830
3
$51,760
12
$105,721
6
$51,067
0
$0
1
$28,340
APPLICATIONS WITHDRAWN
0
$0
3
$74,173
9
$129,963
1
$108,430
1
$55,910
0
$0
FILES CLOSED FOR INCOMPLETENESS
0
$0
0
$0
2
$100,875
0
$0
0
$0
0
$0
Aggregated Statistics For Year 2004 (Based on 2 partial tracts)
A) FHA, FSA/RHS & VA Home Purchase Loans
B) Conventional Home Purchase Loans
C) Refinancings
D) Home Improvement Loans
F) Non-occupant Loans on < 5 Family Dwellings (A B C & D)
G) Loans On Manufactured Home Dwelling (A B C & D)
Number
Average Value
Number
Average Value
Number
Average Value
Number
Average Value
Number
Average Value
Number
Average Value
LOANS ORIGINATED
2
$80,095
19
$102,941
31
$93,695
4
$32,680
4
$82,455
0
$0
APPLICATIONS APPROVED, NOT ACCEPTED
0
$0
2
$64,415
6
$114,788
0
$0
0
$0
0
$0
APPLICATIONS DENIED
1
$69,520
3
$66,743
18
$99,257
2
$26,255
0
$0
1
$7,560
APPLICATIONS WITHDRAWN
0
$0
3
$75,057
10
$94,903
1
$60,450
0
$0
0
$0
FILES CLOSED FOR INCOMPLETENESS
0
$0
0
$0
1
$106,920
0
$0
0
$0
0
$0
Aggregated Statistics For Year 2003 (Based on 2 partial tracts)
A) FHA, FSA/RHS & VA Home Purchase Loans
B) Conventional Home Purchase Loans
C) Refinancings
D) Home Improvement Loans
F) Non-occupant Loans on < 5 Family Dwellings (A B C & D)
Number
Average Value
Number
Average Value
Number
Average Value
Number
Average Value
Number
Average Value
LOANS ORIGINATED
5
$91,276
19
$89,221
81
$95,304
3
$34,507
7
$65,467
APPLICATIONS APPROVED, NOT ACCEPTED
0
$0
0
$0
5
$73,294
0
$0
0
$0
APPLICATIONS DENIED
0
$0
3
$78,833
20
$98,908
2
$3,965
0
$0
APPLICATIONS WITHDRAWN
0
$0
1
$126,190
12
$102,919
1
$14,730
0
$0
FILES CLOSED FOR INCOMPLETENESS
0
$0
1
$47,980
1
$125,050
0
$0
0
$0
Aggregated Statistics For Year 2002 (Based on 2 partial tracts)
A) FHA, FSA/RHS & VA Home Purchase Loans
B) Conventional Home Purchase Loans
C) Refinancings
D) Home Improvement Loans
F) Non-occupant Loans on < 5 Family Dwellings (A B C & D)
Number
Average Value
Number
Average Value
Number
Average Value
Number
Average Value
Number
Average Value
LOANS ORIGINATED
4
$75,278
18
$98,333
65
$88,917
5
$9,898
6
$81,730
APPLICATIONS APPROVED, NOT ACCEPTED
0
$0
0
$0
5
$96,112
1
$23,050
0
$0
APPLICATIONS DENIED
0
$0
3
$57,677
18
$62,778
2
$6,235
1
$51,380
APPLICATIONS WITHDRAWN
0
$0
1
$121,650
5
$141,222
1
$41,180
0
$0
FILES CLOSED FOR INCOMPLETENESS
0
$0
0
$0
1
$81,600
0
$0
0
$0
Aggregated Statistics For Year 2001 (Based on 2 partial tracts)
A) FHA, FSA/RHS & VA Home Purchase Loans
B) Conventional Home Purchase Loans
C) Refinancings
D) Home Improvement Loans
F) Non-occupant Loans on < 5 Family Dwellings (A B C & D)
Number
Average Value
Number
Average Value
Number
Average Value
Number
Average Value
Number
Average Value
LOANS ORIGINATED
5
$70,196
17
$91,983
38
$76,385
8
$18,370
2
$72,160
APPLICATIONS APPROVED, NOT ACCEPTED
1
$67,250
0
$0
5
$54,478
1
$11,710
0
$0
APPLICATIONS DENIED
0
$0
3
$77,700
12
$80,629
2
$7,745
1
$18,130
APPLICATIONS WITHDRAWN
0
$0
2
$101,440
6
$60,322
0
$0
0
$0
FILES CLOSED FOR INCOMPLETENESS
0
$0
0
$0
1
$67,250
0
$0
0
$0
Aggregated Statistics For Year 2000 (Based on 2 partial tracts)
A) FHA, FSA/RHS & VA Home Purchase Loans
B) Conventional Home Purchase Loans
C) Refinancings
D) Home Improvement Loans
F) Non-occupant Loans on < 5 Family Dwellings (A B C & D)
Number
Average Value
Number
Average Value
Number
Average Value
Number
Average Value
Number
Average Value
LOANS ORIGINATED
2
$67,435
15
$81,579
19
$67,427
7
$16,623
3
$80,850
APPLICATIONS APPROVED, NOT ACCEPTED
0
$0
1
$47,230
3
$53,270
3
$14,733
0
$0
APPLICATIONS DENIED
0
$0
2
$64,980
8
$49,728
6
$11,587
0
$0
APPLICATIONS WITHDRAWN
0
$0
1
$54,030
3
$59,943
0
$0
0
$0
FILES CLOSED FOR INCOMPLETENESS
0
$0
0
$0
2
$77,825
0
$0
0
$0
Aggregated Statistics For Year 1999 (Based on 1 partial tract)
Detailed PMIC statistics for the following Tracts:0220.00
2002 - 2018 National Fire Incident Reporting System (NFIRS) incidents
Based on the data from the years 2002 - 2018 the average number of fires per year is 9. The highest number of fires - 17 took place in 2011, and the least - 1 in 2005. The data has a declining trend.
When looking into fire subcategories, the most incidents belonged to: Outside Fires (59.6%), and Structure Fires (19.3%).
Fire incident types reported to NFIRS in Zip Code 61747

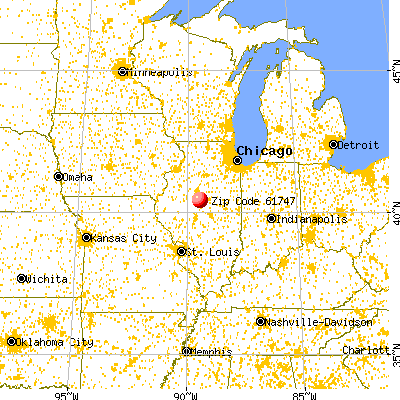


 Nearest zip codes: 61734, 61759, 61568, 62635, 61721, 61755.


 Based on the data from the years 2002 - 2018 the average number of fires per year is 9. The highest number of fires - 17 took place in 2011, and the least - 1 in 2005. The data has a declining trend.
 When looking into fire subcategories, the most incidents belonged to: Outside Fires (59.6%), and Structure Fires (19.3%).