Estimated zip code population in 2022: 2,225 Zip code population in 2010: 2,544 Zip code population in 2000: 2,691
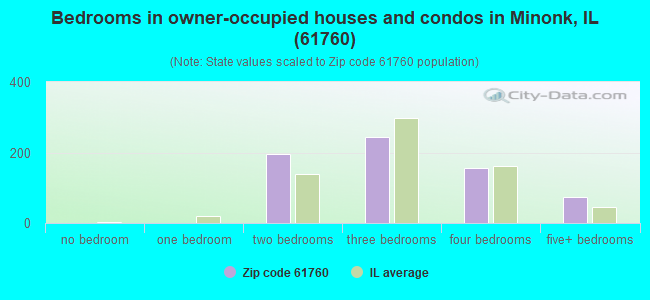
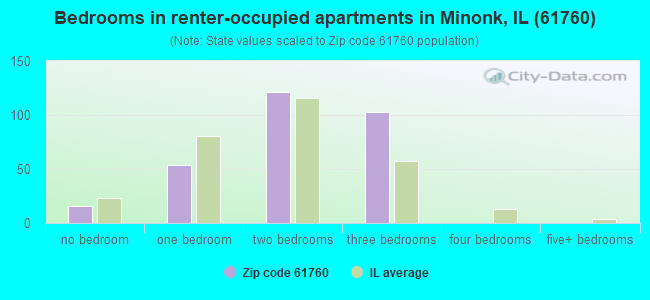
Houses and condos: 1,062 Renter-occupied apartments: 297
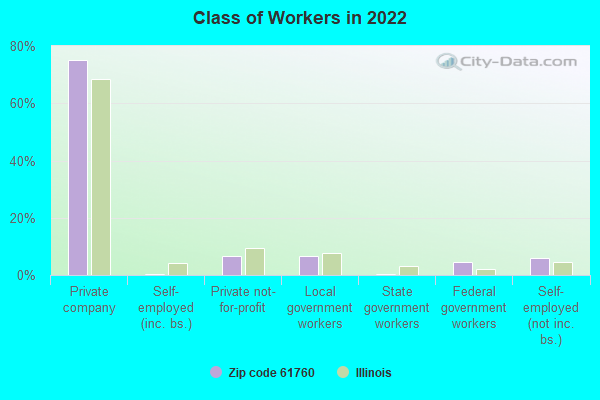
% of renters here:
31%
State:
33%
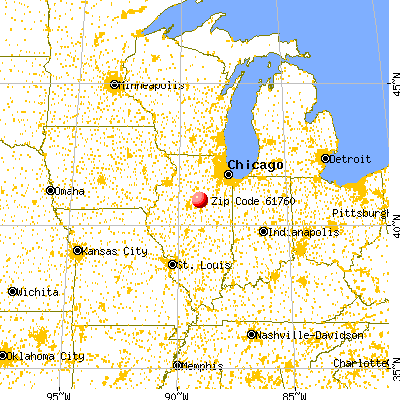
March 2022 cost of living index in zip code 61760: 85.2 (less than average, U.S. average is 100)
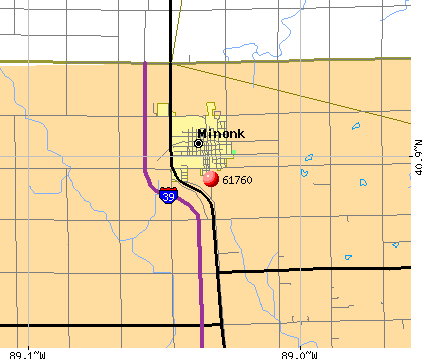
Land area: 73.1 sq. mi. Water area: 0.1 sq. mi.
Population density: 30 people per square mile
(very low).
OSM Map
General Map
Google Map
MSN Map
OSM Map
General Map
Google Map
MSN Map
OSM Map
General Map
Google Map
MSN Map
OSM Map
General Map
Google Map
MSN Map
Please wait while loading the map...
Real estate property taxes paid for housing units in 2022:
This zip code:
1.9% ($2,434)
Illinois:
2.0% ($4,912)
Median real estate property taxes paid for housing units with mortgages in 2022: $2,428 (2.0%) Median real estate property taxes paid for housing units with no mortgage in 2022: $2,372 (1.8%)
Business Search- 14 Million verified businesses
Males: 1,231
(55.3%)
Females: 994
(44.7%)
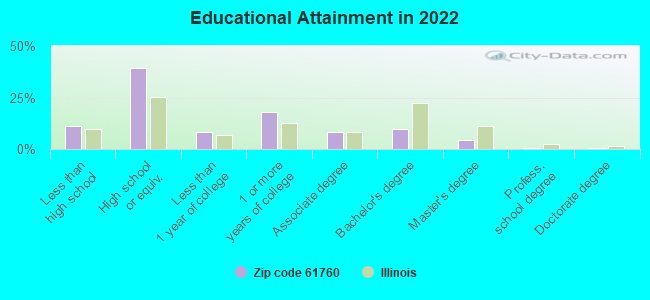
For population 25 years and over in 61760:
High school or higher: 87.5%
Bachelor's degree or higher: 14.7%
Graduate or professional degree: 5.2%
Unemployed: 5.7%
Mean travel time to work (commute): 20.9 minutes
For population 15 years and over in 61760:
Never married: 31.0%
Now married: 51.4%
Separated: 0.8%
Widowed: 6.9%
Divorced: 9.9%
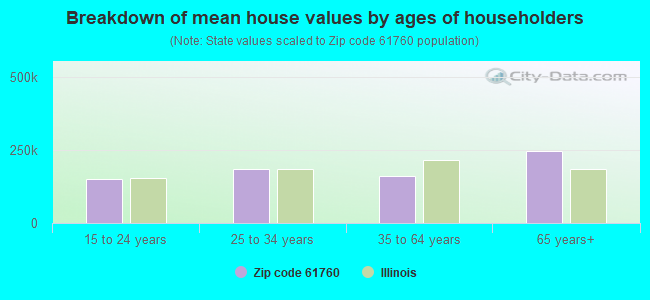
Zip code 61760 compared to state average:
Median house value below state average.
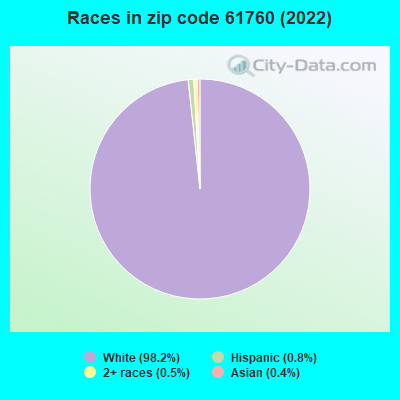
Black race population percentage significantly below state average.
Hispanic race population percentage significantly below state average.
Foreign-born population percentage significantly below state average.
Length of stay since moving in significantly above state average.
Number of college students below state average.
Percentage of population with a bachelor's degree or higher significantly below state average.
Averages for the 2020 tax year for zip code 61760, filed in 2021:
Average Adjusted Gross Income (AGI) in 2020: $65,419 (Individual Income Tax Returns)
Here:
$65,419
State:
$82,626
Salary/wage: $50,644 (reported on 83.8% of returns)
Here:
$50,644
State:
$66,640
(% of AGI for various income ranges: 1113.6% for AGIs below $25k, 3592.9% for AGIs $25k-50k, 7343.6% for AGIs $50k-75k, 8585.0% for AGIs $75k-100k, 16474.0% for AGIs $100k-200k)
Taxable interest for individuals: $1,191 (reported on 46.2% of returns)
This zip code:
$1,191
Illinois:
$2,376
(% of AGI for various income ranges: 31.8% for AGIs below $25k, 19.6% for AGIs $25k-50k, 87.3% for AGIs $50k-75k, 124.0% for AGIs $75k-100k, 247.0% for AGIs $100k-200k)
Ordinary dividends: $2,845 (reported on 18.8% of returns)
Here:
$2,845
State:
$9,061
(% of AGI for various income ranges: 10.5% for AGIs below $25k, 12.5% for AGIs $25k-50k, 53.6% for AGIs $50k-75k, 136.0% for AGIs $75k-100k, 378.0% for AGIs $100k-200k)
Net capital gain/loss in AGI: +$6,744 (reported on 15.4% of returns)
Here:
+$6,744
State:
+$31,684
(% of AGI for various income ranges: 8.3% for AGIs $25k-50k, 30.9% for AGIs $50k-75k, 62.0% for AGIs $75k-100k, 1098.0% for AGIs $100k-200k)
Profit/loss from business: +$9,662 (reported on 11.1% of returns)
Here:
+$9,662
State:
+$12,175
(% of AGI for various income ranges: 90.9% for AGIs below $25k, 159.2% for AGIs $25k-50k, 248.0% for AGIs $75k-100k, 426.0% for AGIs $100k-200k)
Taxable individual retirement arrangement distribution: $15,929 (reported on 12.0% of returns)
61760:
$15,929
Illinois:
$21,613
(% of AGI for various income ranges: 73.6% for AGIs below $25k, 87.1% for AGIs $25k-50k, 354.5% for AGIs $50k-75k, 225.0% for AGIs $75k-100k, 1244.0% for AGIs $100k-200k)
Total itemized deductions: $39,633 (reported on 2.6% of returns)
Here:
$39,633
State:
$34,948
(% of AGI for various income ranges: 1189.0% for AGIs $75k-100k)
Charity contributions: $7,550 (reported on 1.7% of returns)
Here:
$7,550
State:
$13,122
(% of AGI for various income ranges: 137.3% for AGIs $50k-75k)
Taxes paid: $6,867 (reported on 2.6% of returns)
61760:
$6,867
State:
$8,563
(% of AGI for various income ranges: 206.0% for AGIs $75k-100k)
Earned income credit: $2,293 (reported on 12.0% of returns)
Here:
$2,293
State:
$2,311
(% of AGI for various income ranges: 86.4% for AGIs below $25k, 54.6% for AGIs $25k-50k)
Percentage of individuals using paid preparers for their 2020 taxes: 94.9%
Here:
95%
State:
93%
(% for various income ranges: 90.3% for AGIs below $25k, 96.7% for AGIs $25k-50k, 94.4% for AGIs $50k-75k, 93.3% for AGIs $75k-100k, 100.0% for AGIs $100k-200k, 100.0% for AGIs over 200k)
Averages for the 2012 tax year for zip code 61760, filed in 2013:
Average Adjusted Gross Income (AGI) in 2012: $57,954 (Individual Income Tax Returns)
Here:
$57,954
State:
$68,058
Salary/wage: $42,899 (reported on 84.0% of returns)
Here:
$42,899
State:
$55,396
(% of AGI for various income ranges: 70.8% for AGIs below $25k, 75.3% for AGIs $25k-50k, 75.0% for AGIs $50k-75k, 66.1% for AGIs $75k-100k, 67.3% for AGIs $100k-200k, 17.9% for AGIs over 200k)
Taxable interest for individuals: $964 (reported on 48.7% of returns)
This zip code:
$964
Illinois:
$1,969
(% of AGI for various income ranges: 1.6% for AGIs below $25k, 1.1% for AGIs $25k-50k, 0.7% for AGIs $50k-75k, 0.7% for AGIs $75k-100k, 0.8% for AGIs $100k-200k, 0.3% for AGIs over 200k)
Ordinary dividends: $2,338 (reported on 21.8% of returns)
Here:
$2,338
State:
$7,786
(% of AGI for various income ranges: 1.2% for AGIs below $25k, 1.2% for AGIs $25k-50k, 0.4% for AGIs $50k-75k, 0.4% for AGIs $75k-100k, 1.7% for AGIs $100k-200k)
Net capital gain/loss in AGI: +$2,207 (reported on 11.8% of returns)
Here:
+$2,207
State:
+$22,183
(% of AGI for various income ranges: 0.4% for AGIs $75k-100k, 1.5% for AGIs $100k-200k)
Profit/loss from business: +$11,208 (reported on 10.1% of returns)
Here:
+$11,208
State:
+$12,903
(% of AGI for various income ranges: 3.1% for AGIs below $25k, 1.9% for AGIs $25k-50k, 0.7% for AGIs $50k-75k, 3.7% for AGIs $75k-100k, 2.5% for AGIs $100k-200k)
Taxable individual retirement arrangement distribution: $8,946 (reported on 10.9% of returns)
61760:
$8,946
Illinois:
$17,929
(% of AGI for various income ranges: 4.0% for AGIs below $25k, 1.6% for AGIs $25k-50k, 1.5% for AGIs $50k-75k, 4.9% for AGIs $75k-100k)
Total itemized deductions: $17,706 (17% of AGI, reported on 27.7% of returns)
Here:
$17,706
State:
$26,433
Here:
16.8% of AGI
State:
19.2% of AGI
(% of AGI for various income ranges: 8.8% for AGIs below $25k, 8.9% for AGIs $25k-50k, 7.7% for AGIs $50k-75k, 8.8% for AGIs $75k-100k, 13.2% for AGIs $100k-200k)
Charity contributions: $2,858 (reported on 20.2% of returns)
Here:
$2,858
State:
$4,525
(% of AGI for various income ranges: 0.9% for AGIs $25k-50k, 0.8% for AGIs $50k-75k, 1.1% for AGIs $75k-100k, 2.0% for AGIs $100k-200k)
Taxes paid: $7,667 (reported on 27.7% of returns)
61760:
$7,667
State:
$11,968
(% of AGI for various income ranges: 1.8% for AGIs below $25k, 1.9% for AGIs $25k-50k, 3.0% for AGIs $50k-75k, 3.7% for AGIs $75k-100k, 7.7% for AGIs $100k-200k)
Earned income credit: $2,247 (reported on 14.3% of returns)
Here:
$2,247
State:
$2,349
(% of AGI for various income ranges: 5.7% for AGIs below $25k, 0.8% for AGIs $25k-50k)
Percentage of individuals using paid preparers for their 2012 taxes: 58.8%
Here:
59%
State:
57%
(% for various income ranges: 52.4% for AGIs below $25k, 57.1% for AGIs $25k-50k, 63.2% for AGIs $50k-75k, 64.3% for AGIs $75k-100k, 64.3% for AGIs $100k-200k, 100.0% for AGIs over 200k)
Averages for the 2004 tax year for zip code 61760, filed in 2005:
Average Adjusted Gross Income (AGI) in 2004: $40,111 (Individual Income Tax Returns)
Here:
$40,111
State:
$54,625
Salary/wage: $37,016 (reported on 80.6% of returns)
Here:
$37,016
State:
$46,811
(% of AGI for various income ranges: 107.5% for AGIs below $10k, 65.3% for AGIs $10k-25k, 76.8% for AGIs $25k-50k, 76.5% for AGIs $50k-75k, 76.5% for AGIs $75k-100k, 68.9% for AGIs over 100k)
Taxable interest for individuals: $2,113 (reported on 55.3% of returns)
This zip code:
$2,113
Illinois:
$2,101
(% of AGI for various income ranges: 11.8% for AGIs below $10k, 6.5% for AGIs $10k-25k, 3.1% for AGIs $25k-50k, 2.6% for AGIs $50k-75k, 2.5% for AGIs $75k-100k, 1.2% for AGIs over 100k)
Taxable dividends: $1,660 (reported on 25.7% of returns)
Here:
$1,660
State:
$4,306
(% of AGI for various income ranges: 4.1% for AGIs below $10k, 0.8% for AGIs $10k-25k, 0.7% for AGIs $25k-50k, 0.9% for AGIs $50k-75k, 0.8% for AGIs $75k-100k, 1.9% for AGIs over 100k)
Net capital gain/loss: +$5,606 (reported on 16.5% of returns)
Here:
+$5,606
State:
+$17,321
(% of AGI for various income ranges: -1.7% for AGIs below $10k, -0.0% for AGIs $10k-25k, -0.1% for AGIs $25k-50k, 0.5% for AGIs $50k-75k, 1.1% for AGIs $75k-100k, 10.1% for AGIs over 100k)
Profit/loss from business: +$7,898 (reported on 13.5% of returns)
Here:
+$7,898
State:
+$11,771
(% of AGI for various income ranges: 8.4% for AGIs below $10k, 4.5% for AGIs $10k-25k, 2.0% for AGIs $25k-50k, 3.3% for AGIs $50k-75k, 3.9% for AGIs $75k-100k, -0.0% for AGIs over 100k)
Profit/loss from farming: +$19,538 (reported on 6.4% of returns)
Here:
+$19,538
State:
+$2,327
(% of AGI for various income ranges: -0.3% for AGIs $25k-50k, 3.4% for AGIs $50k-75k, 4.8% for AGIs $75k-100k, 6.6% for AGIs over 100k)
IRA payment deduction: $2,784 (reported on 3.0% of returns)
61760:
$2,784
Illinois:
$3,087
Self-employed pension: $5,333 (reported on 2.0% of returns)
Here:
$5,333
Illinois:
$16,965
Total itemized deductions: $15,195 (22% of AGI, reported on 23.0% of returns)
Here:
$15,195
State:
$20,239
Here:
22.3% of AGI
State:
19.5% of AGI
(% of AGI for various income ranges: 15.1% for AGIs $10k-25k, 7.6% for AGIs $25k-50k, 7.3% for AGIs $50k-75k, 9.5% for AGIs $75k-100k, 8.6% for AGIs over 100k)
Charity contributions deductions: $2,378 (3% of AGI, reported on 19.6% of returns)
Here:
$2,378
State:
$3,719
Here:
3.3% of AGI
State:
3.4% of AGI
(% of AGI for various income ranges: 0.8% for AGIs $10k-25k, 0.9% for AGIs $25k-50k, 0.9% for AGIs $50k-75k, 1.3% for AGIs $75k-100k, 2.0% for AGIs over 100k)
Total tax: $5,159 (reported on 76.5% of returns)
61760:
$5,159
State:
$9,882
(% of AGI for various income ranges: 3.1% for AGIs below $10k, 4.4% for AGIs $10k-25k, 7.0% for AGIs $25k-50k, 8.8% for AGIs $50k-75k, 11.1% for AGIs $75k-100k, 16.3% for AGIs over 100k)
Earned income credit: $1,652 (reported on 10.7% of returns)
Here:
$1,652
State:
$1,788
Percentage of individuals using paid preparers for their 2004 taxes: 63.4%
Here:
63%
State:
61%
(% for various income ranges: 53.8% for AGIs below $10k, 66.5% for AGIs $10k-25k, 64.1% for AGIs $25k-50k, 60.7% for AGIs $50k-75k, 69.0% for AGIs $75k-100k, 77.5% for AGIs over 100k)
Household received Food Stamps/SNAP in the past 12 months: 54 Household did not receive Food Stamps/SNAP in the past 12 months: 903
Women who had a birth in the past 12 months: 42 (29 now married, 12 unmarried) Women who did not have a birth in the past 12 months: 345 (194 now married, 148 unmarried)
Housing units in zip code 61760 with a mortgage: 344 (43 second mortgage, 27 both second mortgage and home equity loan) Median monthly owner costs for units with a mortgage: $1,108 Median monthly owner costs for units without a mortgage: $564
Residents with income below the poverty level in 2022:
This zip code:
11.9%
Whole state:
11.9%
Residents with income below 50% of the poverty level in 2022:
This zip code:
4.7%
Whole state:
5.7%
Median number of rooms in houses and condos:
Here:
7.4
State:
6.4
Median number of rooms in apartments:
Here:
4.3
State:
4.1
Notable locations in this zip code not listed on our city pages
Churches in zip code 61760 include: Immanuel Lutheran Church (A), Minonk Baptist Church (B), Saint Patrick Church (C), Saint Pauls United Church of Christ (D), United Methodist Church of Minonk (E). Display/hide their locations on the map
Cemeteries: Baughman Cemetery (1), Saint Patricks Cemetery (2), Bauman Cemetery (3), Minonk Cemetery (4), Hallenback Cemetery (5), Davison Cemetery (6). Display/hide their locations on the map
In group quarters: 54 (-1 institutionalized population)
Size of family households: 295 2-persons, 111 3-persons, 57 4-persons, 89 5-persons, 2 6-persons, 3 7-or-more-persons
Size of nonfamily households: 364 1-person, 41 2-persons, 3 5-persons
373 married couples with children.
106 single-parent households (66 men, 40 women).
98.7% of residents of 61760 zip code speak English at home.
0.2% of residents speak Spanish at home (100% very well).
0.3% of residents speak other Indo-European language at home (100% very well).
0.2% of residents speak Asian or Pacific Island language at home (100% very well).
Foreign born population: 15 (0.7%) (100.0% of them are naturalized citizens)
This zip code:
0.7%
Whole state:
14.4%
40%Bhutan
27%United Kingdom, excluding England and Scotland
27%Malaysia
20%Sweden
35%German
18%Irish
13%European
12%American
5%Polish
4%English
3%Swedish
Year of entry for the foreign-born population
02010 or later
02000 to 2009
01990 to 1999
14Before 1990
Major facilities with environmental interests located in this zip code:
RUFF BROTHERS GRAIN CO (3046 COUNTY ROAD 1950 NORTH in MINONK, IL)
STATE MASTER (Illinois EPA Project) - AIR PROGRAM AIR MINOR (AIRS/AFS) CRITERIA AND HAZARDOUS AIR POLLUTANT INVENTORY (Inventory of air pollution sources) Business SIC classification: GRAIN AND FIELD BEANS
ALIQUOT LTD (1450 INDUSTRIAL PARK ROAD in MINONK, IL)
STATE MASTER (Illinois EPA Project) - HAZARDOUS WASTE PROGRAM, AIR PROGRAM AIR MINOR (AIRS/AFS) (Resource Conservation and Recovery Act (tracking hazardous waste)) Business SIC classification: NONCLASSIFIABLE ESTABLISHMENTS
MINONK STP (NORTH OAK STREET in MINONK, IL)
STATE MASTER (Illinois EPA Project) - National Pollutant Discharge Elimination System Permit National Pollutant Discharge Elimination System NON-MAJOR (Tracking pollutant discharge elimination systems) - permit National Pollutant Discharge Elimination System NON-MAJOR (Tracking pollutant discharge elimination systems) - permit Business SIC classification: SEWERAGE SYSTEMS Alternative names: MINONK STP, CITY OF
HEARTLAND CABLE INC (167 W 5TH ST in MINONK, IL)
STATE MASTER (Illinois EPA Project) - SOLID WASTE PROGRAM Large Quantity Generators, more that 1000 kg of hazardous waste/month (Resource Conservation and Recovery Act (tracking hazardous waste)) - notification Organizations: BLOCK CLARENCE (CONTACT/OWNER)
Alternative names: BLOCKS CLEANERS
MINONK , CITY OF (666 CHESTNUT in MINONK, IL)
STATE MASTER (Illinois EPA Project) - HAZARDOUS WASTE PROGRAM Large Quantity Generators, more that 1000 kg of hazardous waste/month (Resource Conservation and Recovery Act (tracking hazardous waste)) - notification Organizations: MINONK CITY OF (CONTACT/OWNER)
INTERSTATE BRANDS CORP (447 OAK ST in MINONK, IL)
STATE MASTER (Illinois EPA Project) - AIR PROGRAM AIR MINOR (AIRS/AFS) CRITERIA AND HAZARDOUS AIR POLLUTANT INVENTORY (Inventory of air pollution sources) Business SIC classification: BREAD AND OTHER BAKERY PRODUCTS, EXCEPT COOKIES AND CRACKERS Business NAICS classification: COMMERCIAL BAKERIES. Alternative names: MINONK BAKING COMPANY
KELSEY FARMS (1 MI E. & 1/2 MI. N. OF RT. 51 in MINONK, IL)
STATE MASTER (Illinois EPA Project) - National Pollutant Discharge Elimination System Permit National Pollutant Discharge Elimination System NON-MAJOR (Tracking pollutant discharge elimination systems) - permit
MCCORMICK CONSTRUCTION (911 W 8TH ST in MINONK, IL)
STATE MASTER (Illinois EPA Project) - HAZARDOUS WASTE PROGRAM (Resource Conservation and Recovery Act (tracking hazardous waste)) Organizations: MC CORMICK ROBERT (CONTACT/OWNER)
Alternative names: MC CORMICK CONSTRUCTION
RUFF BROTHERS GRAIN CO (ROUTE 251 S in MINONK, IL)
STATE MASTER (Illinois EPA Project) - AIR PROGRAM AIR MINOR (AIRS/AFS) CRITERIA AND HAZARDOUS AIR POLLUTANT INVENTORY (Inventory of air pollution sources) Business SIC classification: GRAIN AND FIELD BEANS Alternative names: RUFF BROS. GRAIN COMPANY/WOODFORD LOC.
HERMANS BODY SHOP INC (538 WALNUT in MINONK, IL)
STATE MASTER (Illinois EPA Project) - HAZARDOUS WASTE PROGRAM Small Quantity Generators, between 100 kg and 1000 kg of hazardous waste/month (Resource Conservation and Recovery Act (tracking hazardous waste)) - notification Organizations: HERMAN BILL (CONTACT/OWNER)
ILLINOIS VALLEY PAVING CO (US ROUTE 51 in MINONK, IL)
STATE MASTER (Illinois EPA Project) - AIR PROGRAM AIR MINOR (AIRS/AFS) Business SIC classification: READY-MIXED CONCRETE
ILLINOIS VALLEY PAVING CO (R.R. KAPPA in WOODFORD, IL)
STATE MASTER (Illinois EPA Project) - AIR PROGRAM AIR MINOR (AIRS/AFS) Business SIC classification: READY-MIXED CONCRETE
SAMPLE OIL CO (710 JEFFERSON ST in MINONK, IL)
STATE MASTER (Illinois EPA Project) - AIR PROGRAM AIR MINOR (AIRS/AFS) Business SIC classification: PETROLEUM BULK STATIONS AND TERMINALS
Housing units lacking complete plumbing facilities: 2.6% Housing units lacking complete kitchen facilities: 3.2%
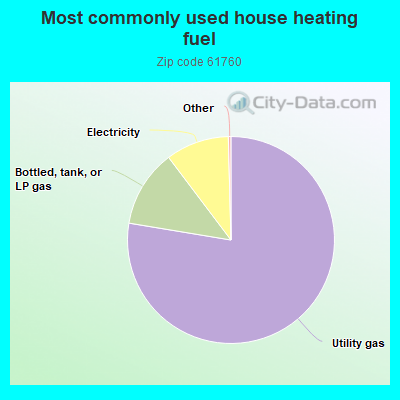
77.7%Utility gas
12.1%Bottled, tank, or LP gas
9.9%Electricity
Population in 1990: 2,559. Population change in the 1990s: +132 (+5.2%).
Place of birth for U.S.-born residents:
This state: 1,929
Northeast: 11
Midwest: 96
South: 149
West: 10
64% of the 61760 zip code residents lived in the same house 5 years ago. Out of people who lived in different houses, 38% lived in this county. Out of people who lived in different counties, 50% lived in Illinois.
88% of the 61760 zip code residents lived in the same house 1 year ago. Out of people who lived in different houses, 52% moved from this county. Out of people who lived in different houses, 38% moved from different county within same state. Out of people who lived in different houses, 9% moved from different state.
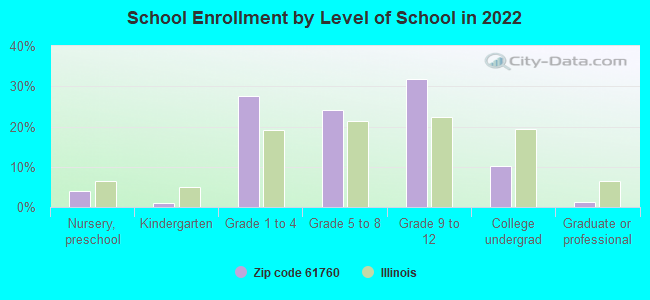
Private vs. public school enrollment:
Students in private schools in grades 1 to 8 (elementary and middle school):
Here:
0.0%
Illinois:
13.3%
Students in private schools in grades 9 to 12 (high school): 5
Here:
3.5%
Illinois:
9.9%
Students in private undergraduate colleges:
Here:
0.0%
Illinois:
27.4%
Occupation by median earnings in the past 12 months ($)
88,582Computer and mathematical occupations
75,395Management occupations
54,575Education, training, and library occupations
48,125Production occupations
48,061Sales and related occupations
45,833Material moving occupations
Top industries in this zip code by the number of employees in 2005:
Health Care and Social Assistance: Nursing Care Facilities (50-99 employees: 1 establishment)
Finance and Insurance: Commercial Banking (20-49: 1, 5-9: 1)
Accommodation and Food Services: Full-Service Restaurants (20-49: 1, 1-4: 3)
Wholesale Trade: Farm and Garden Machinery and Equipment Merchant Wholesalers (10-19: 2)
Administrative and Support and Waste Management and Remediation Services: Landscaping Services (10-19: 1, 1-4: 1)
Wholesale Trade: Grain and Field Bean Merchant Wholesalers (10-19: 1)
People in group quarters in 2010:
55 people in nursing facilities/skilled-nursing facilities
People in group quarters in 2000:
62 people in nursing homes
Fatal accident statistics in 2014:
Fatal accident count: 2
Vehicles involved in fatal accidents: 3
Fatal accidents caused by drunken drivers: 0
Fatalities: 2
Persons involved in fatal accidents: 4
Pedestrians involved in fatal accidents: 1
Fatal accident statistics in 2010:
Fatal accident count: 1
Vehicles involved in fatal accidents: 2
Fatal accidents caused by drunken drivers: 0
Fatalities: 1
Persons involved in fatal accidents: 3
Pedestrians involved in fatal accidents: 0
Home Mortgage Disclosure Act Aggregated Statistics For Year 2009 (Based on 4 partial tracts)
A) FHA, FSA/RHS & VA Home Purchase Loans
B) Conventional Home Purchase Loans
C) Refinancings
D) Home Improvement Loans
F) Non-occupant Loans on < 5 Family Dwellings (A B C & D)
G) Loans On Manufactured Home Dwelling (A B C & D)
Number
Average Value
Number
Average Value
Number
Average Value
Number
Average Value
Number
Average Value
Number
Average Value
LOANS ORIGINATED
9
$80,702
36
$90,579
135
$108,071
15
$60,163
14
$49,609
2
$13,840
APPLICATIONS APPROVED, NOT ACCEPTED
0
$0
1
$55,280
6
$129,028
0
$0
0
$0
0
$0
APPLICATIONS DENIED
0
$0
2
$40,530
37
$107,878
7
$22,047
2
$31,875
0
$0
APPLICATIONS WITHDRAWN
2
$126,395
0
$0
16
$134,477
3
$86,130
0
$0
0
$0
FILES CLOSED FOR INCOMPLETENESS
0
$0
0
$0
2
$62,600
0
$0
0
$0
0
$0
Aggregated Statistics For Year 2008 (Based on 4 partial tracts)
A) FHA, FSA/RHS & VA Home Purchase Loans
B) Conventional Home Purchase Loans
C) Refinancings
D) Home Improvement Loans
F) Non-occupant Loans on < 5 Family Dwellings (A B C & D)
G) Loans On Manufactured Home Dwelling (A B C & D)
Number
Average Value
Number
Average Value
Number
Average Value
Number
Average Value
Number
Average Value
Number
Average Value
LOANS ORIGINATED
23
$96,761
44
$67,304
95
$96,577
12
$36,781
27
$61,447
0
$0
APPLICATIONS APPROVED, NOT ACCEPTED
0
$0
2
$41,850
6
$106,017
2
$8,300
0
$0
0
$0
APPLICATIONS DENIED
4
$95,652
10
$51,873
34
$93,619
14
$68,234
0
$0
2
$18,780
APPLICATIONS WITHDRAWN
2
$96,870
2
$60,385
17
$96,258
1
$89,910
2
$65,350
0
$0
FILES CLOSED FOR INCOMPLETENESS
0
$0
2
$87,645
1
$107,450
2
$13,310
0
$0
0
$0
Aggregated Statistics For Year 2007 (Based on 4 partial tracts)
A) FHA, FSA/RHS & VA Home Purchase Loans
B) Conventional Home Purchase Loans
C) Refinancings
D) Home Improvement Loans
F) Non-occupant Loans on < 5 Family Dwellings (A B C & D)
G) Loans On Manufactured Home Dwelling (A B C & D)
Number
Average Value
Number
Average Value
Number
Average Value
Number
Average Value
Number
Average Value
Number
Average Value
LOANS ORIGINATED
14
$88,704
74
$73,656
82
$92,426
21
$28,945
11
$68,120
5
$27,062
APPLICATIONS APPROVED, NOT ACCEPTED
0
$0
2
$166,935
14
$73,961
5
$37,140
0
$0
0
$0
APPLICATIONS DENIED
0
$0
9
$78,931
39
$90,953
17
$40,040
1
$89,690
3
$33,827
APPLICATIONS WITHDRAWN
0
$0
2
$141,785
20
$78,789
2
$60,375
0
$0
0
$0
FILES CLOSED FOR INCOMPLETENESS
0
$0
0
$0
7
$101,479
2
$90,845
0
$0
0
$0
Aggregated Statistics For Year 2006 (Based on 4 partial tracts)
A) FHA, FSA/RHS & VA Home Purchase Loans
B) Conventional Home Purchase Loans
C) Refinancings
D) Home Improvement Loans
F) Non-occupant Loans on < 5 Family Dwellings (A B C & D)
G) Loans On Manufactured Home Dwelling (A B C & D)
Number
Average Value
Number
Average Value
Number
Average Value
Number
Average Value
Number
Average Value
Number
Average Value
LOANS ORIGINATED
15
$84,351
89
$82,184
74
$86,465
33
$19,992
17
$82,043
2
$91,690
APPLICATIONS APPROVED, NOT ACCEPTED
0
$0
2
$95,350
13
$67,446
4
$23,980
0
$0
2
$21,265
APPLICATIONS DENIED
8
$70,301
11
$123,455
57
$92,018
22
$23,710
2
$49,080
0
$0
APPLICATIONS WITHDRAWN
2
$64,580
6
$77,285
34
$93,793
3
$72,780
4
$49,352
0
$0
FILES CLOSED FOR INCOMPLETENESS
0
$0
4
$81,508
5
$56,748
2
$71,870
2
$57,660
0
$0
Aggregated Statistics For Year 2005 (Based on 4 partial tracts)
A) FHA, FSA/RHS & VA Home Purchase Loans
B) Conventional Home Purchase Loans
C) Refinancings
D) Home Improvement Loans
E) Loans on Dwellings For 5+ Families
F) Non-occupant Loans on < 5 Family Dwellings (A B C & D)
G) Loans On Manufactured Home Dwelling (A B C & D)
Number
Average Value
Number
Average Value
Number
Average Value
Number
Average Value
Number
Average Value
Number
Average Value
Number
Average Value
LOANS ORIGINATED
9
$88,279
107
$68,041
108
$81,968
27
$36,802
1
$120,320
23
$53,974
3
$28,210
APPLICATIONS APPROVED, NOT ACCEPTED
0
$0
3
$66,333
10
$103,553
2
$17,210
0
$0
0
$0
0
$0
APPLICATIONS DENIED
2
$56,120
19
$54,774
91
$94,113
23
$30,718
0
$0
3
$22,040
5
$27,094
APPLICATIONS WITHDRAWN
0
$0
7
$61,844
54
$107,842
8
$104,254
0
$0
6
$71,755
0
$0
FILES CLOSED FOR INCOMPLETENESS
0
$0
1
$80,140
4
$117,322
0
$0
0
$0
0
$0
0
$0
Aggregated Statistics For Year 2004 (Based on 4 partial tracts)
A) FHA, FSA/RHS & VA Home Purchase Loans
B) Conventional Home Purchase Loans
C) Refinancings
D) Home Improvement Loans
F) Non-occupant Loans on < 5 Family Dwellings (A B C & D)
G) Loans On Manufactured Home Dwelling (A B C & D)
Number
Average Value
Number
Average Value
Number
Average Value
Number
Average Value
Number
Average Value
Number
Average Value
LOANS ORIGINATED
9
$92,934
81
$74,757
119
$83,565
28
$44,240
22
$63,775
5
$104,942
APPLICATIONS APPROVED, NOT ACCEPTED
2
$109,940
4
$61,825
11
$96,015
1
$5,330
0
$0
2
$16,915
APPLICATIONS DENIED
0
$0
12
$77,309
86
$86,883
23
$22,393
6
$57,147
0
$0
APPLICATIONS WITHDRAWN
0
$0
2
$27,440
55
$85,724
4
$36,128
3
$84,057
0
$0
FILES CLOSED FOR INCOMPLETENESS
0
$0
0
$0
5
$77,134
0
$0
0
$0
0
$0
Aggregated Statistics For Year 2003 (Based on 4 partial tracts)
A) FHA, FSA/RHS & VA Home Purchase Loans
B) Conventional Home Purchase Loans
C) Refinancings
D) Home Improvement Loans
F) Non-occupant Loans on < 5 Family Dwellings (A B C & D)
Number
Average Value
Number
Average Value
Number
Average Value
Number
Average Value
Number
Average Value
LOANS ORIGINATED
15
$76,423
89
$60,380
341
$81,405
28
$44,545
28
$55,610
APPLICATIONS APPROVED, NOT ACCEPTED
0
$0
0
$0
19
$84,912
1
$18,200
3
$61,503
APPLICATIONS DENIED
2
$55,535
15
$92,236
92
$70,839
11
$17,355
12
$68,787
APPLICATIONS WITHDRAWN
0
$0
5
$60,314
68
$92,110
0
$0
3
$41,063
FILES CLOSED FOR INCOMPLETENESS
0
$0
0
$0
3
$72,157
0
$0
0
$0
Aggregated Statistics For Year 2002 (Based on 4 partial tracts)
A) FHA, FSA/RHS & VA Home Purchase Loans
B) Conventional Home Purchase Loans
C) Refinancings
D) Home Improvement Loans
F) Non-occupant Loans on < 5 Family Dwellings (A B C & D)
Number
Average Value
Number
Average Value
Number
Average Value
Number
Average Value
Number
Average Value
LOANS ORIGINATED
10
$73,148
72
$71,811
325
$76,768
29
$28,579
20
$47,214
APPLICATIONS APPROVED, NOT ACCEPTED
2
$105,355
5
$34,434
16
$65,333
1
$9,990
3
$33,313
APPLICATIONS DENIED
0
$0
11
$71,320
78
$74,545
17
$20,319
7
$69,780
APPLICATIONS WITHDRAWN
2
$99,580
2
$65,330
45
$92,666
2
$7,475
5
$70,490
FILES CLOSED FOR INCOMPLETENESS
0
$0
0
$0
2
$76,710
0
$0
0
$0
Aggregated Statistics For Year 2001 (Based on 4 partial tracts)
A) FHA, FSA/RHS & VA Home Purchase Loans
B) Conventional Home Purchase Loans
C) Refinancings
D) Home Improvement Loans
F) Non-occupant Loans on < 5 Family Dwellings (A B C & D)
Number
Average Value
Number
Average Value
Number
Average Value
Number
Average Value
Number
Average Value
LOANS ORIGINATED
8
$66,786
61
$68,555
189
$77,634
44
$15,334
15
$43,433
APPLICATIONS APPROVED, NOT ACCEPTED
2
$42,285
6
$39,060
16
$66,272
7
$11,354
0
$0
APPLICATIONS DENIED
1
$75,480
10
$60,856
37
$52,497
16
$11,087
2
$22,550
APPLICATIONS WITHDRAWN
2
$50,740
0
$0
19
$61,403
5
$39,992
0
$0
FILES CLOSED FOR INCOMPLETENESS
0
$0
0
$0
6
$76,393
0
$0
0
$0
Aggregated Statistics For Year 2000 (Based on 4 partial tracts)
A) FHA, FSA/RHS & VA Home Purchase Loans
B) Conventional Home Purchase Loans
C) Refinancings
D) Home Improvement Loans
F) Non-occupant Loans on < 5 Family Dwellings (A B C & D)
Number
Average Value
Number
Average Value
Number
Average Value
Number
Average Value
Number
Average Value
LOANS ORIGINATED
10
$84,937
71
$71,671
53
$61,409
46
$14,310
10
$42,911
APPLICATIONS APPROVED, NOT ACCEPTED
2
$38,440
6
$80,227
6
$48,950
11
$20,152
3
$80,980
APPLICATIONS DENIED
2
$59,965
18
$37,697
22
$49,148
13
$13,245
0
$0
APPLICATIONS WITHDRAWN
2
$35,365
3
$44,590
19
$55,683
5
$42,460
0
$0
FILES CLOSED FOR INCOMPLETENESS
0
$0
2
$57,920
3
$39,130
0
$0
0
$0
Aggregated Statistics For Year 1999 (Based on 2 partial tracts)
A) FHA, FSA/RHS & VA Home Purchase Loans
B) Conventional Home Purchase Loans
C) Refinancings
D) Home Improvement Loans
F) Non-occupant Loans on < 5 Family Dwellings (A B C & D)
Detailed PMIC statistics for the following Tracts:0302.00
, 0307.00
2002 - 2018 National Fire Incident Reporting System (NFIRS) incidents
Based on the data from the years 2002 - 2018 the average number of fires per year is 14. The highest number of fires - 26 took place in 2011, and the least - 0 in 2004. The data has a rising trend.
When looking into fire subcategories, the most incidents belonged to: Structure Fires (36.3%), and Outside Fires (35.5%).
Fire incident types reported to NFIRS in Zip Code 61760


 Nearest zip codes: 61358, 61321, 61516, 61738, 61740, 61369.


 Based on the data from the years 2002 - 2018 the average number of fires per year is 14. The highest number of fires - 26 took place in 2011, and the least - 0 in 2004. The data has a rising trend.
 When looking into fire subcategories, the most incidents belonged to: Structure Fires (36.3%), and Outside Fires (35.5%).