Estimated zip code population in 2022: 1,729 Zip code population in 2010: 1,715 Zip code population in 2000: 1,553
Houses and condos: 592 Renter-occupied apartments: 63
% of renters here:
11%
State:
33%
March 2022 cost of living index in zip code 61864: 85.6 (less than average, U.S. average is 100)
Land area: 22.8 sq. mi. Water area: 0.0 sq. mi.
Population density: 76 people per square mile
(very low).
OSM Map
General Map
Google Map
MSN Map
OSM Map
General Map
Google Map
MSN Map
OSM Map
General Map
Google Map
MSN Map
OSM Map
General Map
Google Map
MSN Map
Please wait while loading the map...
Real estate property taxes paid for housing units in 2022:
This zip code:
1.7% ($3,463)
Illinois:
2.0% ($4,912)
Median real estate property taxes paid for housing units with mortgages in 2022: $3,539 (1.8%) Median real estate property taxes paid for housing units with no mortgage in 2022: $3,091 (1.4%)
Business Search- 14 Million verified businesses
Males: 899
(52.0%)
Females: 830
(48.0%)
For population 25 years and over in 61864:
High school or higher: 91.1%
Bachelor's degree or higher: 32.9%
Graduate or professional degree: 11.1%
Unemployed: 0.7%
Mean travel time to work (commute): 18.3 minutes
For population 15 years and over in 61864:
Never married: 34.2%
Now married: 53.4%
Separated: 0.7%
Widowed: 5.4%
Divorced: 6.3%
Zip code 61864 compared to state average:
Unemployed percentage significantly below state average.
Black race population percentage significantly below state average.
Hispanic race population percentage significantly below state average.
Foreign-born population percentage significantly below state average.
Renting percentage significantly below state average.
Estimated median house/condo value in 2022: $204,353
61864:
$204,353
Illinois:
$251,600
According to our research of Illinois and other state lists, there was 1 registered sex offender living in 61864 zip code as of May 28, 2024. The ratio of all residents to sex offenders in zip code 61864 is 1,775 to 1. The ratio of registered sex offenders to all residents in this zip code is lower than the state average.
Median resident age:
This zip code:
36.9 years
Illinois median age:
39.1 years
Average household size:
This zip code:
3.0 people
Illinois:
2.4 people
Averages for the 2020 tax year for zip code 61864, filed in 2021:
Average Adjusted Gross Income (AGI) in 2020: $79,706 (Individual Income Tax Returns)
Here:
$79,706
State:
$82,626
Salary/wage: $63,336 (reported on 81.2% of returns)
Here:
$63,336
State:
$66,640
(% of AGI for various income ranges: 1173.6% for AGIs below $25k, 3308.5% for AGIs $25k-50k, 6663.8% for AGIs $50k-75k, 9710.0% for AGIs $75k-100k, 13033.3% for AGIs $100k-200k)
Taxable interest for individuals: $800 (reported on 40.0% of returns)
This zip code:
$800
Illinois:
$2,376
(% of AGI for various income ranges: 15.7% for AGIs below $25k, 20.8% for AGIs $25k-50k, 66.2% for AGIs $50k-75k, 58.3% for AGIs $75k-100k, 52.7% for AGIs $100k-200k)
Ordinary dividends: $3,458 (reported on 22.4% of returns)
Here:
$3,458
State:
$9,061
(% of AGI for various income ranges: 50.0% for AGIs $25k-50k, 70.0% for AGIs $50k-75k, 168.3% for AGIs $75k-100k, 110.7% for AGIs $100k-200k)
Net capital gain/loss in AGI: +$10,441 (reported on 20.0% of returns)
Here:
+$10,441
State:
+$31,684
(% of AGI for various income ranges: 11.4% for AGIs below $25k, 113.8% for AGIs $50k-75k, 171.3% for AGIs $100k-200k)
Profit/loss from business: +$13,840 (reported on 11.8% of returns)
Here:
+$13,840
State:
+$12,175
(% of AGI for various income ranges: 117.9% for AGIs below $25k, 266.2% for AGIs $50k-75k, 670.7% for AGIs $100k-200k)
Taxable individual retirement arrangement distribution: $14,200 (reported on 11.8% of returns)
61864:
$14,200
Illinois:
$21,613
(% of AGI for various income ranges: 167.1% for AGIs below $25k, 276.2% for AGIs $50k-75k, 643.3% for AGIs $100k-200k)
Total itemized deductions: $23,767 (reported on 3.5% of returns)
Here:
$23,767
State:
$34,948
(% of AGI for various income ranges: 1188.3% for AGIs $75k-100k)
Charity contributions: $7,450 (reported on 2.4% of returns)
Here:
$7,450
State:
$13,122
(% of AGI for various income ranges: 114.6% for AGIs $25k-50k)
Taxes paid: $8,233 (reported on 3.5% of returns)
61864:
$8,233
State:
$8,563
(% of AGI for various income ranges: 411.7% for AGIs $75k-100k)
Earned income credit: $1,550 (reported on 7.1% of returns)
Here:
$1,550
State:
$2,311
(% of AGI for various income ranges: 25.7% for AGIs below $25k, 43.8% for AGIs $25k-50k)
Percentage of individuals using paid preparers for their 2020 taxes: 94.1%
Here:
94%
State:
93%
(% for various income ranges: 95.2% for AGIs below $25k, 100.0% for AGIs $25k-50k, 91.7% for AGIs $50k-75k, 90.0% for AGIs $75k-100k, 95.5% for AGIs $100k-200k, 80.0% for AGIs over 200k)
Averages for the 2012 tax year for zip code 61864, filed in 2013:
Average Adjusted Gross Income (AGI) in 2012: $67,155 (Individual Income Tax Returns)
Here:
$67,155
State:
$68,058
Salary/wage: $49,875 (reported on 84.7% of returns)
Here:
$49,875
State:
$55,396
(% of AGI for various income ranges: 76.6% for AGIs below $25k, 74.2% for AGIs $25k-50k, 69.8% for AGIs $50k-75k, 75.4% for AGIs $75k-100k, 66.0% for AGIs $100k-200k, 26.5% for AGIs over 200k)
Taxable interest for individuals: $1,016 (reported on 43.5% of returns)
This zip code:
$1,016
Illinois:
$1,969
(% of AGI for various income ranges: 1.1% for AGIs below $25k, 0.6% for AGIs $25k-50k, 0.5% for AGIs $50k-75k, 0.5% for AGIs $75k-100k, 0.2% for AGIs $100k-200k, 1.7% for AGIs over 200k)
Ordinary dividends: $2,605 (reported on 25.9% of returns)
Here:
$2,605
State:
$7,786
(% of AGI for various income ranges: 1.5% for AGIs below $25k, 0.7% for AGIs $25k-50k, 1.1% for AGIs $50k-75k, 0.6% for AGIs $75k-100k, 1.7% for AGIs $100k-200k)
Net capital gain/loss in AGI: +$10,453 (reported on 17.6% of returns)
Here:
+$10,453
State:
+$22,183
(% of AGI for various income ranges: 0.9% for AGIs $100k-200k, 14.5% for AGIs over 200k)
Profit/loss from business: +$11,592 (reported on 14.1% of returns)
Here:
+$11,592
State:
+$12,903
(% of AGI for various income ranges: 6.5% for AGIs $25k-50k, 2.7% for AGIs $50k-75k, 1.4% for AGIs $75k-100k, 3.3% for AGIs $100k-200k)
Taxable individual retirement arrangement distribution: $14,370 (reported on 11.8% of returns)
61864:
$14,370
Illinois:
$17,929
(% of AGI for various income ranges: 9.1% for AGIs below $25k, 4.1% for AGIs $50k-75k, 4.5% for AGIs $100k-200k)
Total itemized deductions: $19,167 (18% of AGI, reported on 38.8% of returns)
Here:
$19,167
State:
$26,433
Here:
17.9% of AGI
State:
19.2% of AGI
(% of AGI for various income ranges: 15.7% for AGIs $25k-50k, 9.8% for AGIs $50k-75k, 10.1% for AGIs $75k-100k, 12.4% for AGIs $100k-200k, 10.8% for AGIs over 200k)
Charity contributions: $4,079 (reported on 28.2% of returns)
Here:
$4,079
State:
$4,525
(% of AGI for various income ranges: 1.5% for AGIs $25k-50k, 1.0% for AGIs $50k-75k, 1.2% for AGIs $75k-100k, 2.0% for AGIs $100k-200k, 3.1% for AGIs over 200k)
Taxes paid: $8,136 (reported on 38.8% of returns)
61864:
$8,136
State:
$11,968
(% of AGI for various income ranges: 4.7% for AGIs $25k-50k, 3.8% for AGIs $50k-75k, 4.3% for AGIs $75k-100k, 5.6% for AGIs $100k-200k, 5.5% for AGIs over 200k)
Earned income credit: $2,057 (reported on 8.2% of returns)
Here:
$2,057
State:
$2,349
(% of AGI for various income ranges: 4.0% for AGIs below $25k, 0.7% for AGIs $25k-50k)
Percentage of individuals using paid preparers for their 2012 taxes: 56.5%
Here:
56%
State:
57%
(% for various income ranges: 45.8% for AGIs below $25k, 52.9% for AGIs $25k-50k, 57.1% for AGIs $50k-75k, 53.8% for AGIs $75k-100k, 71.4% for AGIs $100k-200k, 100.0% for AGIs over 200k)
Averages for the 2004 tax year for zip code 61864, filed in 2005:
Average Adjusted Gross Income (AGI) in 2004: $49,507 (Individual Income Tax Returns)
Here:
$49,507
State:
$54,625
Salary/wage: $42,885 (reported on 85.7% of returns)
Here:
$42,885
State:
$46,811
(% of AGI for various income ranges: 131.1% for AGIs below $10k, 77.2% for AGIs $10k-25k, 75.2% for AGIs $25k-50k, 73.4% for AGIs $50k-75k, 81.5% for AGIs $75k-100k, 66.2% for AGIs over 100k)
Taxable interest for individuals: $1,075 (reported on 58.5% of returns)
This zip code:
$1,075
Illinois:
$2,101
(% of AGI for various income ranges: 6.6% for AGIs below $10k, 1.8% for AGIs $10k-25k, 2.0% for AGIs $25k-50k, 1.3% for AGIs $50k-75k, 0.6% for AGIs $75k-100k, 1.1% for AGIs over 100k)
Taxable dividends: $1,748 (reported on 30.0% of returns)
Here:
$1,748
State:
$4,306
(% of AGI for various income ranges: 7.0% for AGIs below $10k, 0.8% for AGIs $10k-25k, 0.9% for AGIs $25k-50k, 0.9% for AGIs $50k-75k, 0.4% for AGIs $75k-100k, 1.6% for AGIs over 100k)
Net capital gain/loss: +$871 (reported on 19.9% of returns)
Here:
+$871
State:
+$17,321
(% of AGI for various income ranges: -5.0% for AGIs below $10k, -0.8% for AGIs $10k-25k, 0.0% for AGIs $25k-50k, 0.1% for AGIs $50k-75k, 0.3% for AGIs $75k-100k, 1.2% for AGIs over 100k)
Profit/loss from business: +$6,250 (reported on 14.6% of returns)
Here:
+$6,250
State:
+$11,771
(% of AGI for various income ranges: 4.8% for AGIs $10k-25k, 2.3% for AGIs $25k-50k, 2.7% for AGIs $50k-75k, 1.0% for AGIs $75k-100k, 0.9% for AGIs over 100k)
Profit/loss from farming: +$18,658 (reported on 4.6% of returns)
Here:
+$18,658
State:
+$2,327
IRA payment deduction: $2,824 (reported on 2.1% of returns)
61864:
$2,824
Illinois:
$3,087
Total itemized deductions: $14,615 (18% of AGI, reported on 37.6% of returns)
Here:
$14,615
State:
$20,239
Here:
18.5% of AGI
State:
19.5% of AGI
(% of AGI for various income ranges: 13.4% for AGIs $10k-25k, 9.8% for AGIs $25k-50k, 12.8% for AGIs $50k-75k, 10.5% for AGIs $75k-100k, 10.8% for AGIs over 100k)
Charity contributions deductions: $2,717 (3% of AGI, reported on 32.3% of returns)
Here:
$2,717
State:
$3,719
Here:
3.3% of AGI
State:
3.4% of AGI
(% of AGI for various income ranges: 1.1% for AGIs $10k-25k, 1.5% for AGIs $25k-50k, 1.8% for AGIs $50k-75k, 1.9% for AGIs $75k-100k, 2.0% for AGIs over 100k)
Total tax: $6,541 (reported on 80.8% of returns)
61864:
$6,541
State:
$9,882
(% of AGI for various income ranges: 2.6% for AGIs below $10k, 5.7% for AGIs $10k-25k, 7.1% for AGIs $25k-50k, 8.2% for AGIs $50k-75k, 10.2% for AGIs $75k-100k, 16.8% for AGIs over 100k)
Earned income credit: $1,448 (reported on 7.1% of returns)
Here:
$1,448
State:
$1,788
Percentage of individuals using paid preparers for their 2004 taxes: 58.8%
Here:
59%
State:
61%
(% for various income ranges: 44.9% for AGIs below $10k, 60.6% for AGIs $10k-25k, 55.2% for AGIs $25k-50k, 62.6% for AGIs $50k-75k, 59.6% for AGIs $75k-100k, 80.8% for AGIs over 100k)
Household received Food Stamps/SNAP in the past 12 months: 9 Household did not receive Food Stamps/SNAP in the past 12 months: 549
Women who had a birth in the past 12 months: 10 (10 now married, 0 unmarried) Women who did not have a birth in the past 12 months: 358 (169 now married, 187 unmarried)
Housing units in zip code 61864 with a mortgage: 343 (14 second mortgage, 14 both second mortgage and home equity loan) Houses without a mortgage: 12
Median monthly owner costs for units with a mortgage: $1,377 Median monthly owner costs for units without a mortgage: $514
Residents with income below the poverty level in 2022:
This zip code:
7.4%
Whole state:
11.9%
Residents with income below 50% of the poverty level in 2022:
This zip code:
0.5%
Whole state:
5.7%
Median number of rooms in houses and condos:
Here:
6.7
State:
6.4
Median number of rooms in apartments:
Here:
5.0
State:
4.1
Notable locations in this zip code not listed on our city pages
334 married couples with children.
65 single-parent households (36 men, 29 women).
98.7% of residents of 61864 zip code speak English at home.
0.5% of residents speak other Indo-European language at home (62% very well, 38% well).
0.1% of residents speak other language at home (100% very well).
Foreign born population: 3 (0.2%) (66.9% of them are naturalized citizens)
This zip code:
0.2%
Whole state:
14.4%
67%Jordan
33%France
38%German
16%Irish
13%English
5%American
5%European
1%Norwegian
1%Czechoslovakian
Year of entry for the foreign-born population
02010 or later
02000 to 2009
11990 to 1999
7Before 1990
Facilities with environmental interests located in this zip code:
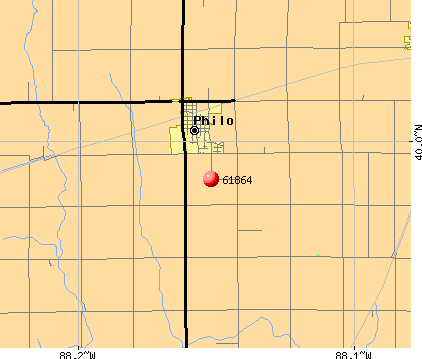
GRAND PRAIRIE COOP INC (104 N. HARRISON in PHILO, IL)
STATE MASTER (Illinois EPA Project) - AIR PROGRAM AIR MINOR (AIRS/AFS) CRITERIA AND HAZARDOUS AIR POLLUTANT INVENTORY (Inventory of air pollution sources) Business SIC classification: GRAIN AND FIELD BEANS Alternative names: GRAND PRAIRIE COOP PHILO
PHILO GRADE SCHOOL (PO BOX 259 in PHILO, IL)
(National Center for Education Statistics) - STATE ID-0901000702002 Organizations: TOLONO C U SCHOOL DIST 7 (SCHOOL DISTRICT)
ALLERTON SUPPLY CO. (ROUTE 1 in PHILO, IL)
AIR MINOR (AIRS/AFS) CRITERIA AND HAZARDOUS AIR POLLUTANT INVENTORY (Inventory of air pollution sources) Business SIC classification: FERTILIZERS, MIXING ONLY
PHILO TRUCK AND AUTO ROBERTS (501 N LINCOLN RT 130 in PHILO, IL)
Small Quantity Generators, between 100 kg and 1000 kg of hazardous waste/month (Resource Conservation and Recovery Act (tracking hazardous waste)) - notification Organizations: ROBERTS GERNON L (CONTACT/OWNER)
PHILO WOODWORKING (103 E WASHINGTON in PHILO, IL)
Small Quantity Generators, between 100 kg and 1000 kg of hazardous waste/month (Resource Conservation and Recovery Act (tracking hazardous waste)) Business NAICS classification: ALL OTHER MISCELLANEOUS WOOD PRODUCT MANUFACTURING. Organizations: MITCH KEELER (CONTACT/OPERATOR)
PHILO COUNTRY STORE (102 SOUTH LINCOLN STREET in PHILO, IL)
Small Quantity Generators, between 100 kg and 1000 kg of hazardous waste/month (Resource Conservation and Recovery Act (tracking hazardous waste)) - notification Organizations: BRIAN MAGGIO (CONTACT/OWNER)
Alternative names: PHILO TRUCK AND AUTO ROBERTS
69.4%Utility gas
22.1%Electricity
5.8%Bottled, tank, or LP gas
3.1%Other fuel
Population in 1990: 1,377. Population change in the 1990s: +176 (+12.8%).
Place of birth for U.S.-born residents:
This state: 1,539
Northeast: 9
Midwest: 102
South: 31
West: 29
72% of the 61864 zip code residents lived in the same house 5 years ago. Out of people who lived in different houses, 85% lived in this county. Out of people who lived in different counties, 50% lived in Illinois.
98% of the 61864 zip code residents lived in the same house 1 year ago. Out of people who lived in different houses, 73% moved from this county. Out of people who lived in different houses, 23% moved from different county within same state.
Private vs. public school enrollment:
Students in private schools in grades 1 to 8 (elementary and middle school): 23
Here:
13.6%
Illinois:
13.3%
Students in private schools in grades 9 to 12 (high school): 9
Here:
5.6%
Illinois:
9.9%
Students in private undergraduate colleges: 1
Here:
1.7%
Illinois:
27.4%
Occupation by median earnings in the past 12 months ($)
95,811Sales and related occupations
87,556Law enforcement workers including supervisors
79,353Architecture and engineering occupations
78,861Production occupations
75,249Life, physical, and social science occupations
73,970Construction and extraction occupations
Companies with federal contracts located in this zip code:
MOORE, LEE (406 S JACKSON ST in PHILO, IL; small business) : $128,260 in 6 contractsfrom 2003 to 2005
Contracts for Other ADP and Telecommunications Services (includes data storage on tapes, compact disks, etc.) by U.S. Army Corps of Engineers - civil program financing only, Army Signed by year:2000: $0; 2001: $0; 2002: $0; 2003: $61,760; 2004: $50,000; 2005: $16,500; 2006: $0.
Biggest contracts:
$25,000 with U.S. Army Corps of Engineers - civil program financing only for Other ADP and Telecommunications Services (includes data storage on tapes, compact disks, etc.). Signed on 2004-11-04. Completion date: 2005-09-30.
$25,000 with Army for Other ADP and Telecommunications Services (includes data storage on tapes, compact disks, etc.). Signed on 2004-11-04. Completion date: 2005-09-30.
$25,000, same as above.Signed on 2003-10-24. Completion date: 2004-09-30.
$25,000 with U.S. Army Corps of Engineers - civil program financing only for Other ADP and Telecommunications Services (includes data storage on tapes, compact disks, etc.). Signed on 2003-10-24. Completion date: 2004-09-30.
Top industries in this zip code by the number of employees in 2005:
Wholesale Trade: Farm and Garden Machinery and Equipment Merchant Wholesalers (20-49: 1)
Finance and Insurance: Commercial Banking (20-49: 1)
Educational Services: Elementary and Secondary Schools (10-19: 1, 1-4: 1)
Accommodation and Food Services: Full-Service Restaurants (10-19: 1)
Construction: Tile and Terrazzo Contractors (10-19: 1)
Other Services (except Public Administration): Religious Organizations (5-9: 1, 1-4: 1)
Management of Companies and Enterprises: Offices of Other Holding Companies (5-9: 1)
Fatal accident statistics in 2013:
Fatal accident count: 1
Vehicles involved in fatal accidents: 1
Fatal accidents caused by drunken drivers: 1
Fatalities: 1
Persons involved in fatal accidents: 5
Pedestrians involved in fatal accidents: 0
Fatal accident statistics in 2011:
Fatal accident count: 1
Vehicles involved in fatal accidents: 1
Fatal accidents caused by drunken drivers: 1
Fatalities: 1
Persons involved in fatal accidents: 1
Pedestrians involved in fatal accidents: 0
2002 - 2018 National Fire Incident Reporting System (NFIRS) incidents
Based on the data from the years 2002 - 2018 the average number of fire incidents per year is 9. The highest number of fire incidents - 23 took place in 2008, and the least - 0 in 2004. The data has a rising trend.
When looking into fire subcategories, the most incidents belonged to: Outside Fires (46.7%), and Structure Fires (36.0%).
Fire incident types reported to NFIRS in Zip Code 61864

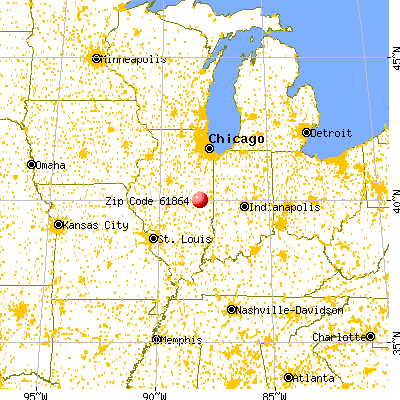


 Nearest zip codes: 61877, 61880, 61852, 61956, 61874, 61863.


 Based on the data from the years 2002 - 2018 the average number of fire incidents per year is 9. The highest number of fire incidents - 23 took place in 2008, and the least - 0 in 2004. The data has a rising trend.
 When looking into fire subcategories, the most incidents belonged to: Outside Fires (46.7%), and Structure Fires (36.0%).