Estimated zip code population in 2022: 809 Zip code population in 2010: 814 Zip code population in 2000: 840
Houses and condos: 346 Renter-occupied apartments: 40
% of renters here:
12%
State:
33%
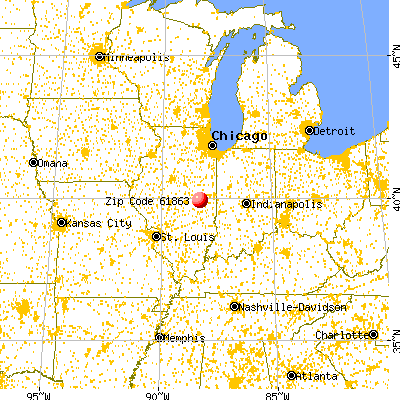
March 2022 cost of living index in zip code 61863: 84.5 (less than average, U.S. average is 100)
Land area: 32.5 sq. mi. Water area: 0.0 sq. mi.
Population density: 25 people per square mile
(very low).
OSM Map
General Map
Google Map
MSN Map
OSM Map
General Map
Google Map
MSN Map
OSM Map
General Map
Google Map
MSN Map
OSM Map
General Map
Google Map
MSN Map
Please wait while loading the map...
Real estate property taxes paid for housing units in 2022:
This zip code:
1.5% ($2,672)
Illinois:
2.0% ($4,912)
Median real estate property taxes paid for housing units with mortgages in 2022: $2,525 (1.5%) Median real estate property taxes paid for housing units with no mortgage in 2022: $2,966 (1.4%)
Business Search- 14 Million verified businesses
Males: 408
(50.4%)
Females: 401
(49.6%)
For population 25 years and over in 61863:
High school or higher: 93.9%
Bachelor's degree or higher: 37.0%
Graduate or professional degree: 12.1%
Unemployed: 7.3%
Mean travel time to work (commute): 23.0 minutes
For population 15 years and over in 61863:
Never married: 22.8%
Now married: 54.5%
Separated: 1.0%
Widowed: 4.2%
Divorced: 17.4%
Zip code 61863 compared to state average:
Black race population percentage significantly below state average.
Hispanic race population percentage significantly below state average.
Foreign-born population percentage significantly below state average.
Renting percentage significantly below state average.
Length of stay since moving in significantly below state average.
Estimated median house/condo value in 2022: $178,151
61863:
$178,151
Illinois:
$251,600
According to our research of Illinois and other state lists, there was 1 registered sex offender living in 61863 zip code as of May 28, 2024. The ratio of all residents to sex offenders in zip code 61863 is 692 to 1. The ratio of registered sex offenders to all residents in this zip code is near the state average.
Median resident age:
This zip code:
42.1 years
Illinois median age:
39.1 years
Average household size:
This zip code:
2.5 people
Illinois:
2.4 people
Averages for the 2020 tax year for zip code 61863, filed in 2021:
Average Adjusted Gross Income (AGI) in 2020: $69,835 (Individual Income Tax Returns)
Here:
$69,835
State:
$82,626
Salary/wage: $53,771 (reported on 81.4% of returns)
Here:
$53,771
State:
$66,640
(% of AGI for various income ranges: 1028.6% for AGIs below $25k, 3326.0% for AGIs $25k-50k, 6028.0% for AGIs $50k-75k, 7557.5% for AGIs $75k-100k, 17474.0% for AGIs $100k-200k)
Taxable interest for individuals: $650 (reported on 32.6% of returns)
This zip code:
$650
Illinois:
$2,376
(% of AGI for various income ranges: 15.0% for AGIs $25k-50k, 32.0% for AGIs $50k-75k, 120.0% for AGIs $100k-200k)
Ordinary dividends: $1,725 (reported on 18.6% of returns)
Here:
$1,725
State:
$9,061
(% of AGI for various income ranges: 7.1% for AGIs below $25k, 74.0% for AGIs $50k-75k, 192.0% for AGIs $100k-200k)
Net capital gain/loss in AGI: +$1,943 (reported on 16.3% of returns)
Here:
+$1,943
State:
+$31,684
(% of AGI for various income ranges: 58.0% for AGIs $50k-75k, 214.0% for AGIs $100k-200k)
Profit/loss from business: +$5,080 (reported on 11.6% of returns)
Here:
+$5,080
State:
+$12,175
(% of AGI for various income ranges: 635.0% for AGIs $75k-100k)
Taxable individual retirement arrangement distribution: $17,200 (reported on 14.0% of returns)
61863:
$17,200
Illinois:
$21,613
(% of AGI for various income ranges: 976.0% for AGIs $50k-75k, 1088.0% for AGIs $100k-200k)
Earned income credit: $3,200 (reported on 9.3% of returns)
Here:
$3,200
State:
$2,311
(% of AGI for various income ranges: 94.3% for AGIs below $25k, 62.0% for AGIs $25k-50k)
Percentage of individuals using paid preparers for their 2020 taxes: 93.0%
Here:
93%
State:
93%
(% for various income ranges: 88.9% for AGIs below $25k, 90.9% for AGIs $25k-50k, 100.0% for AGIs $50k-75k, 100.0% for AGIs $75k-100k, 90.9% for AGIs $100k-200k)
Averages for the 2012 tax year for zip code 61863, filed in 2013:
Average Adjusted Gross Income (AGI) in 2012: $56,938 (Individual Income Tax Returns)
Here:
$56,938
State:
$68,058
Salary/wage: $46,609 (reported on 81.0% of returns)
Here:
$46,609
State:
$55,396
(% of AGI for various income ranges: 65.6% for AGIs below $25k, 74.3% for AGIs $25k-50k, 79.4% for AGIs $50k-75k, 69.7% for AGIs $75k-100k, 53.1% for AGIs $100k-200k)
Taxable interest for individuals: $744 (reported on 42.9% of returns)
This zip code:
$744
Illinois:
$1,969
(% of AGI for various income ranges: 1.2% for AGIs below $25k, 1.3% for AGIs $25k-50k, 0.8% for AGIs $50k-75k, 0.2% for AGIs $75k-100k, 0.3% for AGIs $100k-200k)
Ordinary dividends: $1,178 (reported on 21.4% of returns)
Here:
$1,178
State:
$7,786
(% of AGI for various income ranges: 0.7% for AGIs below $25k, 0.9% for AGIs $50k-75k, 0.6% for AGIs $100k-200k)
Net capital gain/loss in AGI: +$400 (reported on 11.9% of returns)
Here:
+$400
State:
+$22,183
(% of AGI for various income ranges: 0.3% for AGIs $100k-200k)
Profit/loss from business: +$5,180 (reported on 11.9% of returns)
Here:
+$5,180
State:
+$12,903
Taxable individual retirement arrangement distribution: $10,550 (reported on 14.3% of returns)
61863:
$10,550
Illinois:
$17,929
Total itemized deductions: $15,550 (20% of AGI, reported on 33.3% of returns)
Here:
$15,550
State:
$26,433
Here:
19.9% of AGI
State:
19.2% of AGI
(% of AGI for various income ranges: 13.5% for AGIs $25k-50k, 14.5% for AGIs $50k-75k, 7.7% for AGIs $75k-100k, 6.6% for AGIs $100k-200k)
Charity contributions: $2,362 (reported on 19.0% of returns)
Here:
$2,362
State:
$4,525
(% of AGI for various income ranges: 1.2% for AGIs $50k-75k, 1.2% for AGIs $75k-100k, 0.7% for AGIs $100k-200k)
Taxes paid: $5,679 (reported on 33.3% of returns)
61863:
$5,679
State:
$11,968
(% of AGI for various income ranges: 4.3% for AGIs $25k-50k, 4.3% for AGIs $50k-75k, 2.9% for AGIs $75k-100k, 3.2% for AGIs $100k-200k)
Earned income credit: $2,000 (reported on 4.8% of returns)
Here:
$2,000
State:
$2,349
(% of AGI for various income ranges: 3.1% for AGIs below $25k)
Percentage of individuals using paid preparers for their 2012 taxes: 57.1%
Here:
57%
State:
57%
(% for various income ranges: 50.0% for AGIs below $25k, 50.0% for AGIs $25k-50k, 62.5% for AGIs $50k-75k, 71.4% for AGIs $75k-100k, 57.1% for AGIs $100k-200k)
Averages for the 2004 tax year for zip code 61863, filed in 2005:
Average Adjusted Gross Income (AGI) in 2004: $41,995 (Individual Income Tax Returns)
Here:
$41,995
State:
$54,625
Salary/wage: $38,445 (reported on 84.0% of returns)
Here:
$38,445
State:
$46,811
(% of AGI for various income ranges: 78.7% for AGIs below $10k, 72.8% for AGIs $10k-25k, 75.4% for AGIs $25k-50k, 76.8% for AGIs $50k-75k, 80.6% for AGIs $75k-100k, 74.0% for AGIs over 100k)
Taxable interest for individuals: $1,052 (reported on 59.3% of returns)
This zip code:
$1,052
Illinois:
$2,101
(% of AGI for various income ranges: 6.5% for AGIs below $10k, 5.2% for AGIs $10k-25k, 2.3% for AGIs $25k-50k, 1.0% for AGIs $50k-75k, 0.7% for AGIs $75k-100k, 0.4% for AGIs over 100k)
Taxable dividends: $695 (reported on 30.1% of returns)
Here:
$695
State:
$4,306
(% of AGI for various income ranges: 1.0% for AGIs below $10k, 0.8% for AGIs $10k-25k, 0.9% for AGIs $25k-50k, 0.4% for AGIs $50k-75k, 0.4% for AGIs $75k-100k)
Net capital gain/loss: +$76 (reported on 18.6% of returns)
Here:
+$76
State:
+$17,321
(% of AGI for various income ranges: 0.0% for AGIs below $10k, 0.1% for AGIs $25k-50k, -0.1% for AGIs $50k-75k, 0.3% for AGIs $75k-100k)
Profit/loss from business: +$2,151 (reported on 12.5% of returns)
Here:
+$2,151
State:
+$11,771
(% of AGI for various income ranges: 6.0% for AGIs below $10k, 0.2% for AGIs $25k-50k, 0.6% for AGIs $50k-75k, 1.0% for AGIs $75k-100k)
Profit/loss from farming: +$11,900 (reported on 7.1% of returns)
Here:
+$11,900
State:
+$2,327
IRA payment deduction: $1,833 (reported on 2.8% of returns)
61863:
$1,833
Illinois:
$3,087
Total itemized deductions: $11,089 (20% of AGI, reported on 28.9% of returns)
Here:
$11,089
State:
$20,239
Here:
19.8% of AGI
State:
19.5% of AGI
(% of AGI for various income ranges: 13.7% for AGIs $10k-25k, 10.5% for AGIs $25k-50k, 7.5% for AGIs $50k-75k, 5.2% for AGIs $75k-100k, 6.7% for AGIs over 100k)
Charity contributions deductions: $1,812 (3% of AGI, reported on 18.8% of returns)
Here:
$1,812
State:
$3,719
Here:
3.1% of AGI
State:
3.4% of AGI
(% of AGI for various income ranges: 2.2% for AGIs below $10k, 1.2% for AGIs $25k-50k, 0.9% for AGIs $50k-75k, 0.9% for AGIs $75k-100k)
Total tax: $5,203 (reported on 78.8% of returns)
61863:
$5,203
State:
$9,882
(% of AGI for various income ranges: 2.4% for AGIs below $10k, 4.0% for AGIs $10k-25k, 7.6% for AGIs $25k-50k, 9.3% for AGIs $50k-75k, 11.4% for AGIs $75k-100k, 15.7% for AGIs over 100k)
Earned income credit: $1,167 (reported on 4.2% of returns)
Here:
$1,167
State:
$1,788
Percentage of individuals using paid preparers for their 2004 taxes: 61.6%
Here:
62%
State:
61%
(% for various income ranges: 54.9% for AGIs below $10k, 66.7% for AGIs $10k-25k, 62.0% for AGIs $25k-50k, 62.4% for AGIs $50k-75k, 56.9% for AGIs $75k-100k, 84.2% for AGIs over 100k)
Household received Food Stamps/SNAP in the past 12 months: 27 Household did not receive Food Stamps/SNAP in the past 12 months: 296
Women who had a birth in the past 12 months: 4 (4 now married, 0 unmarried) Women who did not have a birth in the past 12 months: 158 (72 now married, 85 unmarried)
Housing units in zip code 61863 with a mortgage: 206 (49 second mortgage, 22 both second mortgage and home equity loan) Median monthly owner costs for units with a mortgage: $1,238 Median monthly owner costs for units without a mortgage: $617
Residents with income below the poverty level in 2022:
This zip code:
5.2%
Whole state:
11.9%
Residents with income below 50% of the poverty level in 2022:
This zip code:
0.2%
Whole state:
5.7%
Median number of rooms in houses and condos:
Here:
6.8
State:
6.4
Median number of rooms in apartments:
Here:
6.6
State:
4.1
Notable locations in this zip code not listed on our city pages
Size of family households: 84 2-persons, 68 3-persons, 61 4-persons, 7 5-persons, 5 6-persons
Size of nonfamily households: 83 1-person, 13 2-persons, 3 4-persons
142 married couples with children.
41 single-parent households (33 men, 8 women).
97.0% of residents of 61863 zip code speak English at home.
2.6% of residents speak Spanish at home (100% very well).
Foreign born population: 10 (1.2%) (90.1% of them are naturalized citizens)
This zip code:
1.2%
Whole state:
14.4%
70%Colombia
62%German
17%American
4%Irish
3%European
1%Polish
1%English
1%Scotch-Irish
Year of entry for the foreign-born population
02010 or later
02000 to 2009
01990 to 1999
8Before 1990
Facilities with environmental interests located in this zip code:
ILLINOIS COB CO (P O BOX 191 in PESOTUM, IL)
STATE MASTER (Illinois EPA Project) - AIR PROGRAM AIR MINOR (AIRS/AFS) Business SIC classification: LIVESTOCK
PESOTUM WTP (RURAL ROUTE 45 in PESOTUM, IL)
STATE MASTER (Illinois EPA Project) - National Pollutant Discharge Elimination System Permit National Pollutant Discharge Elimination System NON-MAJOR (Tracking pollutant discharge elimination systems) - permit Business SIC classification: WATER SUPPLY Alternative names: PESOTUM WTP, VILLAGE OF
PESOTUM GRADE SCHOOL (P O BOX 19 in PESOTUM, IL)
(National Center for Education Statistics) - STATE ID-0901000702001 Organizations: TOLONO C U SCHOOL DIST 7 (SCHOOL DISTRICT)
KAISER AGRICULTURAL CHEMICALS (RTE 45 NORTH in PESOTUM, IL)
(Resource Conservation and Recovery Act (tracking hazardous waste))
ILDOT STA 170 AND 35 (FAI 57 AT PESOTUM in PESOTUM, IL)
(Resource Conservation and Recovery Act (tracking hazardous waste))
DEEDRICH TRUCKING (868 COUNTY RD. 250 N. in PESOTUM, IL)
National Pollutant Discharge Elimination System NON-MAJOR (Tracking pollutant discharge elimination systems) - permit
IDOT (BRG 010-0145 SEC 10-34H in PESOTUM, IL)
Small Quantity Generators, between 100 kg and 1000 kg of hazardous waste/month (Resource Conservation and Recovery Act (tracking hazardous waste)) - notification
Housing units lacking complete plumbing facilities: 0.2% Housing units lacking complete kitchen facilities: 0.2%
54.8%Utility gas
27.2%Electricity
17.5%Bottled, tank, or LP gas
0.6%Other fuel
Population in 1990: 774. Population change in the 1990s: +66 (+8.5%).
Place of birth for U.S.-born residents:
This state: 689
Northeast: 7
Midwest: 56
South: 32
West: 10
80% of the 61863 zip code residents lived in the same house 5 years ago. Out of people who lived in different houses, 60% lived in this county. Out of people who lived in different counties, 50% lived in Illinois.
92% of the 61863 zip code residents lived in the same house 1 year ago. Out of people who lived in different houses, 89% moved from this county. Out of people who lived in different houses, 4% moved from different county within same state.
Private vs. public school enrollment:
Students in private schools in grades 1 to 8 (elementary and middle school): 2
Here:
1.7%
Illinois:
13.3%
Students in private schools in grades 9 to 12 (high school): 1
Here:
6.5%
Illinois:
9.9%
Students in private undergraduate colleges:
Here:
0.0%
Illinois:
27.4%
Occupation by median earnings in the past 12 months ($)
69,012Management occupations
60,173Education, training, and library occupations
54,085Transportation occupations
50,729Business and financial operations occupations
50,333Building and grounds cleaning and maintenance occupations
45,156Construction and extraction occupations
Companies with federal contracts located in this zip code:
P SQUARED TECHNOLOGIES (107 N ELM ST in PESOTUM, IL; small business) : $22,199 in 4 contractsfrom 2004 to 2005
$9,000 with Army for Air Pollution -- Basic Research (R&D). Signed on 2005-03-11. Completion date: 2005-05-20.
$5,000, same as above.Signed on 2005-06-24. Completion date: 2005-05-20.
$4,999 with Army for Water Quality Support Services. Signed on 2004-07-02. Completion date: 2004-09-14.
$3,200 with Army for Air Pollution -- Basic Research (R&D). Signed on 2005-08-08. Completion date: 2005-05-20.
Top industries in this zip code by the number of employees in 2005:
Construction: New Single-Family Housing Construction (except Operative Builders) (5-9 employees: 1 establishment)
Construction: Plumbing, Heating, and Air-Conditioning Contractors (1-4: 1)
Administrative and Support and Waste Management and Remediation Services: Carpet and Upholstery Cleaning Services (1-4: 1)
Other Services (except Public Administration): Religious Organizations (1-4: 1)
Other Services (except Public Administration): General Automotive Repair (1-4: 1)
Construction: Commercial and Institutional Building Construction (1-4: 1)
Fatal accident statistics in 2010:
Fatal accident count: 1
Vehicles involved in fatal accidents: 2
Fatal accidents caused by drunken drivers: 0
Fatalities: 1
Persons involved in fatal accidents: 3
Pedestrians involved in fatal accidents: 0
Home Mortgage Disclosure Act Aggregated Statistics For Year 2009 (Based on 2 partial tracts)
A) FHA, FSA/RHS & VA Home Purchase Loans
B) Conventional Home Purchase Loans
C) Refinancings
D) Home Improvement Loans
F) Non-occupant Loans on < 5 Family Dwellings (A B C & D)
G) Loans On Manufactured Home Dwelling (A B C & D)
Number
Average Value
Number
Average Value
Number
Average Value
Number
Average Value
Number
Average Value
Number
Average Value
LOANS ORIGINATED
13
$120,057
31
$120,235
106
$132,966
7
$55,949
8
$98,092
2
$71,975
APPLICATIONS APPROVED, NOT ACCEPTED
1
$72,850
2
$100,825
9
$126,630
0
$0
0
$0
0
$0
APPLICATIONS DENIED
2
$132,880
5
$107,702
14
$125,843
1
$16,320
1
$60,320
0
$0
APPLICATIONS WITHDRAWN
1
$85,960
1
$78,390
10
$150,275
0
$0
0
$0
0
$0
FILES CLOSED FOR INCOMPLETENESS
1
$62,070
0
$0
3
$193,780
0
$0
0
$0
0
$0
Aggregated Statistics For Year 2008 (Based on 2 partial tracts)
A) FHA, FSA/RHS & VA Home Purchase Loans
B) Conventional Home Purchase Loans
C) Refinancings
D) Home Improvement Loans
F) Non-occupant Loans on < 5 Family Dwellings (A B C & D)
G) Loans On Manufactured Home Dwelling (A B C & D)
Number
Average Value
Number
Average Value
Number
Average Value
Number
Average Value
Number
Average Value
Number
Average Value
LOANS ORIGINATED
11
$136,110
33
$148,058
49
$124,648
15
$41,981
7
$87,087
1
$123,550
APPLICATIONS APPROVED, NOT ACCEPTED
0
$0
4
$156,262
7
$104,987
1
$6,700
1
$41,960
0
$0
APPLICATIONS DENIED
1
$76,060
3
$133,850
17
$127,736
5
$76,172
1
$110,730
0
$0
APPLICATIONS WITHDRAWN
1
$85,960
0
$0
7
$114,063
1
$88,590
0
$0
0
$0
FILES CLOSED FOR INCOMPLETENESS
0
$0
0
$0
2
$171,050
1
$38,460
0
$0
0
$0
Aggregated Statistics For Year 2007 (Based on 2 partial tracts)
A) FHA, FSA/RHS & VA Home Purchase Loans
B) Conventional Home Purchase Loans
C) Refinancings
D) Home Improvement Loans
E) Loans on Dwellings For 5+ Families
F) Non-occupant Loans on < 5 Family Dwellings (A B C & D)
G) Loans On Manufactured Home Dwelling (A B C & D)
Number
Average Value
Number
Average Value
Number
Average Value
Number
Average Value
Number
Average Value
Number
Average Value
Number
Average Value
LOANS ORIGINATED
7
$127,717
43
$123,228
47
$107,775
20
$35,260
1
$257,010
5
$89,926
1
$128,510
APPLICATIONS APPROVED, NOT ACCEPTED
0
$0
2
$93,830
5
$96,978
1
$67,310
0
$0
1
$64,980
0
$0
APPLICATIONS DENIED
2
$81,590
5
$79,844
20
$118,687
6
$46,090
0
$0
1
$85,960
1
$75,180
APPLICATIONS WITHDRAWN
0
$0
1
$106,070
8
$114,630
0
$0
0
$0
0
$0
0
$0
FILES CLOSED FOR INCOMPLETENESS
0
$0
1
$166,970
3
$118,210
0
$0
0
$0
0
$0
0
$0
Aggregated Statistics For Year 2006 (Based on 2 partial tracts)
A) FHA, FSA/RHS & VA Home Purchase Loans
B) Conventional Home Purchase Loans
C) Refinancings
D) Home Improvement Loans
E) Loans on Dwellings For 5+ Families
F) Non-occupant Loans on < 5 Family Dwellings (A B C & D)
G) Loans On Manufactured Home Dwelling (A B C & D)
Number
Average Value
Number
Average Value
Number
Average Value
Number
Average Value
Number
Average Value
Number
Average Value
Number
Average Value
LOANS ORIGINATED
5
$116,618
58
$107,165
41
$100,938
13
$37,478
2
$137,395
7
$72,891
1
$30,600
APPLICATIONS APPROVED, NOT ACCEPTED
0
$0
6
$115,735
5
$82,990
1
$30,310
0
$0
1
$73,720
0
$0
APPLICATIONS DENIED
0
$0
6
$80,523
17
$97,945
6
$77,707
0
$0
1
$36,130
1
$48,370
APPLICATIONS WITHDRAWN
1
$44,000
3
$122,680
10
$121,863
1
$24,480
0
$0
0
$0
0
$0
FILES CLOSED FOR INCOMPLETENESS
0
$0
1
$83,050
4
$82,902
0
$0
0
$0
0
$0
0
$0
Aggregated Statistics For Year 2005 (Based on 2 partial tracts)
A) FHA, FSA/RHS & VA Home Purchase Loans
B) Conventional Home Purchase Loans
C) Refinancings
D) Home Improvement Loans
F) Non-occupant Loans on < 5 Family Dwellings (A B C & D)
G) Loans On Manufactured Home Dwelling (A B C & D)
Number
Average Value
Number
Average Value
Number
Average Value
Number
Average Value
Number
Average Value
Number
Average Value
LOANS ORIGINATED
7
$98,327
56
$101,667
49
$101,568
9
$48,729
6
$102,865
1
$69,350
APPLICATIONS APPROVED, NOT ACCEPTED
1
$83,630
5
$75,182
6
$83,147
1
$85,090
0
$0
1
$31,470
APPLICATIONS DENIED
1
$58,860
6
$88,245
20
$83,326
3
$36,813
2
$48,520
2
$23,165
APPLICATIONS WITHDRAWN
0
$0
3
$95,677
10
$114,899
3
$82,660
0
$0
0
$0
FILES CLOSED FOR INCOMPLETENESS
0
$0
1
$137,830
1
$149,490
0
$0
0
$0
0
$0
Aggregated Statistics For Year 2004 (Based on 2 partial tracts)
A) FHA, FSA/RHS & VA Home Purchase Loans
B) Conventional Home Purchase Loans
C) Refinancings
D) Home Improvement Loans
E) Loans on Dwellings For 5+ Families
F) Non-occupant Loans on < 5 Family Dwellings (A B C & D)
G) Loans On Manufactured Home Dwelling (A B C & D)
Number
Average Value
Number
Average Value
Number
Average Value
Number
Average Value
Number
Average Value
Number
Average Value
Number
Average Value
LOANS ORIGINATED
6
$107,090
54
$99,022
58
$92,469
10
$30,830
1
$68,770
6
$77,415
1
$119,180
APPLICATIONS APPROVED, NOT ACCEPTED
1
$155,610
2
$132,585
5
$97,444
1
$37,590
0
$0
1
$53,620
1
$50,700
APPLICATIONS DENIED
0
$0
4
$88,805
18
$96,502
3
$57,310
0
$0
2
$75,035
1
$33,220
APPLICATIONS WITHDRAWN
1
$81,010
2
$72,120
16
$106,197
1
$9,320
0
$0
1
$22,730
1
$43,710
FILES CLOSED FOR INCOMPLETENESS
0
$0
0
$0
3
$140,163
1
$13,700
0
$0
0
$0
0
$0
Aggregated Statistics For Year 2003 (Based on 2 partial tracts)
A) FHA, FSA/RHS & VA Home Purchase Loans
B) Conventional Home Purchase Loans
C) Refinancings
D) Home Improvement Loans
F) Non-occupant Loans on < 5 Family Dwellings (A B C & D)
Number
Average Value
Number
Average Value
Number
Average Value
Number
Average Value
Number
Average Value
LOANS ORIGINATED
10
$93,510
29
$95,680
140
$91,423
10
$14,570
5
$73,084
APPLICATIONS APPROVED, NOT ACCEPTED
0
$0
1
$112,190
8
$111,388
1
$7,580
0
$0
APPLICATIONS DENIED
1
$168,720
3
$65,370
22
$86,599
2
$18,795
1
$70,810
APPLICATIONS WITHDRAWN
0
$0
3
$102,767
10
$92,461
1
$67,020
0
$0
FILES CLOSED FOR INCOMPLETENESS
0
$0
0
$0
3
$70,033
0
$0
0
$0
Aggregated Statistics For Year 2002 (Based on 2 partial tracts)
A) FHA, FSA/RHS & VA Home Purchase Loans
B) Conventional Home Purchase Loans
C) Refinancings
D) Home Improvement Loans
E) Loans on Dwellings For 5+ Families
F) Non-occupant Loans on < 5 Family Dwellings (A B C & D)
Number
Average Value
Number
Average Value
Number
Average Value
Number
Average Value
Number
Average Value
Number
Average Value
LOANS ORIGINATED
9
$80,038
31
$81,460
84
$88,728
14
$24,977
1
$3,007,250
7
$62,817
APPLICATIONS APPROVED, NOT ACCEPTED
0
$0
2
$55,805
9
$83,017
1
$8,740
0
$0
0
$0
APPLICATIONS DENIED
0
$0
6
$34,872
20
$77,702
4
$35,550
0
$0
0
$0
APPLICATIONS WITHDRAWN
1
$63,820
3
$90,430
6
$63,720
0
$0
0
$0
0
$0
FILES CLOSED FOR INCOMPLETENESS
0
$0
0
$0
5
$71,976
1
$32,350
0
$0
0
$0
Aggregated Statistics For Year 2001 (Based on 2 partial tracts)
A) FHA, FSA/RHS & VA Home Purchase Loans
B) Conventional Home Purchase Loans
C) Refinancings
D) Home Improvement Loans
E) Loans on Dwellings For 5+ Families
F) Non-occupant Loans on < 5 Family Dwellings (A B C & D)
Number
Average Value
Number
Average Value
Number
Average Value
Number
Average Value
Number
Average Value
Number
Average Value
LOANS ORIGINATED
6
$84,020
27
$82,920
71
$87,252
12
$24,211
1
$113,350
3
$133,560
APPLICATIONS APPROVED, NOT ACCEPTED
0
$0
1
$79,840
3
$65,857
2
$21,855
0
$0
0
$0
APPLICATIONS DENIED
0
$0
8
$34,931
13
$63,749
5
$12,880
0
$0
1
$9,910
APPLICATIONS WITHDRAWN
1
$42,250
2
$70,225
9
$75,958
2
$35,405
0
$0
0
$0
FILES CLOSED FOR INCOMPLETENESS
0
$0
0
$0
2
$105,925
0
$0
0
$0
0
$0
Aggregated Statistics For Year 2000 (Based on 2 partial tracts)
A) FHA, FSA/RHS & VA Home Purchase Loans
B) Conventional Home Purchase Loans
C) Refinancings
D) Home Improvement Loans
F) Non-occupant Loans on < 5 Family Dwellings (A B C & D)
Number
Average Value
Number
Average Value
Number
Average Value
Number
Average Value
Number
Average Value
LOANS ORIGINATED
6
$79,212
24
$75,424
19
$77,052
17
$12,736
3
$63,233
APPLICATIONS APPROVED, NOT ACCEPTED
0
$0
2
$41,380
2
$46,335
1
$19,820
0
$0
APPLICATIONS DENIED
0
$0
5
$37,300
12
$47,935
3
$17,193
1
$18,940
APPLICATIONS WITHDRAWN
0
$0
1
$66,150
6
$57,892
0
$0
0
$0
FILES CLOSED FOR INCOMPLETENESS
0
$0
0
$0
3
$64,497
0
$0
0
$0
Aggregated Statistics For Year 1999 (Based on 1 partial tract)
A) FHA, FSA/RHS & VA Home Purchase Loans
B) Conventional Home Purchase Loans
C) Refinancings
D) Home Improvement Loans
F) Non-occupant Loans on < 5 Family Dwellings (A B C & D)
Detailed PMIC statistics for the following Tracts:0109.00
2005 - 2018 National Fire Incident Reporting System (NFIRS) incidents
Based on the data from the years 2005 - 2018 the average number of fire incidents per year is 11. The highest number of fire incidents - 20 took place in 2008, and the least - 5 in 2010. The data has a rising trend.
When looking into fire subcategories, the most incidents belonged to: Outside Fires (47.3%), and Structure Fires (27.3%).
Fire incident types reported to NFIRS in Zip Code 61863


 Nearest zip codes: 61880, 61953, 61872, 61874, 61864, 61956.


 Based on the data from the years 2005 - 2018 the average number of fire incidents per year is 11. The highest number of fire incidents - 20 took place in 2008, and the least - 5 in 2010. The data has a rising trend.
 When looking into fire subcategories, the most incidents belonged to: Outside Fires (47.3%), and Structure Fires (27.3%).