Estimated zip code population in 2022: 1,212 Zip code population in 2010: 1,684 Zip code population in 2000: 1,882
Houses and condos: 647 Renter-occupied apartments: 73
% of renters here:
13%
State:
33%
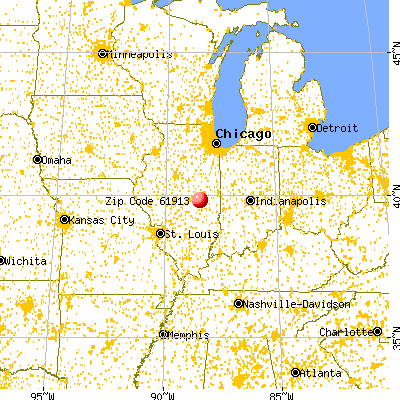
March 2022 cost of living index in zip code 61913: 84.2 (less than average, U.S. average is 100)
Land area: 41.7 sq. mi. Water area: 0.0 sq. mi.
Population density: 29 people per square mile
(very low).
OSM Map
General Map
Google Map
MSN Map
OSM Map
General Map
Google Map
MSN Map
OSM Map
General Map
Google Map
MSN Map
OSM Map
General Map
Google Map
MSN Map
Please wait while loading the map...
Real estate property taxes paid for housing units in 2022:
This zip code:
1.7% ($2,007)
Illinois:
2.0% ($4,912)
Median real estate property taxes paid for housing units with mortgages in 2022: $2,211 (1.6%) Median real estate property taxes paid for housing units with no mortgage in 2022: $1,669 (1.6%)
Business Search- 14 Million verified businesses
Males: 521
(43.1%)
Females: 690
(56.9%)
For population 25 years and over in 61913:
High school or higher: 93.7%
Bachelor's degree or higher: 12.6%
Graduate or professional degree: 4.3%
Unemployed: 3.0%
Mean travel time to work (commute): 23.6 minutes
For population 15 years and over in 61913:
Never married: 22.8%
Now married: 63.3%
Separated: 3.2%
Widowed: 4.7%
Divorced: 5.9%
Zip code 61913 compared to state average:
Median house value below state average.
Black race population percentage significantly below state average.
Hispanic race population percentage significantly below state average.
Median age above state average.
Foreign-born population percentage significantly below state average.
Renting percentage significantly below state average.
Length of stay since moving in significantly above state average.
Number of college students below state average.
Percentage of population with a bachelor's degree or higher significantly below state average.
Averages for the 2020 tax year for zip code 61913, filed in 2021:
Average Adjusted Gross Income (AGI) in 2020: $55,614 (Individual Income Tax Returns)
Here:
$55,614
State:
$82,626
Salary/wage: $46,591 (reported on 81.0% of returns)
Here:
$46,591
State:
$66,640
(% of AGI for various income ranges: 1198.2% for AGIs below $25k, 3885.0% for AGIs $25k-50k, 6330.0% for AGIs $50k-75k, 7663.3% for AGIs $75k-100k, 18783.3% for AGIs $100k-200k)
Taxable interest for individuals: $600 (reported on 34.2% of returns)
This zip code:
$600
Illinois:
$2,376
(% of AGI for various income ranges: 8.2% for AGIs below $25k, 10.0% for AGIs $25k-50k, 11.1% for AGIs $50k-75k, 21.7% for AGIs $75k-100k, 181.7% for AGIs $100k-200k)
Ordinary dividends: $2,273 (reported on 13.9% of returns)
Here:
$2,273
State:
$9,061
(% of AGI for various income ranges: 27.1% for AGIs below $25k, 53.3% for AGIs $50k-75k, 260.0% for AGIs $100k-200k)
Net capital gain/loss in AGI: +$3,220 (reported on 12.7% of returns)
Here:
+$3,220
State:
+$31,684
(% of AGI for various income ranges: 15.9% for AGIs below $25k, 102.2% for AGIs $50k-75k, 338.3% for AGIs $100k-200k)
Profit/loss from business: +$9,130 (reported on 12.7% of returns)
Here:
+$9,130
State:
+$12,175
(% of AGI for various income ranges: 94.7% for AGIs below $25k, 310.0% for AGIs $25k-50k, 426.7% for AGIs $75k-100k)
Taxable individual retirement arrangement distribution: $13,544 (reported on 11.4% of returns)
61913:
$13,544
Illinois:
$21,613
(% of AGI for various income ranges: 190.0% for AGIs below $25k, 487.8% for AGIs $50k-75k, 761.7% for AGIs $100k-200k)
Earned income credit: $2,067 (reported on 15.2% of returns)
Here:
$2,067
State:
$2,311
(% of AGI for various income ranges: 75.9% for AGIs below $25k, 74.4% for AGIs $25k-50k)
Percentage of individuals using paid preparers for their 2020 taxes: 97.5%
Here:
97%
State:
93%
(% for various income ranges: 96.0% for AGIs below $25k, 95.5% for AGIs $25k-50k, 100.0% for AGIs $50k-75k, 100.0% for AGIs $75k-100k, 100.0% for AGIs $100k-200k)
Averages for the 2012 tax year for zip code 61913, filed in 2013:
Average Adjusted Gross Income (AGI) in 2012: $47,376 (Individual Income Tax Returns)
Here:
$47,376
State:
$68,058
Salary/wage: $39,317 (reported on 81.2% of returns)
Here:
$39,317
State:
$55,396
(% of AGI for various income ranges: 67.7% for AGIs below $25k, 75.9% for AGIs $25k-50k, 76.0% for AGIs $50k-75k, 73.8% for AGIs $75k-100k, 52.4% for AGIs $100k-200k)
Taxable interest for individuals: $800 (reported on 41.2% of returns)
This zip code:
$800
Illinois:
$1,969
(% of AGI for various income ranges: 2.0% for AGIs below $25k, 0.7% for AGIs $25k-50k, 0.6% for AGIs $50k-75k, 0.1% for AGIs $75k-100k, 0.7% for AGIs $100k-200k)
Ordinary dividends: $2,117 (reported on 15.0% of returns)
Here:
$2,117
State:
$7,786
(% of AGI for various income ranges: 1.4% for AGIs below $25k, 1.6% for AGIs $50k-75k, 0.7% for AGIs $100k-200k)
Net capital gain/loss in AGI: +$743 (reported on 8.8% of returns)
Here:
+$743
State:
+$22,183
Profit/loss from business: +$5,864 (reported on 13.8% of returns)
Here:
+$5,864
State:
+$12,903
(% of AGI for various income ranges: 3.7% for AGIs below $25k, 2.6% for AGIs $25k-50k, 3.5% for AGIs $50k-75k, 0.7% for AGIs $75k-100k)
Taxable individual retirement arrangement distribution: $12,150 (reported on 12.5% of returns)
61913:
$12,150
Illinois:
$17,929
(% of AGI for various income ranges: 6.2% for AGIs below $25k, 3.5% for AGIs $25k-50k, 3.8% for AGIs $50k-75k, 6.0% for AGIs $75k-100k)
Total itemized deductions: $17,133 (19% of AGI, reported on 18.8% of returns)
Here:
$17,133
State:
$26,433
Here:
19.0% of AGI
State:
19.2% of AGI
(% of AGI for various income ranges: 7.1% for AGIs $25k-50k, 6.5% for AGIs $50k-75k, 7.3% for AGIs $75k-100k, 8.5% for AGIs $100k-200k)
Charity contributions: $3,791 (reported on 13.8% of returns)
Here:
$3,791
State:
$4,525
(% of AGI for various income ranges: 1.8% for AGIs below $25k, 0.5% for AGIs $50k-75k, 1.3% for AGIs $75k-100k, 1.8% for AGIs $100k-200k)
Taxes paid: $6,060 (reported on 18.8% of returns)
61913:
$6,060
State:
$11,968
(% of AGI for various income ranges: 1.9% for AGIs $25k-50k, 1.5% for AGIs $50k-75k, 3.0% for AGIs $75k-100k, 3.7% for AGIs $100k-200k)
Earned income credit: $1,985 (reported on 16.2% of returns)
Here:
$1,985
State:
$2,349
(% of AGI for various income ranges: 5.0% for AGIs below $25k, 1.0% for AGIs $25k-50k)
Percentage of individuals using paid preparers for their 2012 taxes: 72.5%
Here:
72%
State:
57%
(% for various income ranges: 67.7% for AGIs below $25k, 71.4% for AGIs $25k-50k, 75.0% for AGIs $50k-75k, 75.0% for AGIs $75k-100k, 87.5% for AGIs $100k-200k)
Averages for the 2004 tax year for zip code 61913, filed in 2005:
Average Adjusted Gross Income (AGI) in 2004: $34,731 (Individual Income Tax Returns)
Here:
$34,731
State:
$54,625
Salary/wage: $30,647 (reported on 81.5% of returns)
Here:
$30,647
State:
$46,811
(% of AGI for various income ranges: 76.2% for AGIs below $10k, 65.5% for AGIs $10k-25k, 76.8% for AGIs $25k-50k, 77.2% for AGIs $50k-75k, 74.1% for AGIs $75k-100k, 52.9% for AGIs over 100k)
Taxable interest for individuals: $1,322 (reported on 45.6% of returns)
This zip code:
$1,322
Illinois:
$2,101
(% of AGI for various income ranges: 5.5% for AGIs below $10k, 3.5% for AGIs $10k-25k, 1.8% for AGIs $25k-50k, 1.6% for AGIs $50k-75k, 0.9% for AGIs $75k-100k, 0.4% for AGIs over 100k)
Taxable dividends: $994 (reported on 17.4% of returns)
Here:
$994
State:
$4,306
(% of AGI for various income ranges: 1.0% for AGIs below $10k, 0.6% for AGIs $10k-25k, 0.4% for AGIs $25k-50k, 0.5% for AGIs $50k-75k, 0.5% for AGIs $75k-100k, 0.5% for AGIs over 100k)
Net capital gain/loss: +$736 (reported on 14.1% of returns)
Here:
+$736
State:
+$17,321
(% of AGI for various income ranges: -1.3% for AGIs below $10k, -0.1% for AGIs $10k-25k, 0.6% for AGIs $25k-50k, 0.4% for AGIs $50k-75k, -0.2% for AGIs $75k-100k, 0.8% for AGIs over 100k)
Profit/loss from business: +$4,242 (reported on 14.4% of returns)
Here:
+$4,242
State:
+$11,771
(% of AGI for various income ranges: 8.1% for AGIs below $10k, 5.8% for AGIs $10k-25k, 1.9% for AGIs $25k-50k, 1.8% for AGIs $50k-75k, -0.2% for AGIs $75k-100k, -1.1% for AGIs over 100k)
Profit/loss from farming: +$8,606 (reported on 3.7% of returns)
Here:
+$8,606
State:
+$2,327
IRA payment deduction: $2,933 (reported on 1.7% of returns)
61913:
$2,933
Illinois:
$3,087
Total itemized deductions: $13,903 (23% of AGI, reported on 16.3% of returns)
Here:
$13,903
State:
$20,239
Here:
23.1% of AGI
State:
19.5% of AGI
(% of AGI for various income ranges: 5.7% for AGIs $10k-25k, 6.9% for AGIs $25k-50k, 6.8% for AGIs $50k-75k, 8.1% for AGIs $75k-100k, 5.3% for AGIs over 100k)
Charity contributions deductions: $2,923 (5% of AGI, reported on 13.2% of returns)
Here:
$2,923
State:
$3,719
Here:
5.1% of AGI
State:
3.4% of AGI
(% of AGI for various income ranges: 0.8% for AGIs $10k-25k, 0.9% for AGIs $25k-50k, 1.2% for AGIs $50k-75k, 2.3% for AGIs $75k-100k, 0.5% for AGIs over 100k)
Total tax: $4,427 (reported on 72.1% of returns)
61913:
$4,427
State:
$9,882
(% of AGI for various income ranges: 2.4% for AGIs below $10k, 4.0% for AGIs $10k-25k, 7.1% for AGIs $25k-50k, 8.9% for AGIs $50k-75k, 10.5% for AGIs $75k-100k, 18.3% for AGIs over 100k)
Earned income credit: $1,711 (reported on 15.2% of returns)
Here:
$1,711
State:
$1,788
Percentage of individuals using paid preparers for their 2004 taxes: 70.9%
Here:
71%
State:
61%
(% for various income ranges: 61.8% for AGIs below $10k, 70.3% for AGIs $10k-25k, 77.2% for AGIs $25k-50k, 69.7% for AGIs $50k-75k, 78.9% for AGIs $75k-100k, 80.6% for AGIs over 100k)
Household received Food Stamps/SNAP in the past 12 months: 48 Household did not receive Food Stamps/SNAP in the past 12 months: 499
Women who had a birth in the past 12 months: 4 (0 now married, 4 unmarried) Women who did not have a birth in the past 12 months: 257 (138 now married, 118 unmarried)
Housing units in zip code 61913 with a mortgage: 211 (17 second mortgage, 12 both second mortgage and home equity loan) Median monthly owner costs for units with a mortgage: $1,166 Median monthly owner costs for units without a mortgage: $479
Residents with income below the poverty level in 2022:
This zip code:
8.2%
Whole state:
11.9%
Residents with income below 50% of the poverty level in 2022:
This zip code:
5.4%
Whole state:
5.7%
Median number of rooms in houses and condos:
Here:
6.2
State:
6.4
Median number of rooms in apartments:
Here:
3.6
State:
4.1
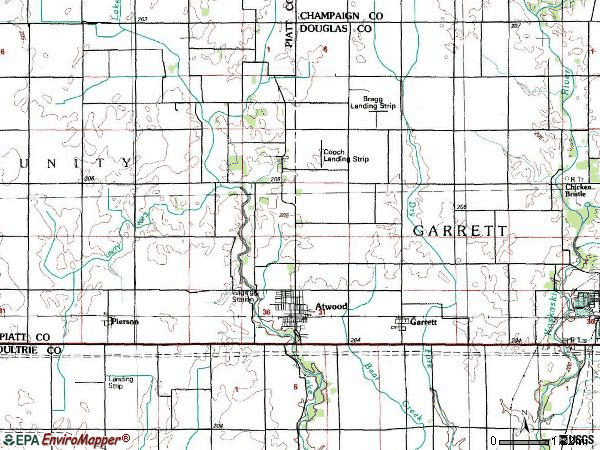
Notable locations in this zip code not listed on our city pages
Churches in zip code 61913 include: First Baptist Church (A), Lake Fork United Church of Christ (B), Macedonia Church (C), United Church of Atwood (D). Display/hide their locations on the map
Size of family households: 201 2-persons, 133 3-persons, 30 4-persons, 13 5-persons, 4 6-persons
Size of nonfamily households: 158 1-person, 9 2-persons
148 married couples with children.
72 single-parent households (36 men, 36 women).
96.5% of residents of 61913 zip code speak English at home.
1.1% of residents speak Spanish at home (54% very well, 46% not well).
1.6% of residents speak other Indo-European language at home (100% very well).
0.8% of residents speak Asian or Pacific Island language at home (100% well).
Foreign born population: 16 (1.3%) (37.7% of them are naturalized citizens)
This zip code:
1.3%
Whole state:
14.4%
44%Malaysia
19%Austria
19%Nepal
12%Bhutan
34%German
16%Irish
11%English
10%American
4%Swedish
1%Italian
1%Polish
Year of entry for the foreign-born population
22010 or later
02000 to 2009
01990 to 1999
17Before 1990
Facilities with environmental interests located in this zip code:
ATWOOD-HAMMOND HIGH SCHOOL (PO BOX 890 in ATWOOD, IL)
STATE MASTER (Illinois EPA Project) - HAZARDOUS WASTE PROGRAM (Geographic Names Information System) (National Center for Education Statistics) - STATE ID-3907403900001 Small Quantity Generators, between 100 kg and 1000 kg of hazardous waste/month (Resource Conservation and Recovery Act (tracking hazardous waste)) - notification Organizations: ATWOOD-HAMMOND CU SCH DIST #39 (CONTACT/OWNER)
, ATWOOD HAMMOND C U SCH DIST 39 (SCHOOL DISTRICT)
ATWOOD STP (402 W. BIRCH LANE in ATWOOD, IL)
STATE MASTER (Illinois EPA Project) - National Pollutant Discharge Elimination System Permit National Pollutant Discharge Elimination System NON-MAJOR (Tracking pollutant discharge elimination systems) - permit National Pollutant Discharge Elimination System NON-MAJOR (Tracking pollutant discharge elimination systems) - permit Business SIC classification: SEWERAGE SYSTEMS Alternative names: ATWOOD STP, VILLAGE OF, ATWOOD, VILLAGE OF
PATIENT EQUIP REBUILD INC (RT 36 in ATWOOD, IL)
STATE MASTER (Illinois EPA Project) - SOLID WASTE PROGRAM, HAZARDOUS WASTE PROGRAM Conditionally Exempt Small Quantity Generators, less than 100 kg/month of hazardous waste (Resource Conservation and Recovery Act (tracking hazardous waste)) Organizations: APIL PATIENT (CONTACT/OWNER)
Alternative names: PATIENT EQUIPMENT REBUILD INC
ATWOOD-HAMMOND ELEM SCHOOL (PO BOX 860 in ATWOOD, IL)
(National Center for Education Statistics) - STATE ID-3907403902003 Organizations: ATWOOD HAMMOND C U SCH DIST 39 (SCHOOL DISTRICT)
Housing units lacking complete plumbing facilities: 3.5% Housing units lacking complete kitchen facilities: 5.2%
63.7%Utility gas
24.2%Electricity
10.7%Bottled, tank, or LP gas
0.7%Coal or coke
0.7%Wood
Population in 1990: 2,455.
Place of birth for U.S.-born residents:
This state: 1,015
Northeast: 8
Midwest: 60
South: 64
West: 38
69% of the 61913 zip code residents lived in the same house 5 years ago. Out of people who lived in different houses, 43% lived in this county. Out of people who lived in different counties, 50% lived in Illinois.
94% of the 61913 zip code residents lived in the same house 1 year ago. Out of people who lived in different houses, 29% moved from this county. Out of people who lived in different houses, 56% moved from different county within same state. Out of people who lived in different houses, 8% moved from different state. Out of people who lived in different houses, 8% moved from abroad.
Private vs. public school enrollment:
Students in private schools in grades 1 to 8 (elementary and middle school): 1
Here:
1.0%
Illinois:
13.3%
Students in private schools in grades 9 to 12 (high school):
Here:
1.5%
Illinois:
9.9%
Students in private undergraduate colleges:
Here:
0.0%
Illinois:
27.4%
Occupation by median earnings in the past 12 months ($)
114,153Material moving occupations
92,038Life, physical, and social science occupations
76,060Management occupations
64,833Building and grounds cleaning and maintenance occupations
58,917Construction and extraction occupations
57,148Business and financial operations occupations
Top industries in this zip code by the number of employees in 2005:
Wholesale Trade: Farm and Garden Machinery and Equipment Merchant Wholesalers (20-49 employees: 2 establishments)
Accommodation and Food Services: Full-Service Restaurants (10-19: 1)
Construction: Electrical Contractors (5-9: 1)
Wholesale Trade: Industrial Machinery and Equipment Merchant Wholesalers (5-9: 1)
Finance and Insurance: Commercial Banking (5-9: 1)
Professional, Scientific, and Technical Services: Tax Preparation Services (5-9: 1)
Fatal accident statistics in 2014:
Fatal accident count: 1
Vehicles involved in fatal accidents: 1
Fatal accidents caused by drunken drivers: 0
Fatalities: 1
Persons involved in fatal accidents: 1
Pedestrians involved in fatal accidents: 0
Fatal accident statistics in 2013:
Fatal accident count: 1
Vehicles involved in fatal accidents: 2
Fatal accidents caused by drunken drivers: 1
Fatalities: 1
Persons involved in fatal accidents: 2
Pedestrians involved in fatal accidents: 0
2002 - 2018 National Fire Incident Reporting System (NFIRS) incidents
Based on the data from the years 2002 - 2018 the average number of fire incidents per year is 11. The highest number of fire incidents - 22 took place in 2010, and the least - 0 in 2008. The data has a declining trend.
When looking into fire subcategories, the most incidents belonged to: Structure Fires (41.9%), and Outside Fires (32.4%).
Fire incident types reported to NFIRS in Zip Code 61913


 Nearest zip codes: 61911, 61813, 61851, 61872, 61929, 61953.


 Based on the data from the years 2002 - 2018 the average number of fire incidents per year is 11. The highest number of fire incidents - 22 took place in 2010, and the least - 0 in 2008. The data has a declining trend.
 When looking into fire subcategories, the most incidents belonged to: Structure Fires (41.9%), and Outside Fires (32.4%).