Estimated zip code population in 2022: 535 Zip code population in 2010: 760 Zip code population in 2000: 712
Houses and condos: 260 Renter-occupied apartments: 15
% of renters here:
6%
State:
33%
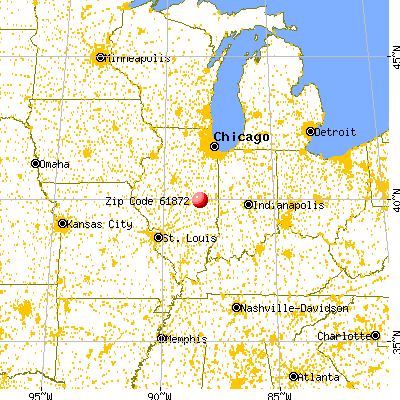
March 2022 cost of living index in zip code 61872: 84.3 (less than average, U.S. average is 100)
Land area: 32.8 sq. mi. Water area: 0.1 sq. mi.
Population density: 16 people per square mile
(very low).
OSM Map
General Map
Google Map
MSN Map
OSM Map
General Map
Google Map
MSN Map
OSM Map
General Map
Google Map
MSN Map
OSM Map
General Map
Google Map
MSN Map
Please wait while loading the map...
Real estate property taxes paid for housing units in 2022:
This zip code:
1.7% ($2,738)
Illinois:
2.0% ($4,912)
Median real estate property taxes paid for housing units with mortgages in 2022: $4,040 (1.6%) Median real estate property taxes paid for housing units with no mortgage in 2022: $2,558 (1.8%)
Averages for the 2020 tax year for zip code 61872, filed in 2021:
Average Adjusted Gross Income (AGI) in 2020: $64,589 (Individual Income Tax Returns)
Here:
$64,589
State:
$82,626
Salary/wage: $48,834 (reported on 78.4% of returns)
Here:
$48,834
State:
$66,640
(% of AGI for various income ranges: 1288.8% for AGIs below $25k, 3227.5% for AGIs $25k-50k, 6146.7% for AGIs $50k-75k, 7156.7% for AGIs $75k-100k, 16395.0% for AGIs $100k-200k)
Taxable interest for individuals: $825 (reported on 32.4% of returns)
This zip code:
$825
Illinois:
$2,376
(% of AGI for various income ranges: 8.8% for AGIs below $25k, 10.0% for AGIs $25k-50k, 70.0% for AGIs $75k-100k, 157.5% for AGIs $100k-200k)
Ordinary dividends: $3,029 (reported on 18.9% of returns)
Here:
$3,029
State:
$9,061
(% of AGI for various income ranges: 82.5% for AGIs $25k-50k, 365.0% for AGIs $100k-200k)
Net capital gain/loss in AGI: +$11,340 (reported on 13.5% of returns)
Here:
+$11,340
State:
+$31,684
(% of AGI for various income ranges: 3.8% for AGIs below $25k, 1410.0% for AGIs $100k-200k)
Profit/loss from business: +$5,825 (reported on 10.8% of returns)
Here:
+$5,825
State:
+$12,175
(% of AGI for various income ranges: 97.5% for AGIs below $25k, 516.7% for AGIs $50k-75k)
Taxable individual retirement arrangement distribution: $9,250 (reported on 10.8% of returns)
61872:
$9,250
Illinois:
$21,613
(% of AGI for various income ranges: 1233.3% for AGIs $50k-75k)
Earned income credit: $1,740 (reported on 13.5% of returns)
Here:
$1,740
State:
$2,311
(% of AGI for various income ranges: 108.7% for AGIs below $25k)
Percentage of individuals using paid preparers for their 2020 taxes: 91.9%
Here:
92%
State:
93%
(% for various income ranges: 90.9% for AGIs below $25k, 100.0% for AGIs $25k-50k, 80.0% for AGIs $50k-75k, 100.0% for AGIs $75k-100k, 87.5% for AGIs $100k-200k)
Averages for the 2012 tax year for zip code 61872, filed in 2013:
Average Adjusted Gross Income (AGI) in 2012: $53,837 (Individual Income Tax Returns)
Here:
$53,837
State:
$68,058
Salary/wage: $39,889 (reported on 80.0% of returns)
Here:
$39,889
State:
$55,396
(% of AGI for various income ranges: 72.4% for AGIs below $25k, 69.6% for AGIs $25k-50k, 75.8% for AGIs $50k-75k, 60.5% for AGIs $75k-100k, 40.8% for AGIs $100k-200k)
Taxable interest for individuals: $862 (reported on 37.1% of returns)
This zip code:
$862
Illinois:
$1,969
(% of AGI for various income ranges: 0.5% for AGIs $25k-50k, 0.4% for AGIs $50k-75k, 0.5% for AGIs $75k-100k, 0.9% for AGIs $100k-200k)
Ordinary dividends: $1,157 (reported on 20.0% of returns)
Here:
$1,157
State:
$7,786
Net capital gain/loss in AGI: +$900 (reported on 11.4% of returns)
Here:
+$900
State:
+$22,183
Profit/loss from business: +$6,020 (reported on 14.3% of returns)
Here:
+$6,020
State:
+$12,903
Taxable individual retirement arrangement distribution: $10,733 (reported on 8.6% of returns)
61872:
$10,733
Illinois:
$17,929
Total itemized deductions: $15,167 (18% of AGI, reported on 25.7% of returns)
Here:
$15,167
State:
$26,433
Here:
18.4% of AGI
State:
19.2% of AGI
(% of AGI for various income ranges: 19.2% for AGIs below $25k, 14.5% for AGIs $50k-75k, 8.2% for AGIs $100k-200k)
Charity contributions: $2,500 (reported on 14.3% of returns)
Here:
$2,500
State:
$4,525
Taxes paid: $6,367 (reported on 25.7% of returns)
61872:
$6,367
State:
$11,968
Earned income credit: $1,800 (reported on 14.3% of returns)
Here:
$1,800
State:
$2,349
(% of AGI for various income ranges: 6.7% for AGIs below $25k)
Percentage of individuals using paid preparers for their 2012 taxes: 57.1%
Here:
57%
State:
57%
(% for various income ranges: 45.5% for AGIs below $25k, 62.5% for AGIs $25k-50k, 57.1% for AGIs $50k-75k, 60.0% for AGIs $75k-100k, 75.0% for AGIs $100k-200k)
Averages for the 2004 tax year for zip code 61872, filed in 2005:
Average Adjusted Gross Income (AGI) in 2004: $38,779 (Individual Income Tax Returns)
Here:
$38,779
State:
$54,625
Salary/wage: $33,231 (reported on 84.0% of returns)
Here:
$33,231
State:
$46,811
(% of AGI for various income ranges: 106.7% for AGIs below $10k, 71.4% for AGIs $10k-25k, 77.7% for AGIs $25k-50k, 79.2% for AGIs $50k-75k, 79.4% for AGIs $75k-100k, 41.1% for AGIs over 100k)
Taxable interest for individuals: $1,022 (reported on 47.9% of returns)
This zip code:
$1,022
Illinois:
$2,101
(% of AGI for various income ranges: 2.4% for AGIs below $10k, 0.5% for AGIs $10k-25k, 0.9% for AGIs $25k-50k, 1.0% for AGIs $50k-75k, 0.2% for AGIs $75k-100k, 3.4% for AGIs over 100k)
Taxable dividends: $537 (reported on 21.8% of returns)
Here:
$537
State:
$4,306
(% of AGI for various income ranges: 1.2% for AGIs below $10k, 0.5% for AGIs $25k-50k, 0.4% for AGIs $50k-75k, 0.2% for AGIs over 100k)
Net capital gain/loss: +$476 (reported on 11.2% of returns)
Here:
+$476
State:
+$17,321
Profit/loss from business: +$1,578 (reported on 12.0% of returns)
Here:
+$1,578
State:
+$11,771
Profit/loss from farming: +$18,789 (reported on 5.1% of returns)
Here:
+$18,789
State:
+$2,327
Total itemized deductions: $13,768 (19% of AGI, reported on 18.4% of returns)
Here:
$13,768
State:
$20,239
Here:
18.9% of AGI
State:
19.5% of AGI
(% of AGI for various income ranges: 7.4% for AGIs $25k-50k, 6.4% for AGIs $50k-75k, 6.3% for AGIs $75k-100k, 10.0% for AGIs over 100k)
Charity contributions deductions: $2,286 (3% of AGI, reported on 14.9% of returns)
Here:
$2,286
State:
$3,719
Here:
2.9% of AGI
State:
3.4% of AGI
Total tax: $4,826 (reported on 79.3% of returns)
61872:
$4,826
State:
$9,882
(% of AGI for various income ranges: 4.3% for AGIs below $10k, 4.8% for AGIs $10k-25k, 7.6% for AGIs $25k-50k, 9.0% for AGIs $50k-75k, 12.0% for AGIs $75k-100k, 16.4% for AGIs over 100k)
Earned income credit: $1,806 (reported on 9.6% of returns)
Here:
$1,806
State:
$1,788
Percentage of individuals using paid preparers for their 2004 taxes: 58.2%
Here:
58%
State:
61%
(% for various income ranges: 55.4% for AGIs below $10k, 61.0% for AGIs $10k-25k, 53.1% for AGIs $25k-50k, 62.3% for AGIs $50k-75k, 45.8% for AGIs $75k-100k, 84.2% for AGIs over 100k)
Size of family households: 130 2-persons, 15 3-persons, 23 4-persons, 2 5-persons, 1 6-persons, 1 7-or-more-persons
Size of nonfamily households: 65 1-person, 13 2-persons
52 married couples with children.
16 single-parent households (7 men, 9 women).
93.0% of residents of 61872 zip code speak English at home.
1.1% of residents speak Spanish at home (100% very well).
7.0% of residents speak Asian or Pacific Island language at home (100% well).
Foreign born population: 33 (6.3%) (5.9% of them are naturalized citizens)
This zip code:
6.3%
Whole state:
14.4%
82%Taiwan
34%German
15%English
12%American
4%Scotch-Irish
3%Irish
Year of entry for the foreign-born population
02010 or later
12000 to 2009
301990 to 1999
0Before 1990
Facilities with environmental interests located in this zip code:
GRAND PRAIRIE COOP INC (118 E MARKET ST in SADORUS, IL)
STATE MASTER (Illinois EPA Project) - AIR PROGRAM, SOLID WASTE PROGRAM AIR MINOR (AIRS/AFS) CRITERIA AND HAZARDOUS AIR POLLUTANT INVENTORY (Inventory of air pollution sources) Business SIC classification: GRAIN AND FIELD BEANS Alternative names: GRAND PRAIRIE COOP INCORPORATED SADORUS
HILLARD OIL CO (CITY OF SADORUS in SADORUS, IL)
STATE MASTER (Illinois EPA Project) - AIR PROGRAM AIR MINOR (AIRS/AFS) CRITERIA AND HAZARDOUS AIR POLLUTANT INVENTORY (Inventory of air pollution sources) Business SIC classification: PETROLEUM BULK STATIONS AND TERMINALS
ILLINI FS INC (CITY OF in SADORUS, IL)
STATE MASTER (Illinois EPA Project) - AIR PROGRAM AIR MINOR (AIRS/AFS) Business SIC classification: PETROLEUM BULK STATIONS AND TERMINALS
DEEDRICK MACHINE (105 MARKET PO BOX 118 in SADORUS, IL)
STATE MASTER (Illinois EPA Project) - SOLID WASTE PROGRAM, HAZARDOUS WASTE PROGRAM Conditionally Exempt Small Quantity Generators, less than 100 kg/month of hazardous waste (Resource Conservation and Recovery Act (tracking hazardous waste)) - notification TRANSPORTER (Resource Conservation and Recovery Act (tracking hazardous waste)) - notification Organizations: DEEDRICK JOHN (CONTACT/OWNER)
SADORUS WTP (115 EAST MARKET STREET in SADORUS, IL)
STATE MASTER (Illinois EPA Project) - National Pollutant Discharge Elimination System Permit National Pollutant Discharge Elimination System NON-MAJOR (Tracking pollutant discharge elimination systems) - permit Business SIC classification: WATER SUPPLY Alternative names: SADORUS WTP, VILLAGE OF
SADORUS GRADE SCHOOL (PO BOX 79 in SADORUS, IL)
(National Center for Education Statistics) - STATE ID-0901000702003 Organizations: TOLONO C U SCHOOL DIST 7 (SCHOOL DISTRICT)
ILLINI FS INC (E END OF SANORUS ON MAIN in SADORUS, IL)
(Resource Conservation and Recovery Act (tracking hazardous waste))
AGRICULTURAL DIVISION FARM SERVICE CENTE (302 E. MARKET in SADORUS, IL)
AIR MINOR (AIRS/AFS) Business SIC classification: FERTILIZERS, MIXING ONLY Alternative names: ILLINI FS INCORPORATED SADORUS NH3
Housing units lacking complete plumbing facilities: 1.3% Housing units lacking complete kitchen facilities: 1.3%
46.6%Utility gas
27.6%Bottled, tank, or LP gas
25.5%Electricity
Population in 1990: 1,022.
Place of birth for U.S.-born residents:
This state: 411
Northeast: 32
Midwest: 13
South: 6
West: 36
70% of the 61872 zip code residents lived in the same house 5 years ago. Out of people who lived in different houses, 68% lived in this county. Out of people who lived in different counties, 50% lived in Illinois.
94% of the 61872 zip code residents lived in the same house 1 year ago. Out of people who lived in different houses, 52% moved from this county. Out of people who lived in different houses, 41% moved from different county within same state.
Private vs. public school enrollment:
Students in private schools in grades 1 to 8 (elementary and middle school): 3
Here:
6.0%
Illinois:
13.3%
Students in private schools in grades 9 to 12 (high school):
Here:
7.5%
Illinois:
9.9%
Students in private undergraduate colleges:
Here:
0.0%
Illinois:
27.4%
Occupation by median earnings in the past 12 months ($)
115,973Education, training, and library occupations
97,939Installation, maintenance, and repair occupations
75,162Business and financial operations occupations
65,157Transportation occupations
57,550Production occupations
54,008Office and administrative support occupations
Top industries in this zip code by the number of employees in 2005:
Other Services (except Public Administration): Religious Organizations (10-19 employees: 1 establishment)
Wholesale Trade: Computer and Computer Peripheral Equipment and Software Merchant Wholesalers (5-9: 1)
Accommodation and Food Services: Limited-Service Restaurants (1-4: 1)
Wholesale Trade: Grain and Field Bean Merchant Wholesalers (1-4: 1)
Finance and Insurance: Insurance Agencies and Brokerages (1-4: 1)
Professional, Scientific, and Technical Services: Research and Development in the Physical, Engineering, and Life Sciences (1-4: 1)
Home Mortgage Disclosure Act Aggregated Statistics For Year 2009 (Based on 2 partial tracts)
A) FHA, FSA/RHS & VA Home Purchase Loans
B) Conventional Home Purchase Loans
C) Refinancings
D) Home Improvement Loans
F) Non-occupant Loans on < 5 Family Dwellings (A B C & D)
G) Loans On Manufactured Home Dwelling (A B C & D)
Number
Average Value
Number
Average Value
Number
Average Value
Number
Average Value
Number
Average Value
Number
Average Value
LOANS ORIGINATED
14
$125,331
35
$119,724
120
$132,045
8
$55,036
10
$88,223
2
$80,915
APPLICATIONS APPROVED, NOT ACCEPTED
1
$81,900
2
$113,350
10
$128,124
0
$0
0
$0
0
$0
APPLICATIONS DENIED
2
$149,385
6
$100,900
15
$132,045
1
$18,350
1
$67,810
0
$0
APPLICATIONS WITHDRAWN
1
$96,640
1
$88,120
12
$140,786
0
$0
0
$0
0
$0
FILES CLOSED FOR INCOMPLETENESS
1
$69,780
0
$0
4
$163,390
0
$0
0
$0
0
$0
Aggregated Statistics For Year 2008 (Based on 2 partial tracts)
A) FHA, FSA/RHS & VA Home Purchase Loans
B) Conventional Home Purchase Loans
C) Refinancings
D) Home Improvement Loans
F) Non-occupant Loans on < 5 Family Dwellings (A B C & D)
G) Loans On Manufactured Home Dwelling (A B C & D)
Number
Average Value
Number
Average Value
Number
Average Value
Number
Average Value
Number
Average Value
Number
Average Value
LOANS ORIGINATED
12
$140,268
37
$148,456
55
$124,845
16
$44,246
8
$85,668
1
$138,900
APPLICATIONS APPROVED, NOT ACCEPTED
0
$0
4
$175,675
8
$103,276
1
$7,530
1
$47,170
0
$0
APPLICATIONS DENIED
1
$85,500
3
$150,477
19
$128,488
5
$85,634
1
$124,490
0
$0
APPLICATIONS WITHDRAWN
1
$96,640
0
$0
8
$112,202
1
$99,590
0
$0
0
$0
FILES CLOSED FOR INCOMPLETENESS
0
$0
0
$0
3
$128,200
1
$43,240
0
$0
0
$0
Aggregated Statistics For Year 2007 (Based on 2 partial tracts)
A) FHA, FSA/RHS & VA Home Purchase Loans
B) Conventional Home Purchase Loans
C) Refinancings
D) Home Improvement Loans
E) Loans on Dwellings For 5+ Families
F) Non-occupant Loans on < 5 Family Dwellings (A B C & D)
G) Loans On Manufactured Home Dwelling (A B C & D)
Number
Average Value
Number
Average Value
Number
Average Value
Number
Average Value
Number
Average Value
Number
Average Value
Number
Average Value
LOANS ORIGINATED
8
$125,635
48
$124,106
53
$107,447
22
$36,036
1
$288,940
6
$84,248
1
$144,470
APPLICATIONS APPROVED, NOT ACCEPTED
0
$0
2
$105,485
5
$109,026
1
$75,680
0
$0
1
$73,050
0
$0
APPLICATIONS DENIED
2
$91,730
6
$74,802
22
$121,301
6
$51,815
0
$0
1
$96,640
1
$84,520
APPLICATIONS WITHDRAWN
0
$0
1
$119,250
9
$114,551
0
$0
0
$0
0
$0
0
$0
FILES CLOSED FOR INCOMPLETENESS
0
$0
2
$93,855
4
$99,672
0
$0
0
$0
0
$0
0
$0
Aggregated Statistics For Year 2006 (Based on 2 partial tracts)
A) FHA, FSA/RHS & VA Home Purchase Loans
B) Conventional Home Purchase Loans
C) Refinancings
D) Home Improvement Loans
E) Loans on Dwellings For 5+ Families
F) Non-occupant Loans on < 5 Family Dwellings (A B C & D)
G) Loans On Manufactured Home Dwelling (A B C & D)
Number
Average Value
Number
Average Value
Number
Average Value
Number
Average Value
Number
Average Value
Number
Average Value
Number
Average Value
LOANS ORIGINATED
5
$131,106
65
$107,503
46
$101,143
14
$39,125
2
$154,465
8
$71,704
1
$34,400
APPLICATIONS APPROVED, NOT ACCEPTED
0
$0
7
$111,524
6
$77,750
1
$34,070
0
$0
1
$82,880
0
$0
APPLICATIONS DENIED
0
$0
7
$77,594
19
$98,522
7
$74,880
0
$0
1
$40,620
1
$54,380
APPLICATIONS WITHDRAWN
1
$49,470
3
$137,920
11
$124,547
1
$27,520
0
$0
0
$0
0
$0
FILES CLOSED FOR INCOMPLETENESS
0
$0
1
$93,370
4
$93,202
0
$0
0
$0
0
$0
0
$0
Aggregated Statistics For Year 2005 (Based on 2 partial tracts)
A) FHA, FSA/RHS & VA Home Purchase Loans
B) Conventional Home Purchase Loans
C) Refinancings
D) Home Improvement Loans
F) Non-occupant Loans on < 5 Family Dwellings (A B C & D)
G) Loans On Manufactured Home Dwelling (A B C & D)
Number
Average Value
Number
Average Value
Number
Average Value
Number
Average Value
Number
Average Value
Number
Average Value
LOANS ORIGINATED
8
$96,724
63
$101,598
55
$101,729
10
$49,304
7
$99,123
2
$38,985
APPLICATIONS APPROVED, NOT ACCEPTED
1
$94,020
6
$70,433
7
$80,121
2
$47,830
0
$0
1
$35,380
APPLICATIONS DENIED
1
$66,180
6
$99,208
22
$85,161
3
$41,387
2
$54,545
2
$26,045
APPLICATIONS WITHDRAWN
0
$0
3
$107,563
12
$107,644
3
$92,930
0
$0
0
$0
FILES CLOSED FOR INCOMPLETENESS
0
$0
1
$154,950
2
$84,030
0
$0
0
$0
0
$0
Aggregated Statistics For Year 2004 (Based on 2 partial tracts)
A) FHA, FSA/RHS & VA Home Purchase Loans
B) Conventional Home Purchase Loans
C) Refinancings
D) Home Improvement Loans
E) Loans on Dwellings For 5+ Families
F) Non-occupant Loans on < 5 Family Dwellings (A B C & D)
G) Loans On Manufactured Home Dwelling (A B C & D)
Number
Average Value
Number
Average Value
Number
Average Value
Number
Average Value
Number
Average Value
Number
Average Value
Number
Average Value
LOANS ORIGINATED
7
$103,194
61
$98,549
66
$91,356
12
$28,883
1
$77,310
7
$74,599
2
$66,995
APPLICATIONS APPROVED, NOT ACCEPTED
1
$174,940
2
$149,060
6
$91,292
1
$42,260
0
$0
1
$60,280
1
$57,000
APPLICATIONS DENIED
0
$0
5
$79,868
21
$92,991
4
$48,320
0
$0
2
$84,355
1
$37,350
APPLICATIONS WITHDRAWN
1
$91,070
3
$54,053
18
$106,124
1
$10,480
0
$0
1
$25,550
1
$49,140
FILES CLOSED FOR INCOMPLETENESS
0
$0
0
$0
4
$118,182
1
$15,400
0
$0
0
$0
0
$0
Aggregated Statistics For Year 2003 (Based on 2 partial tracts)
A) FHA, FSA/RHS & VA Home Purchase Loans
B) Conventional Home Purchase Loans
C) Refinancings
D) Home Improvement Loans
F) Non-occupant Loans on < 5 Family Dwellings (A B C & D)
Number
Average Value
Number
Average Value
Number
Average Value
Number
Average Value
Number
Average Value
LOANS ORIGINATED
11
$95,570
32
$97,482
157
$91,651
11
$14,891
6
$68,468
APPLICATIONS APPROVED, NOT ACCEPTED
0
$0
2
$63,065
9
$111,311
1
$8,520
0
$0
APPLICATIONS DENIED
1
$189,680
4
$55,118
25
$85,674
3
$14,087
1
$79,610
APPLICATIONS WITHDRAWN
0
$0
3
$115,533
11
$94,497
2
$37,675
0
$0
FILES CLOSED FOR INCOMPLETENESS
0
$0
0
$0
3
$78,733
0
$0
0
$0
Aggregated Statistics For Year 2002 (Based on 2 partial tracts)
A) FHA, FSA/RHS & VA Home Purchase Loans
B) Conventional Home Purchase Loans
C) Refinancings
D) Home Improvement Loans
E) Loans on Dwellings For 5+ Families
F) Non-occupant Loans on < 5 Family Dwellings (A B C & D)
Number
Average Value
Number
Average Value
Number
Average Value
Number
Average Value
Number
Average Value
Number
Average Value
LOANS ORIGINATED
10
$80,983
34
$83,499
94
$89,139
16
$24,570
1
$3,380,830
8
$61,794
APPLICATIONS APPROVED, NOT ACCEPTED
0
$0
2
$62,735
10
$83,997
1
$9,830
0
$0
0
$0
APPLICATIONS DENIED
0
$0
7
$33,603
22
$79,413
5
$31,974
0
$0
0
$0
APPLICATIONS WITHDRAWN
1
$71,740
3
$101,667
7
$61,401
0
$0
0
$0
0
$0
FILES CLOSED FOR INCOMPLETENESS
0
$0
0
$0
5
$80,918
1
$36,360
0
$0
0
$0
Aggregated Statistics For Year 2001 (Based on 2 partial tracts)
A) FHA, FSA/RHS & VA Home Purchase Loans
B) Conventional Home Purchase Loans
C) Refinancings
D) Home Improvement Loans
E) Loans on Dwellings For 5+ Families
F) Non-occupant Loans on < 5 Family Dwellings (A B C & D)
Number
Average Value
Number
Average Value
Number
Average Value
Number
Average Value
Number
Average Value
Number
Average Value
LOANS ORIGINATED
7
$80,964
31
$81,192
79
$88,158
13
$25,125
1
$127,440
3
$150,150
APPLICATIONS APPROVED, NOT ACCEPTED
0
$0
2
$44,880
4
$55,528
2
$24,570
0
$0
0
$0
APPLICATIONS DENIED
0
$0
9
$34,908
14
$66,549
5
$14,480
0
$0
1
$11,140
APPLICATIONS WITHDRAWN
1
$47,500
2
$78,950
10
$76,855
3
$26,537
0
$0
0
$0
FILES CLOSED FOR INCOMPLETENESS
0
$0
0
$0
2
$119,085
0
$0
0
$0
0
$0
Aggregated Statistics For Year 2000 (Based on 2 partial tracts)
A) FHA, FSA/RHS & VA Home Purchase Loans
B) Conventional Home Purchase Loans
C) Refinancings
D) Home Improvement Loans
F) Non-occupant Loans on < 5 Family Dwellings (A B C & D)
Number
Average Value
Number
Average Value
Number
Average Value
Number
Average Value
Number
Average Value
LOANS ORIGINATED
7
$76,331
27
$75,372
22
$74,812
19
$12,811
3
$71,090
APPLICATIONS APPROVED, NOT ACCEPTED
0
$0
2
$46,520
2
$52,090
1
$22,280
0
$0
APPLICATIONS DENIED
0
$0
6
$34,943
13
$49,745
3
$19,330
1
$21,290
APPLICATIONS WITHDRAWN
0
$0
1
$74,370
7
$55,786
0
$0
0
$0
FILES CLOSED FOR INCOMPLETENESS
0
$0
0
$0
4
$54,382
0
$0
0
$0
Aggregated Statistics For Year 1999 (Based on 1 partial tract)
A) FHA, FSA/RHS & VA Home Purchase Loans
B) Conventional Home Purchase Loans
C) Refinancings
D) Home Improvement Loans
F) Non-occupant Loans on < 5 Family Dwellings (A B C & D)
Detailed PMIC statistics for the following Tracts:0109.00
2002 - 2018 National Fire Incident Reporting System (NFIRS) incidents
Based on the data from the years 2002 - 2018 the average number of fire incidents per year is 9. The highest number of fire incidents - 20 took place in 2007, and the least - 2 in 2013. The data has a rising trend.
When looking into fire subcategories, the most incidents belonged to: Outside Fires (52.7%), and Structure Fires (33.3%).
Fire incident types reported to NFIRS in Zip Code 61872


 Nearest zip codes: 61851, 61863, 61880, 61913, 61874, 61875.


 Based on the data from the years 2002 - 2018 the average number of fire incidents per year is 9. The highest number of fire incidents - 20 took place in 2007, and the least - 2 in 2013. The data has a rising trend.
 When looking into fire subcategories, the most incidents belonged to: Outside Fires (52.7%), and Structure Fires (33.3%).