Estimated zip code population in 2022: 1,689 Zip code population in 2010: 1,810 Zip code population in 2000: 2,171
Houses and condos: 996 Renter-occupied apartments: 214
% of renters here:
30%
State:
33%
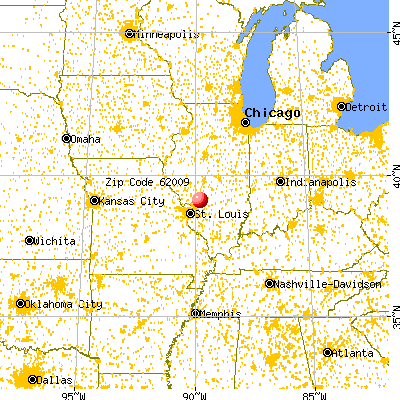
March 2022 cost of living index in zip code 62009: 81.9 (low, U.S. average is 100)
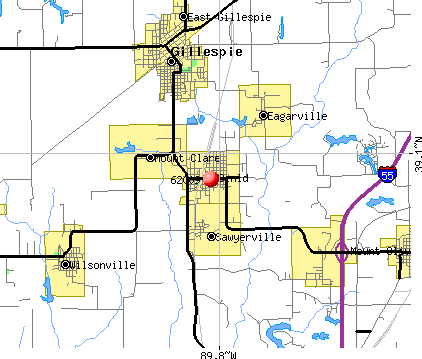
Land area: 3.8 sq. mi. Water area: 0.0 sq. mi.
Population density: 448 people per square mile
(low).
OSM Map
General Map
Google Map
MSN Map
OSM Map
General Map
Google Map
MSN Map
OSM Map
General Map
Google Map
MSN Map
OSM Map
General Map
Google Map
MSN Map
Please wait while loading the map...
Real estate property taxes paid for housing units in 2022:
This zip code:
1.2% ($1,026)
Illinois:
2.0% ($4,912)
Median real estate property taxes paid for housing units with mortgages in 2022: $1,169 (1.3%) Median real estate property taxes paid for housing units with no mortgage in 2022: $894 (1.1%)
Business Search- 14 Million verified businesses
Males: 916
(54.3%)
Females: 772
(45.7%)
For population 25 years and over in 62009:
High school or higher: 87.8%
Bachelor's degree or higher: 12.1%
Graduate or professional degree: 3.9%
Unemployed: 4.6%
Mean travel time to work (commute): 29.7 minutes
For population 15 years and over in 62009:
Never married: 32.3%
Now married: 42.3%
Separated: 1.5%
Widowed: 6.2%
Divorced: 17.7%
Zip code 62009 compared to state average:
Median household income below state average.
Median house value significantly below state average.
Black race population percentage significantly below state average.
Hispanic race population percentage significantly below state average.
Foreign-born population percentage significantly below state average.
Length of stay since moving in significantly above state average.
House age above state average.
Number of college students below state average.
Percentage of population with a bachelor's degree or higher significantly below state average.
Averages for the 2020 tax year for zip code 62009, filed in 2021:
Average Adjusted Gross Income (AGI) in 2020: $45,356 (Individual Income Tax Returns)
Here:
$45,356
State:
$82,626
Salary/wage: $38,748 (reported on 83.3% of returns)
Here:
$38,748
State:
$66,640
(% of AGI for various income ranges: 1239.6% for AGIs below $25k, 3423.1% for AGIs $25k-50k, 5322.2% for AGIs $50k-75k, 7512.0% for AGIs $75k-100k, 13853.3% for AGIs $100k-200k)
Taxable interest for individuals: $400 (reported on 24.4% of returns)
This zip code:
$400
Illinois:
$2,376
(% of AGI for various income ranges: 3.0% for AGIs below $25k, 21.2% for AGIs $25k-50k, 28.9% for AGIs $50k-75k, 6.0% for AGIs $75k-100k, 10.0% for AGIs $100k-200k)
Ordinary dividends: $2,130 (reported on 12.8% of returns)
Here:
$2,130
State:
$9,061
(% of AGI for various income ranges: 40.6% for AGIs $25k-50k, 141.1% for AGIs $50k-75k, 35.0% for AGIs $100k-200k)
Net capital gain/loss in AGI: +$2,333 (reported on 7.7% of returns)
Here:
+$2,333
State:
+$31,684
(% of AGI for various income ranges: 40.6% for AGIs $25k-50k, 150.0% for AGIs $75k-100k)
Profit/loss from business: +$5,986 (reported on 9.0% of returns)
Here:
+$5,986
State:
+$12,175
(% of AGI for various income ranges: 83.5% for AGIs below $25k, 107.5% for AGIs $25k-50k, 61.1% for AGIs $50k-75k)
Taxable individual retirement arrangement distribution: $11,717 (reported on 7.7% of returns)
62009:
$11,717
Illinois:
$21,613
(% of AGI for various income ranges: 48.7% for AGIs below $25k, 656.7% for AGIs $50k-75k)
Earned income credit: $2,500 (reported on 21.8% of returns)
Here:
$2,500
State:
$2,311
(% of AGI for various income ranges: 140.0% for AGIs below $25k, 64.4% for AGIs $25k-50k)
Percentage of individuals using paid preparers for their 2020 taxes: 97.4%
Here:
97%
State:
93%
(% for various income ranges: 96.9% for AGIs below $25k, 95.2% for AGIs $25k-50k, 100.0% for AGIs $50k-75k, 100.0% for AGIs $75k-100k, 100.0% for AGIs $100k-200k)
Averages for the 2012 tax year for zip code 62009, filed in 2013:
Average Adjusted Gross Income (AGI) in 2012: $41,272 (Individual Income Tax Returns)
Here:
$41,272
State:
$68,058
Salary/wage: $35,312 (reported on 83.3% of returns)
Here:
$35,312
State:
$55,396
(% of AGI for various income ranges: 67.1% for AGIs below $25k, 76.7% for AGIs $25k-50k, 70.9% for AGIs $50k-75k, 75.0% for AGIs $75k-100k, 65.6% for AGIs $100k-200k)
Taxable interest for individuals: $954 (reported on 30.8% of returns)
This zip code:
$954
Illinois:
$1,969
(% of AGI for various income ranges: 0.8% for AGIs below $25k, 1.1% for AGIs $25k-50k, 1.1% for AGIs $50k-75k, 0.2% for AGIs $75k-100k, 0.2% for AGIs $100k-200k)
Ordinary dividends: $2,450 (reported on 17.9% of returns)
Here:
$2,450
State:
$7,786
(% of AGI for various income ranges: 1.5% for AGIs below $25k, 0.6% for AGIs $25k-50k, 1.8% for AGIs $50k-75k, 1.4% for AGIs $75k-100k)
Net capital gain/loss in AGI: +$3,029 (reported on 9.0% of returns)
Here:
+$3,029
State:
+$22,183
Profit/loss from business: +$3,183 (reported on 7.7% of returns)
Here:
+$3,183
State:
+$12,903
Taxable individual retirement arrangement distribution: $9,850 (reported on 10.3% of returns)
62009:
$9,850
Illinois:
$17,929
Total itemized deductions: $16,020 (20% of AGI, reported on 12.8% of returns)
Here:
$16,020
State:
$26,433
Here:
19.9% of AGI
State:
19.2% of AGI
(% of AGI for various income ranges: 5.2% for AGIs $25k-50k, 4.1% for AGIs $50k-75k, 7.8% for AGIs $75k-100k, 6.5% for AGIs $100k-200k)
Charity contributions: $2,760 (reported on 6.4% of returns)
Here:
$2,760
State:
$4,525
(% of AGI for various income ranges: 0.8% for AGIs $50k-75k, 1.0% for AGIs $100k-200k)
Taxes paid: $5,490 (reported on 12.8% of returns)
62009:
$5,490
State:
$11,968
(% of AGI for various income ranges: 1.1% for AGIs $25k-50k, 1.3% for AGIs $50k-75k, 2.8% for AGIs $75k-100k, 2.9% for AGIs $100k-200k)
Earned income credit: $2,382 (reported on 21.8% of returns)
Here:
$2,382
State:
$2,349
(% of AGI for various income ranges: 7.6% for AGIs below $25k, 1.2% for AGIs $25k-50k)
Percentage of individuals using paid preparers for their 2012 taxes: 57.7%
Here:
58%
State:
57%
(% for various income ranges: 53.1% for AGIs below $25k, 60.0% for AGIs $25k-50k, 57.1% for AGIs $50k-75k, 57.1% for AGIs $75k-100k, 80.0% for AGIs $100k-200k)
Averages for the 2004 tax year for zip code 62009, filed in 2005:
Average Adjusted Gross Income (AGI) in 2004: $34,121 (Individual Income Tax Returns)
Here:
$34,121
State:
$54,625
Salary/wage: $30,764 (reported on 83.8% of returns)
Here:
$30,764
State:
$46,811
(% of AGI for various income ranges: 71.7% for AGIs below $10k, 68.6% for AGIs $10k-25k, 80.6% for AGIs $25k-50k, 77.8% for AGIs $50k-75k, 76.6% for AGIs $75k-100k, 62.9% for AGIs over 100k)
Taxable interest for individuals: $2,023 (reported on 37.5% of returns)
This zip code:
$2,023
Illinois:
$2,101
(% of AGI for various income ranges: 5.9% for AGIs below $10k, 3.8% for AGIs $10k-25k, 1.9% for AGIs $25k-50k, 1.9% for AGIs $50k-75k, 0.2% for AGIs $75k-100k, 4.0% for AGIs over 100k)
Taxable dividends: $2,400 (reported on 23.0% of returns)
Here:
$2,400
State:
$4,306
(% of AGI for various income ranges: 2.1% for AGIs below $10k, 4.6% for AGIs $10k-25k, 1.6% for AGIs $25k-50k, 1.0% for AGIs $50k-75k, 0.1% for AGIs $75k-100k, 1.8% for AGIs over 100k)
Net capital gain/loss: +$1,630 (reported on 13.4% of returns)
Here:
+$1,630
State:
+$17,321
(% of AGI for various income ranges: -2.1% for AGIs below $10k, 0.6% for AGIs $10k-25k, 0.2% for AGIs $25k-50k, 0.7% for AGIs $50k-75k, 2.3% for AGIs $75k-100k)
Profit/loss from business: +$3,587 (reported on 9.3% of returns)
Here:
+$3,587
State:
+$11,771
(% of AGI for various income ranges: 3.8% for AGIs below $10k, 2.4% for AGIs $10k-25k, -0.1% for AGIs $25k-50k, 0.3% for AGIs $50k-75k, 2.9% for AGIs $75k-100k)
IRA payment deduction: $2,118 (reported on 2.1% of returns)
62009:
$2,118
Illinois:
$3,087
Total itemized deductions: $14,220 (23% of AGI, reported on 10.2% of returns)
Here:
$14,220
State:
$20,239
Here:
23.2% of AGI
State:
19.5% of AGI
(% of AGI for various income ranges: 9.3% for AGIs $10k-25k, 3.0% for AGIs $25k-50k, 3.4% for AGIs $50k-75k, 7.7% for AGIs $75k-100k)
Charity contributions deductions: $2,356 (3% of AGI, reported on 7.3% of returns)
Here:
$2,356
State:
$3,719
Here:
3.2% of AGI
State:
3.4% of AGI
(% of AGI for various income ranges: 0.4% for AGIs $10k-25k, 0.3% for AGIs $25k-50k, 0.5% for AGIs $50k-75k, 1.4% for AGIs $75k-100k)
Total tax: $4,085 (reported on 70.1% of returns)
62009:
$4,085
State:
$9,882
(% of AGI for various income ranges: 1.2% for AGIs below $10k, 3.2% for AGIs $10k-25k, 6.4% for AGIs $25k-50k, 8.8% for AGIs $50k-75k, 11.1% for AGIs $75k-100k, 17.5% for AGIs over 100k)
Earned income credit: $1,575 (reported on 16.7% of returns)
Here:
$1,575
State:
$1,788
Percentage of individuals using paid preparers for their 2004 taxes: 61.5%
Here:
62%
State:
61%
(% for various income ranges: 58.1% for AGIs below $10k, 61.4% for AGIs $10k-25k, 61.0% for AGIs $25k-50k, 64.2% for AGIs $50k-75k, 60.0% for AGIs $75k-100k, 86.4% for AGIs over 100k)
Likely homosexual households (counted as self-reported same-sex unmarried-partner households)
Lesbian couples: 0.0% of all households
Gay men: 0.4% of all households
Household received Food Stamps/SNAP in the past 12 months: 195 Household did not receive Food Stamps/SNAP in the past 12 months: 536
Women who had a birth in the past 12 months: 6 (6 now married, 0 unmarried) Women who did not have a birth in the past 12 months: 311 (138 now married, 173 unmarried)
Housing units in zip code 62009 with a mortgage: 264 (23 second mortgage, 15 both second mortgage and home equity loan) Houses without a mortgage: 6
Median monthly owner costs for units with a mortgage: $924 Median monthly owner costs for units without a mortgage: $400
Residents with income below the poverty level in 2022:
This zip code:
20.0%
Whole state:
11.9%
Residents with income below 50% of the poverty level in 2022:
This zip code:
9.9%
Whole state:
5.7%
Median number of rooms in houses and condos:
Here:
5.3
State:
6.4
Median number of rooms in apartments:
Here:
4.3
State:
4.1
Notable locations in this zip code not listed on our city pages
Churches in zip code 62009 include: First Baptist Church (A), North Fifth Street Baptist Church (B), Saint Joseph Roman Catholic Church (C), Saint Marias Church (D). Display/hide their locations on the map
181 married couples with children.
128 single-parent households (55 men, 73 women).
97.1% of residents of 62009 zip code speak English at home.
2.4% of residents speak other Indo-European language at home (92% very well, 8% well).
Foreign born population: 43 (2.5%) (25.7% of them are naturalized citizens)
This zip code:
2.5%
Whole state:
14.4%
77%France
9%Malaysia
5%North Macedonia (Macedonia)
32%German
16%Italian
15%American
8%English
7%Irish
4%Scottish
2%Croatian
Year of entry for the foreign-born population
442010 or later
22000 to 2009
01990 to 1999
20Before 1990
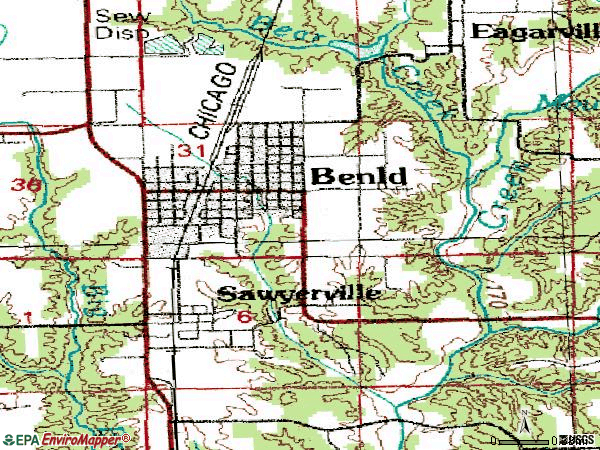
Facilities with environmental interests located in this zip code:
LEONE S READY MIX CONCRETE CO (100 CENTRAL AVE in BENLD, IL)
STATE MASTER (Illinois EPA Project) - AIR PROGRAM AIR MINOR (AIRS/AFS) CRITERIA AND HAZARDOUS AIR POLLUTANT INVENTORY (Inventory of air pollution sources) Business SIC classification: READY-MIXED CONCRETE Business NAICS classification: READY-MIX CONCRETE MANUFACTURING. Alternative names: LEONES READY MIX CONCRETE COMPANY
ILL TRUCK & TRAILER (P O BOX 64 in BENLD, IL)
AIR MINOR (AIRS/AFS) Business SIC classification: STEEL WORKS, BLAST FURNACES (INCLUDING COKE OVENS), AND ROLLING MILLS
Housing units lacking complete plumbing facilities: 15.8% Housing units lacking complete kitchen facilities: 15.9%
73.3%Utility gas
24.1%Electricity
2.8%Bottled, tank, or LP gas
Population in 1990: 1,604. Population change in the 1990s: +567 (+35.3%).
Place of birth for U.S.-born residents:
This state: 1,292
Northeast: 38
Midwest: 115
South: 86
West: 90
60% of the 62009 zip code residents lived in the same house 5 years ago. Out of people who lived in different houses, 67% lived in this county. Out of people who lived in different counties, 50% lived in Illinois.
90% of the 62009 zip code residents lived in the same house 1 year ago. Out of people who lived in different houses, 45% moved from this county. Out of people who lived in different houses, 33% moved from different county within same state. Out of people who lived in different houses, 23% moved from different state.
Private vs. public school enrollment:
Students in private schools in grades 1 to 8 (elementary and middle school): 32
Here:
15.2%
Illinois:
13.3%
Students in private schools in grades 9 to 12 (high school): 14
Here:
11.7%
Illinois:
9.9%
Students in private undergraduate colleges: 12
Here:
33.5%
Illinois:
27.4%
Occupation by median earnings in the past 12 months ($)
91,253Management occupations
79,924Business and financial operations occupations
77,245Installation, maintenance, and repair occupations
73,759Production occupations
46,015Construction and extraction occupations
37,923Transportation occupations
Companies with federal contracts located in this zip code:
SUNDAE CATERING (110 W CENTRAL AVE in BENLD, IL; small business) : $102,902 in 2 contractsin 2003
$95,850 with Army for Forage and Feed. Signed on 2003-11-21. Completion date: 2003-12-10.
$7,052, same as above.Signed on 2003-12-11. Completion date: 2003-12-10.
Top industries in this zip code by the number of employees in 2005:
Accommodation and Food Services: Full-Service Restaurants (20-49 employees: 1 establishment)
Other Services (except Public Administration): Pet Care (except Veterinary) Services (10-19: 1)
Wholesale Trade: General Line Grocery Merchant Wholesalers (10-19: 1)
Accommodation and Food Services: Limited-Service Restaurants (10-19: 1)
Finance and Insurance: Commercial Banking (5-9: 1, 1-4: 1)
Wholesale Trade: Transportation Equipment and Supplies (except Motor Vehicle) Merchant Wholesalers (5-9: 1)
People in group quarters in 2000:
110 people in nursing homes
2002 - 2018 National Fire Incident Reporting System (NFIRS) incidents
Based on the data from the years 2002 - 2018 the average number of fires per year is 6. The highest number of reported fire incidents - 15 took place in 2011, and the least - 1 in 2004. The data has a decreasing trend.
When looking into fire subcategories, the most incidents belonged to: Structure Fires (47.1%), and Outside Fires (34.6%).
Fire incident types reported to NFIRS in Zip Code 62009


 Nearest zip codes: 62085, 62023, 62069, 62093, 62033, 62088.


 Based on the data from the years 2002 - 2018 the average number of fires per year is 6. The highest number of reported fire incidents - 15 took place in 2011, and the least - 1 in 2004. The data has a decreasing trend.
 When looking into fire subcategories, the most incidents belonged to: Structure Fires (47.1%), and Outside Fires (34.6%).