Estimated zip code population in 2022: 3,185 Zip code population in 2010: 3,313 Zip code population in 2000: 3,447
Houses and condos: 1,620 Renter-occupied apartments: 309
% of renters here:
22%
State:
33%
March 2022 cost of living index in zip code 62069: 84.5 (less than average, U.S. average is 100)
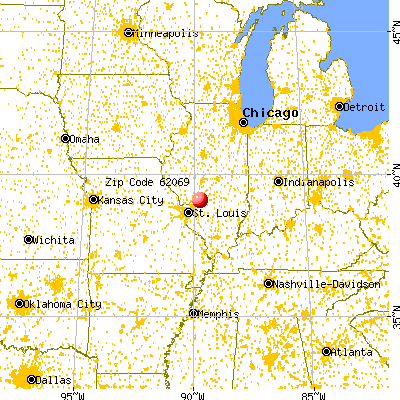
Land area: 31.8 sq. mi. Water area: 0.3 sq. mi.
Population density: 100 people per square mile
(very low).
OSM Map
General Map
Google Map
MSN Map
OSM Map
General Map
Google Map
MSN Map
OSM Map
General Map
Google Map
MSN Map
OSM Map
General Map
Google Map
MSN Map
Please wait while loading the map...
Real estate property taxes paid for housing units in 2022:
This zip code:
1.6% ($1,640)
Illinois:
2.0% ($4,912)
Median real estate property taxes paid for housing units with mortgages in 2022: $1,615 (1.6%) Median real estate property taxes paid for housing units with no mortgage in 2022: $1,679 (1.5%)
Averages for the 2020 tax year for zip code 62069, filed in 2021:
Average Adjusted Gross Income (AGI) in 2020: $55,858 (Individual Income Tax Returns)
Here:
$55,858
State:
$82,626
Salary/wage: $47,401 (reported on 81.7% of returns)
Here:
$47,401
State:
$66,640
(% of AGI for various income ranges: 1085.3% for AGIs below $25k, 3469.4% for AGIs $25k-50k, 6149.4% for AGIs $50k-75k, 7655.7% for AGIs $75k-100k, 15327.3% for AGIs $100k-200k)
Taxable interest for individuals: $724 (reported on 32.7% of returns)
This zip code:
$724
Illinois:
$2,376
(% of AGI for various income ranges: 16.7% for AGIs below $25k, 12.9% for AGIs $25k-50k, 30.0% for AGIs $50k-75k, 42.1% for AGIs $75k-100k, 100.7% for AGIs $100k-200k)
Ordinary dividends: $3,685 (reported on 17.0% of returns)
Here:
$3,685
State:
$9,061
(% of AGI for various income ranges: 26.4% for AGIs below $25k, 16.2% for AGIs $25k-50k, 86.9% for AGIs $50k-75k, 118.6% for AGIs $75k-100k, 335.3% for AGIs $100k-200k)
Net capital gain/loss in AGI: +$7,600 (reported on 13.1% of returns)
Here:
+$7,600
State:
+$31,684
(% of AGI for various income ranges: 2.2% for AGIs below $25k, 16.8% for AGIs $25k-50k, 66.2% for AGIs $50k-75k, 72.9% for AGIs $75k-100k, 831.3% for AGIs $100k-200k)
Profit/loss from business: +$5,286 (reported on 9.2% of returns)
Here:
+$5,286
State:
+$12,175
(% of AGI for various income ranges: 24.7% for AGIs below $25k, 46.2% for AGIs $25k-50k, 213.1% for AGIs $50k-75k, 109.3% for AGIs $75k-100k)
Taxable individual retirement arrangement distribution: $16,029 (reported on 9.2% of returns)
62069:
$16,029
Illinois:
$21,613
(% of AGI for various income ranges: 53.6% for AGIs below $25k, 82.9% for AGIs $25k-50k, 190.0% for AGIs $50k-75k, 291.4% for AGIs $75k-100k, 704.7% for AGIs $100k-200k)
Total itemized deductions: $24,367 (reported on 2.0% of returns)
Here:
$24,367
State:
$34,948
(% of AGI for various income ranges: 215.0% for AGIs $25k-50k)
Taxes paid: $4,800 (reported on 2.0% of returns)
62069:
$4,800
State:
$8,563
(% of AGI for various income ranges: 42.4% for AGIs $25k-50k)
Earned income credit: $2,100 (reported on 15.7% of returns)
Here:
$2,100
State:
$2,311
(% of AGI for various income ranges: 82.8% for AGIs below $25k, 60.6% for AGIs $25k-50k)
Percentage of individuals using paid preparers for their 2020 taxes: 96.1%
Here:
96%
State:
93%
(% for various income ranges: 95.8% for AGIs below $25k, 97.6% for AGIs $25k-50k, 95.5% for AGIs $50k-75k, 94.7% for AGIs $75k-100k, 95.2% for AGIs $100k-200k, 100.0% for AGIs over 200k)
Averages for the 2012 tax year for zip code 62069, filed in 2013:
Average Adjusted Gross Income (AGI) in 2012: $46,392 (Individual Income Tax Returns)
Here:
$46,392
State:
$68,058
Salary/wage: $40,752 (reported on 81.9% of returns)
Here:
$40,752
State:
$55,396
(% of AGI for various income ranges: 68.1% for AGIs below $25k, 73.0% for AGIs $25k-50k, 71.3% for AGIs $50k-75k, 77.7% for AGIs $75k-100k, 68.8% for AGIs $100k-200k)
Taxable interest for individuals: $1,059 (reported on 38.9% of returns)
This zip code:
$1,059
Illinois:
$1,969
(% of AGI for various income ranges: 1.5% for AGIs below $25k, 1.0% for AGIs $25k-50k, 0.7% for AGIs $50k-75k, 0.9% for AGIs $75k-100k, 0.7% for AGIs $100k-200k)
Ordinary dividends: $2,547 (reported on 20.1% of returns)
Here:
$2,547
State:
$7,786
(% of AGI for various income ranges: 2.0% for AGIs below $25k, 1.0% for AGIs $25k-50k, 0.9% for AGIs $50k-75k, 0.9% for AGIs $75k-100k, 1.1% for AGIs $100k-200k)
Net capital gain/loss in AGI: +$1,441 (reported on 11.4% of returns)
Here:
+$1,441
State:
+$22,183
(% of AGI for various income ranges: 0.3% for AGIs $75k-100k, 1.0% for AGIs $100k-200k)
Profit/loss from business: +$4,235 (reported on 11.4% of returns)
Here:
+$4,235
State:
+$12,903
(% of AGI for various income ranges: 3.8% for AGIs below $25k, 0.3% for AGIs $25k-50k, 1.7% for AGIs $50k-75k, 1.1% for AGIs $75k-100k)
Taxable individual retirement arrangement distribution: $8,941 (reported on 11.4% of returns)
62069:
$8,941
Illinois:
$17,929
(% of AGI for various income ranges: 2.8% for AGIs below $25k, 2.8% for AGIs $25k-50k, 2.3% for AGIs $50k-75k, 4.3% for AGIs $75k-100k)
Total itemized deductions: $16,218 (19% of AGI, reported on 18.8% of returns)
Here:
$16,218
State:
$26,433
Here:
19.1% of AGI
State:
19.2% of AGI
(% of AGI for various income ranges: 5.6% for AGIs below $25k, 5.1% for AGIs $25k-50k, 6.3% for AGIs $50k-75k, 5.5% for AGIs $75k-100k, 8.8% for AGIs $100k-200k)
Charity contributions: $2,512 (reported on 10.7% of returns)
Here:
$2,512
State:
$4,525
(% of AGI for various income ranges: 0.6% for AGIs $25k-50k, 0.5% for AGIs $50k-75k, 0.6% for AGIs $75k-100k, 0.8% for AGIs $100k-200k)
Taxes paid: $5,854 (reported on 18.8% of returns)
62069:
$5,854
State:
$11,968
(% of AGI for various income ranges: 1.3% for AGIs below $25k, 1.3% for AGIs $25k-50k, 1.9% for AGIs $50k-75k, 1.9% for AGIs $75k-100k, 4.1% for AGIs $100k-200k)
Earned income credit: $2,070 (reported on 18.1% of returns)
Here:
$2,070
State:
$2,349
(% of AGI for various income ranges: 6.4% for AGIs below $25k, 0.8% for AGIs $25k-50k)
Percentage of individuals using paid preparers for their 2012 taxes: 56.4%
Here:
56%
State:
57%
(% for various income ranges: 50.8% for AGIs below $25k, 57.1% for AGIs $25k-50k, 60.9% for AGIs $50k-75k, 58.8% for AGIs $75k-100k, 66.7% for AGIs $100k-200k)
Averages for the 2004 tax year for zip code 62069, filed in 2005:
Average Adjusted Gross Income (AGI) in 2004: $36,091 (Individual Income Tax Returns)
Here:
$36,091
State:
$54,625
Salary/wage: $33,577 (reported on 83.6% of returns)
Here:
$33,577
State:
$46,811
(% of AGI for various income ranges: 88.5% for AGIs below $10k, 68.8% for AGIs $10k-25k, 81.4% for AGIs $25k-50k, 79.2% for AGIs $50k-75k, 85.1% for AGIs $75k-100k, 67.0% for AGIs over 100k)
Taxable interest for individuals: $1,126 (reported on 44.3% of returns)
This zip code:
$1,126
Illinois:
$2,101
(% of AGI for various income ranges: 6.4% for AGIs below $10k, 3.7% for AGIs $10k-25k, 1.2% for AGIs $25k-50k, 0.9% for AGIs $50k-75k, 0.5% for AGIs $75k-100k, 0.7% for AGIs over 100k)
Taxable dividends: $1,954 (reported on 24.1% of returns)
Here:
$1,954
State:
$4,306
(% of AGI for various income ranges: 3.6% for AGIs below $10k, 2.5% for AGIs $10k-25k, 0.8% for AGIs $25k-50k, 1.6% for AGIs $50k-75k, 0.6% for AGIs $75k-100k, 1.1% for AGIs over 100k)
Net capital gain/loss: +$978 (reported on 15.0% of returns)
Here:
+$978
State:
+$17,321
(% of AGI for various income ranges: -1.4% for AGIs below $10k, 1.1% for AGIs $10k-25k, -0.1% for AGIs $25k-50k, 0.3% for AGIs $50k-75k, -0.1% for AGIs $75k-100k, 1.8% for AGIs over 100k)
Profit/loss from business: +$2,669 (reported on 11.7% of returns)
Here:
+$2,669
State:
+$11,771
(% of AGI for various income ranges: 1.8% for AGIs below $10k, 2.4% for AGIs $10k-25k, 1.6% for AGIs $25k-50k, -0.1% for AGIs $50k-75k, 0.6% for AGIs $75k-100k)
IRA payment deduction: $3,000 (reported on 2.4% of returns)
62069:
$3,000
Illinois:
$3,087
Total itemized deductions: $14,375 (22% of AGI, reported on 15.2% of returns)
Here:
$14,375
State:
$20,239
Here:
22.2% of AGI
State:
19.5% of AGI
(% of AGI for various income ranges: 6.6% for AGIs $10k-25k, 5.2% for AGIs $25k-50k, 5.1% for AGIs $50k-75k, 6.8% for AGIs $75k-100k, 9.1% for AGIs over 100k)
Charity contributions deductions: $1,904 (3% of AGI, reported on 11.6% of returns)
Here:
$1,904
State:
$3,719
Here:
2.8% of AGI
State:
3.4% of AGI
(% of AGI for various income ranges: 0.7% for AGIs $10k-25k, 0.3% for AGIs $25k-50k, 0.6% for AGIs $50k-75k, 0.6% for AGIs $75k-100k, 1.2% for AGIs over 100k)
Total tax: $4,337 (reported on 73.8% of returns)
62069:
$4,337
State:
$9,882
(% of AGI for various income ranges: 2.0% for AGIs below $10k, 3.4% for AGIs $10k-25k, 6.8% for AGIs $25k-50k, 8.6% for AGIs $50k-75k, 11.5% for AGIs $75k-100k, 15.9% for AGIs over 100k)
Earned income credit: $1,615 (reported on 14.3% of returns)
Here:
$1,615
State:
$1,788
Percentage of individuals using paid preparers for their 2004 taxes: 57.4%
Here:
57%
State:
61%
(% for various income ranges: 42.9% for AGIs below $10k, 58.2% for AGIs $10k-25k, 59.9% for AGIs $25k-50k, 64.9% for AGIs $50k-75k, 59.6% for AGIs $75k-100k, 77.0% for AGIs over 100k)
Household received Food Stamps/SNAP in the past 12 months: 156 Household did not receive Food Stamps/SNAP in the past 12 months: 1,269
Women who had a birth in the past 12 months: 25 (17 now married, 7 unmarried) Women who did not have a birth in the past 12 months: 630 (200 now married, 431 unmarried)
Housing units in zip code 62069 with a mortgage: 494 (36 second mortgage, 31 both second mortgage and home equity loan) Houses without a mortgage: 68
Median monthly owner costs for units with a mortgage: $984 Median monthly owner costs for units without a mortgage: $532
Residents with income below the poverty level in 2022:
This zip code:
12.4%
Whole state:
11.9%
Residents with income below 50% of the poverty level in 2022:
This zip code:
7.2%
Whole state:
5.7%
Median number of rooms in houses and condos:
Here:
6.0
State:
6.4
Median number of rooms in apartments:
Here:
4.4
State:
4.1
Notable locations in this zip code not listed on our city pages
Notable locations in zip code 62069: Karnes Siding (A), Mount Olive City Hall (B), Mount Olive Area Ambulance Service (C), Mount Olive Fire Protection District (D). Display/hide their locations on the map
Cemeteries: Union Miners Cemetery (1), Cavalry Cemetery (2), Immanuel Lutheran Cemetery (3), Farrar Cemetery (4), Mount Olive Cemetery (5), Trinity Cemetery (6), Chapman Cemetery (7). Display/hide their locations on the map
Size of family households: 618 2-persons, 164 3-persons, 79 4-persons, 75 5-persons, 11 7-or-more-persons
Size of nonfamily households: 422 1-person, 61 2-persons
243 married couples with children.
225 single-parent households (70 men, 155 women).
98.0% of residents of 62069 zip code speak English at home.
0.1% of residents speak other Indo-European language at home (100% very well).
2.0% of residents speak Asian or Pacific Island language at home (100% very well).
Foreign born population: 17 (0.5%) (53.2% of them are naturalized citizens)
This zip code:
0.5%
Whole state:
14.4%
47%Malaysia
29%Bhutan
18%France
44%German
13%American
10%English
8%Irish
5%Italian
3%Scottish
2%European
Year of entry for the foreign-born population
92010 or later
02000 to 2009
91990 to 1999
13Before 1990
Major facilities with environmental interests located in this zip code:
MENNEL MILLING CO OF ILLINOIS (415 E. MAIN ST. in MT OLIVE, IL)
STATE MASTER (Illinois EPA Project) - AIR PROGRAM AIR MINOR (AIRS/AFS) CRITERIA AND HAZARDOUS AIR POLLUTANT INVENTORY (Inventory of air pollution sources) TRI REPORTER (Tracking of toxic chemicals releasing facilities) Business SIC classification: FLOUR AND OTHER GRAIN MILL PRODUCTS Alternative names: MENNEL MILLING CO. OF ILLINOIS
HANO BUSINESS FORMS (OLD ROUTE 66 in MT OLIVE, IL)
STATE MASTER (Illinois EPA Project) - SOLID WASTE PROGRAM, HAZARDOUS WASTE PROGRAM, AIR PROGRAM AIR MINOR (AIRS/AFS) CRITERIA AND HAZARDOUS AIR POLLUTANT INVENTORY (Inventory of air pollution sources) Small Quantity Generators, between 100 kg and 1000 kg of hazardous waste/month (Resource Conservation and Recovery Act (tracking hazardous waste)) - notification Business SIC classification: COMMERCIAL PRINTING
MOUNT OLIVE CU SCHOOL DIST 5 (804 MAIN ST in MOUNT OLIVE, IL)
COMPLIANCE ACTIVITY (Tracking inspections of insecticide, fungicide, and rodenticide, and toxic substances) (National Center for Education Statistics) - STATE ID-4005600500001 Business SIC classification: ELEMENTARY AND SECONDARY SCHOOLS Organizations: MOUNT OLIVE C U SCHOOL DIST 5 (SCHOOL DISTRICT)
Alternative names: MT OLIVE HIGH SCH
MIDWEST PETROLEUM CO (RR 1 BOX 97 in MT OLIVE, IL)
STATE MASTER (Illinois EPA Project) - HAZARDOUS WASTE PROGRAM (Resource Conservation and Recovery Act (tracking hazardous waste)) Alternative names: BOLCH 61 MIDWEST PETROLEUM
MT. OLIVE NORTH WWTF (WEST SECOND STREET in MOUNT OLIVE, IL)
STATE MASTER (Illinois EPA Project) - National Pollutant Discharge Elimination System Permit National Pollutant Discharge Elimination System NON-MAJOR (Tracking pollutant discharge elimination systems) - permit Business SIC classification: SEWERAGE SYSTEMS
CITY OF MOUNT OLIVE (200 EAST MAIN STREET in MT. OLIVE, IL)
STATE MASTER (Illinois EPA Project) - National Pollutant Discharge Elimination System Permit National Pollutant Discharge Elimination System NON-MAJOR (Tracking pollutant discharge elimination systems) - permit Business SIC classification: WATER SUPPLY Alternative names: MT. OLIVE WTP, MT. OLIVE WTP, CITY OF
MT OLIVE ELEMENTARY SCHOOL (804 W MAIN ST in MOUNT OLIVE, IL)
(National Center for Education Statistics) - STATE ID-4005600502001 Organizations: MOUNT OLIVE C U SCHOOL DIST 5 (SCHOOL DISTRICT)
NEKOOSA PACKAGING CORPORATION (OLD HIGHWAY 66 AND SOUTH 8TH STREET in MOUNT OLIVE, IL)
(Resource Conservation and Recovery Act (tracking hazardous waste)) TRI REPORTER (Tracking of toxic chemicals releasing facilities) Business SIC classification: CORRUGATED AND SOLID FIBER BOXES Business NAICS classification: CORRUGATED AND SOLID FIBER BOX MANUFACTURING. Organizations: OWENS-ILLINOIS INC. (CONTACT/OPERATOR)
Alternative names: NEKOOSA PKG MT OLIVE BOX PLANT
RUAN LEASING COMPANY (OLD ROUTE 66 in MOUNT OLIVE, IL)
National Pollutant Discharge Elimination System NON-MAJOR (Tracking pollutant discharge elimination systems) - permit
MT OLIVE SCHOOL DIST 5 (RR 1 in MT OLIVE, IL)
Large Quantity Generators, more that 1000 kg of hazardous waste/month (Resource Conservation and Recovery Act (tracking hazardous waste)) - notification
MULLINS MAX B SALVAGE (RR 1 MT OLIVE in MT OLIVE, IL)
(Resource Conservation and Recovery Act (tracking hazardous waste))
JOS. F. BOENTE SONS, INC (400 E MAIN in MT OLIVE, IL)
AIR MINOR (AIRS/AFS) Business SIC classification: PETROLEUM BULK STATIONS AND TERMINALS
MT. OLIVE NORTH WWTF (NO. 1 PINE STREET in MOUNT OLIVE, IL)
National Pollutant Discharge Elimination System NON-MAJOR (Tracking pollutant discharge elimination systems) - permit Business SIC classification: SEWERAGE SYSTEMS Alternative names: MOUNT OLIVE-NORTH, CITY OF
Housing units lacking complete plumbing facilities: 3.2% Housing units lacking complete kitchen facilities: 3.3%
69.1%Utility gas
15.3%Electricity
14.1%Bottled, tank, or LP gas
0.6%Wood
0.6%Other fuel
Population in 1990: 3,443. Population change in the 1990s: +4 (+0.1%).
Place of birth for U.S.-born residents:
This state: 2,579
Northeast: 89
Midwest: 319
South: 77
West: 78
76% of the 62069 zip code residents lived in the same house 5 years ago. Out of people who lived in different houses, 56% lived in this county. Out of people who lived in different counties, 50% lived in Illinois.
92% of the 62069 zip code residents lived in the same house 1 year ago. Out of people who lived in different houses, 39% moved from this county. Out of people who lived in different houses, 50% moved from different county within same state. Out of people who lived in different houses, 13% moved from different state.
Private vs. public school enrollment:
Students in private schools in grades 1 to 8 (elementary and middle school): 9
Here:
4.3%
Illinois:
13.3%
Students in private schools in grades 9 to 12 (high school): 57
Here:
32.6%
Illinois:
9.9%
Students in private undergraduate colleges: 18
Here:
17.7%
Illinois:
27.4%
Occupation by median earnings in the past 12 months ($)
73,600Management occupations
65,092Health diagnosing and treating practitioners and other technical occupations
64,908Computer and mathematical occupations
60,638Construction and extraction occupations
58,906Community and social service occupations
53,821Installation, maintenance, and repair occupations
Top industries in this zip code by the number of employees in 2005:
Wholesale Trade: Motor Vehicle Parts (Used) Merchant Wholesalers (50-99 employees: 1 establishment)
Accommodation and Food Services: Full-Service Restaurants (20-49: 1)
Finance and Insurance: Insurance Agencies and Brokerages (10-19: 1, 1-4: 1)
Finance and Insurance: Commercial Banking (10-19: 1)
Health Care and Social Assistance: Offices of Physicians (except Mental Health Specialists) (10-19: 1)
Fatal accident statistics in 2014:
Fatal accident count: 1
Vehicles involved in fatal accidents: 1
Fatal accidents caused by drunken drivers: 0
Fatalities: 1
Persons involved in fatal accidents: 2
Pedestrians involved in fatal accidents: 0
Home Mortgage Disclosure Act Aggregated Statistics For Year 2009 (Based on 4 partial tracts)
A) FHA, FSA/RHS & VA Home Purchase Loans
B) Conventional Home Purchase Loans
C) Refinancings
D) Home Improvement Loans
F) Non-occupant Loans on < 5 Family Dwellings (A B C & D)
G) Loans On Manufactured Home Dwelling (A B C & D)
Number
Average Value
Number
Average Value
Number
Average Value
Number
Average Value
Number
Average Value
Number
Average Value
LOANS ORIGINATED
8
$54,979
31
$66,937
185
$95,604
17
$10,128
10
$35,122
9
$43,808
APPLICATIONS APPROVED, NOT ACCEPTED
1
$54,220
2
$82,285
14
$104,277
0
$0
0
$0
2
$54,995
APPLICATIONS DENIED
3
$40,763
5
$63,106
38
$89,113
6
$16,255
1
$37,180
1
$7,750
APPLICATIONS WITHDRAWN
1
$63,520
0
$0
11
$81,536
2
$33,290
0
$0
0
$0
FILES CLOSED FOR INCOMPLETENESS
0
$0
0
$0
2
$31,230
0
$0
0
$0
0
$0
Aggregated Statistics For Year 2008 (Based on 4 partial tracts)
A) FHA, FSA/RHS & VA Home Purchase Loans
B) Conventional Home Purchase Loans
C) Refinancings
D) Home Improvement Loans
F) Non-occupant Loans on < 5 Family Dwellings (A B C & D)
G) Loans On Manufactured Home Dwelling (A B C & D)
Number
Average Value
Number
Average Value
Number
Average Value
Number
Average Value
Number
Average Value
Number
Average Value
LOANS ORIGINATED
13
$94,005
43
$64,739
119
$91,011
22
$20,140
22
$49,149
5
$97,142
APPLICATIONS APPROVED, NOT ACCEPTED
1
$132,850
0
$0
9
$98,891
0
$0
1
$137,100
2
$65,840
APPLICATIONS DENIED
4
$120,208
12
$46,991
41
$88,650
14
$37,530
4
$63,698
4
$38,908
APPLICATIONS WITHDRAWN
1
$55,520
6
$75,347
27
$109,656
3
$34,393
0
$0
1
$130,860
FILES CLOSED FOR INCOMPLETENESS
3
$110,173
1
$90,220
5
$114,658
0
$0
0
$0
1
$83,660
Aggregated Statistics For Year 2007 (Based on 4 partial tracts)
A) FHA, FSA/RHS & VA Home Purchase Loans
B) Conventional Home Purchase Loans
C) Refinancings
D) Home Improvement Loans
F) Non-occupant Loans on < 5 Family Dwellings (A B C & D)
G) Loans On Manufactured Home Dwelling (A B C & D)
Number
Average Value
Number
Average Value
Number
Average Value
Number
Average Value
Number
Average Value
Number
Average Value
LOANS ORIGINATED
8
$75,346
70
$59,891
136
$71,178
27
$31,778
22
$37,941
12
$36,602
APPLICATIONS APPROVED, NOT ACCEPTED
2
$60,475
5
$80,948
13
$112,023
1
$13,170
2
$36,280
2
$52,545
APPLICATIONS DENIED
3
$77,717
20
$47,736
78
$82,153
15
$62,525
4
$50,345
1
$92,200
APPLICATIONS WITHDRAWN
0
$0
3
$52,897
23
$83,887
4
$98,130
0
$0
2
$64,290
FILES CLOSED FOR INCOMPLETENESS
0
$0
1
$34,700
1
$60,420
0
$0
0
$0
0
$0
Aggregated Statistics For Year 2006 (Based on 4 partial tracts)
A) FHA, FSA/RHS & VA Home Purchase Loans
B) Conventional Home Purchase Loans
C) Refinancings
D) Home Improvement Loans
F) Non-occupant Loans on < 5 Family Dwellings (A B C & D)
G) Loans On Manufactured Home Dwelling (A B C & D)
Number
Average Value
Number
Average Value
Number
Average Value
Number
Average Value
Number
Average Value
Number
Average Value
LOANS ORIGINATED
6
$64,060
96
$65,518
143
$68,355
33
$19,091
35
$52,265
12
$47,886
APPLICATIONS APPROVED, NOT ACCEPTED
1
$56,550
20
$85,634
13
$62,118
5
$23,492
2
$70,875
5
$68,982
APPLICATIONS DENIED
3
$78,563
59
$69,708
59
$68,961
17
$46,903
11
$66,434
15
$56,522
APPLICATIONS WITHDRAWN
2
$114,255
15
$65,651
37
$93,976
2
$89,370
4
$60,105
3
$86,310
FILES CLOSED FOR INCOMPLETENESS
0
$0
4
$74,165
5
$75,660
1
$17,820
0
$0
0
$0
Aggregated Statistics For Year 2005 (Based on 4 partial tracts)
A) FHA, FSA/RHS & VA Home Purchase Loans
B) Conventional Home Purchase Loans
C) Refinancings
D) Home Improvement Loans
F) Non-occupant Loans on < 5 Family Dwellings (A B C & D)
G) Loans On Manufactured Home Dwelling (A B C & D)
Number
Average Value
Number
Average Value
Number
Average Value
Number
Average Value
Number
Average Value
Number
Average Value
LOANS ORIGINATED
5
$57,366
75
$61,683
142
$71,448
31
$36,511
24
$39,632
10
$31,105
APPLICATIONS APPROVED, NOT ACCEPTED
0
$0
5
$88,292
15
$69,093
2
$27,885
3
$109,713
2
$56,160
APPLICATIONS DENIED
3
$79,783
29
$59,953
62
$67,991
22
$42,194
6
$68,123
9
$64,308
APPLICATIONS WITHDRAWN
1
$48,800
13
$71,217
33
$99,387
9
$108,313
2
$41,240
2
$89,080
FILES CLOSED FOR INCOMPLETENESS
2
$102,610
3
$55,323
6
$78,553
1
$12,890
0
$0
0
$0
Aggregated Statistics For Year 2004 (Based on 4 partial tracts)
A) FHA, FSA/RHS & VA Home Purchase Loans
B) Conventional Home Purchase Loans
C) Refinancings
D) Home Improvement Loans
F) Non-occupant Loans on < 5 Family Dwellings (A B C & D)
G) Loans On Manufactured Home Dwelling (A B C & D)
Detailed PMIC statistics for the following Tracts:9570.00
, 9571.00
2002 - 2018 National Fire Incident Reporting System (NFIRS) incidents
Based on the data from the years 2002 - 2018 the average number of fires per year is 23. The highest number of fires - 38 took place in 2007, and the least - 2 in 2004. The data has a decreasing trend.
When looking into fire subcategories, the most reports belonged to: Outside Fires (40.4%), and Structure Fires (27.3%).
Fire incident types reported to NFIRS in Zip Code 62069


 Nearest zip codes: 62023, 62009, 62085, 62088, 62033, 62056.


 Based on the data from the years 2002 - 2018 the average number of fires per year is 23. The highest number of fires - 38 took place in 2007, and the least - 2 in 2004. The data has a decreasing trend.
 When looking into fire subcategories, the most reports belonged to: Outside Fires (40.4%), and Structure Fires (27.3%).