Estimated zip code population in 2022: 1,230 Zip code population in 2010: 985 Zip code population in 2000: 1,094
Houses and condos: 483 Renter-occupied apartments: 20
% of renters here:
4%
State:
33%
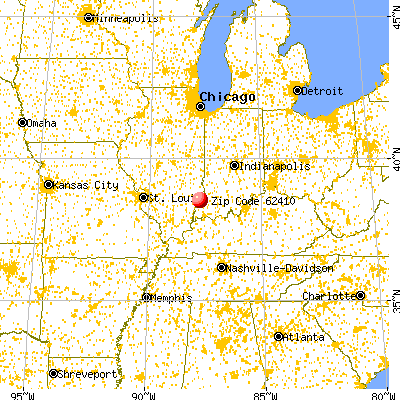
March 2022 cost of living index in zip code 62410: 83.1 (low, U.S. average is 100)
Land area: 37.5 sq. mi. Water area: 0.8 sq. mi.
Population density: 33 people per square mile
(very low).
OSM Map
General Map
Google Map
MSN Map
OSM Map
General Map
Google Map
MSN Map
OSM Map
General Map
Google Map
MSN Map
OSM Map
General Map
Google Map
MSN Map
Please wait while loading the map...
Real estate property taxes paid for housing units in 2022:
This zip code:
1.2% ($1,558)
Illinois:
2.0% ($4,912)
Median real estate property taxes paid for housing units with mortgages in 2022: $1,678 (1.4%) Median real estate property taxes paid for housing units with no mortgage in 2022: $1,432 (1.1%)
Business Search- 14 Million verified businesses
Males: 672
(54.7%)
Females: 557
(45.3%)
For population 25 years and over in 62410:
High school or higher: 94.3%
Bachelor's degree or higher: 23.5%
Graduate or professional degree: 11.6%
Unemployed: 9.2%
Mean travel time to work (commute): 32.0 minutes
For population 15 years and over in 62410:
Never married: 21.0%
Now married: 65.1%
Separated: 0.0%
Widowed: 4.6%
Divorced: 9.3%
Zip code 62410 compared to state average:
Median house value below state average.
Unemployed percentage above state average.
Black race population percentage significantly below state average.
Hispanic race population percentage significantly below state average.
Foreign-born population percentage significantly below state average.
Renting percentage significantly below state average.
Length of stay since moving in significantly above state average.
Number of rooms per house above state average.
Percentage of population with a bachelor's degree or higher below state average.
Averages for the 2020 tax year for zip code 62410, filed in 2021:
Average Adjusted Gross Income (AGI) in 2020: $58,977 (Individual Income Tax Returns)
Here:
$58,977
State:
$82,626
Salary/wage: $46,763 (reported on 81.4% of returns)
Here:
$46,763
State:
$66,640
(% of AGI for various income ranges: 1164.4% for AGIs below $25k, 3271.4% for AGIs $25k-50k, 6100.0% for AGIs $50k-75k, 11063.3% for AGIs $75k-100k, 16650.0% for AGIs $100k-200k)
Taxable interest for individuals: $1,053 (reported on 34.9% of returns)
This zip code:
$1,053
Illinois:
$2,376
(% of AGI for various income ranges: 17.8% for AGIs below $25k, 106.0% for AGIs $50k-75k, 153.3% for AGIs $75k-100k, 107.5% for AGIs $100k-200k)
Ordinary dividends: $5,400 (reported on 20.9% of returns)
Here:
$5,400
State:
$9,061
(% of AGI for various income ranges: 360.0% for AGIs $50k-75k, 765.0% for AGIs $100k-200k)
Net capital gain/loss in AGI: +$2,200 (reported on 16.3% of returns)
Here:
+$2,200
State:
+$31,684
(% of AGI for various income ranges: 56.0% for AGIs $50k-75k, 315.0% for AGIs $100k-200k)
Profit/loss from business: +$6,480 (reported on 11.6% of returns)
Here:
+$6,480
State:
+$12,175
(% of AGI for various income ranges: 223.3% for AGIs below $25k, 410.0% for AGIs $75k-100k)
Taxable individual retirement arrangement distribution: $9,020 (reported on 11.6% of returns)
62410:
$9,020
Illinois:
$21,613
(% of AGI for various income ranges: 177.8% for AGIs below $25k, 970.0% for AGIs $75k-100k)
Earned income credit: $2,483 (reported on 14.0% of returns)
Here:
$2,483
State:
$2,311
(% of AGI for various income ranges: 165.6% for AGIs below $25k)
Percentage of individuals using paid preparers for their 2020 taxes: 95.3%
Here:
95%
State:
93%
(% for various income ranges: 92.9% for AGIs below $25k, 100.0% for AGIs $25k-50k, 100.0% for AGIs $50k-75k, 83.3% for AGIs $75k-100k, 100.0% for AGIs $100k-200k)
Averages for the 2012 tax year for zip code 62410, filed in 2013:
Average Adjusted Gross Income (AGI) in 2012: $46,857 (Individual Income Tax Returns)
Here:
$46,857
State:
$68,058
Salary/wage: $40,468 (reported on 82.6% of returns)
Here:
$40,468
State:
$55,396
(% of AGI for various income ranges: 78.7% for AGIs below $25k, 71.8% for AGIs $25k-50k, 77.3% for AGIs $50k-75k, 75.4% for AGIs $75k-100k, 62.0% for AGIs $100k-200k)
Taxable interest for individuals: $582 (reported on 37.0% of returns)
This zip code:
$582
Illinois:
$1,969
(% of AGI for various income ranges: 0.5% for AGIs below $25k, 0.8% for AGIs $25k-50k, 0.3% for AGIs $50k-75k, 0.4% for AGIs $75k-100k, 0.4% for AGIs $100k-200k)
Ordinary dividends: $2,127 (reported on 23.9% of returns)
Here:
$2,127
State:
$7,786
(% of AGI for various income ranges: 1.0% for AGIs $25k-50k, 3.1% for AGIs $50k-75k, 0.8% for AGIs $100k-200k)
Net capital gain/loss in AGI: +$83 (reported on 13.0% of returns)
Here:
+$83
State:
+$22,183
Profit/loss from business: +$4,333 (reported on 13.0% of returns)
Here:
+$4,333
State:
+$12,903
Taxable individual retirement arrangement distribution: $7,600 (reported on 8.7% of returns)
62410:
$7,600
Illinois:
$17,929
Total itemized deductions: $18,243 (16% of AGI, reported on 15.2% of returns)
Here:
$18,243
State:
$26,433
Here:
16.4% of AGI
State:
19.2% of AGI
(% of AGI for various income ranges: 14.3% for AGIs $50k-75k, 9.4% for AGIs $100k-200k)
Charity contributions: $5,020 (reported on 10.9% of returns)
Here:
$5,020
State:
$4,525
Taxes paid: $7,257 (reported on 15.2% of returns)
62410:
$7,257
State:
$11,968
Earned income credit: $2,229 (reported on 15.2% of returns)
Here:
$2,229
State:
$2,349
(% of AGI for various income ranges: 5.8% for AGIs below $25k, 1.1% for AGIs $25k-50k)
Percentage of individuals using paid preparers for their 2012 taxes: 76.1%
Here:
76%
State:
57%
(% for various income ranges: 66.7% for AGIs below $25k, 72.7% for AGIs $25k-50k, 87.5% for AGIs $50k-75k, 100.0% for AGIs $75k-100k, 75.0% for AGIs $100k-200k)
Averages for the 2004 tax year for zip code 62410, filed in 2005:
Average Adjusted Gross Income (AGI) in 2004: $37,844 (Individual Income Tax Returns)
Here:
$37,844
State:
$54,625
Salary/wage: $34,237 (reported on 85.5% of returns)
Here:
$34,237
State:
$46,811
(% of AGI for various income ranges: 79.2% for AGIs below $10k, 67.2% for AGIs $10k-25k, 78.5% for AGIs $25k-50k, 83.0% for AGIs $50k-75k, 84.3% for AGIs $75k-100k, 61.7% for AGIs over 100k)
Taxable interest for individuals: $813 (reported on 49.0% of returns)
This zip code:
$813
Illinois:
$2,101
(% of AGI for various income ranges: 4.2% for AGIs below $10k, 3.1% for AGIs $10k-25k, 1.2% for AGIs $25k-50k, 0.7% for AGIs $50k-75k, 0.4% for AGIs $75k-100k, 0.4% for AGIs over 100k)
Taxable dividends: $1,207 (reported on 28.8% of returns)
Here:
$1,207
State:
$4,306
(% of AGI for various income ranges: 1.5% for AGIs below $10k, 2.1% for AGIs $10k-25k, 1.2% for AGIs $25k-50k, 0.7% for AGIs $50k-75k, 1.0% for AGIs $75k-100k)
Net capital gain/loss: +$203 (reported on 14.7% of returns)
Here:
+$203
State:
+$17,321
(% of AGI for various income ranges: 0.1% for AGIs $10k-25k, -0.1% for AGIs $25k-50k, 0.1% for AGIs $50k-75k, 0.3% for AGIs $75k-100k)
Profit/loss from business: +$3,852 (reported on 11.5% of returns)
Here:
+$3,852
State:
+$11,771
Total itemized deductions: $13,179 (21% of AGI, reported on 17.9% of returns)
Here:
$13,179
State:
$20,239
Here:
20.9% of AGI
State:
19.5% of AGI
(% of AGI for various income ranges: 6.0% for AGIs $10k-25k, 4.8% for AGIs $25k-50k, 6.7% for AGIs $50k-75k, 6.1% for AGIs $75k-100k, 8.8% for AGIs over 100k)
Charity contributions deductions: $3,662 (6% of AGI, reported on 15.1% of returns)
Here:
$3,662
State:
$3,719
Here:
5.6% of AGI
State:
3.4% of AGI
(% of AGI for various income ranges: 6.0% for AGIs below $10k, 0.7% for AGIs $25k-50k, 1.5% for AGIs $50k-75k, 2.1% for AGIs $75k-100k, 1.8% for AGIs over 100k)
Total tax: $4,050 (reported on 76.5% of returns)
62410:
$4,050
State:
$9,882
(% of AGI for various income ranges: 1.9% for AGIs below $10k, 4.4% for AGIs $10k-25k, 7.0% for AGIs $25k-50k, 8.5% for AGIs $50k-75k, 10.8% for AGIs $75k-100k, 9.9% for AGIs over 100k)
Earned income credit: $1,800 (reported on 12.8% of returns)
Here:
$1,800
State:
$1,788
Percentage of individuals using paid preparers for their 2004 taxes: 75.9%
Here:
76%
State:
61%
(% for various income ranges: 59.4% for AGIs below $10k, 78.4% for AGIs $10k-25k, 85.2% for AGIs $25k-50k, 78.0% for AGIs $50k-75k, 76.9% for AGIs $75k-100k, 84.2% for AGIs over 100k)
Likely homosexual households (counted as self-reported same-sex unmarried-partner households)
Lesbian couples: 0.4% of all households
Gay men: 0.0% of all households
Household received Food Stamps/SNAP in the past 12 months: 45 Household did not receive Food Stamps/SNAP in the past 12 months: 415
Women who had a birth in the past 12 months: 22 (19 now married, 2 unmarried) Women who did not have a birth in the past 12 months: 227 (150 now married, 74 unmarried)
Housing units in zip code 62410 with a mortgage: 177 (15 second mortgage, 8 both second mortgage and home equity loan) Median monthly owner costs for units with a mortgage: $1,059 Median monthly owner costs for units without a mortgage: $456
Residents with income below the poverty level in 2022:
This zip code:
10.6%
Whole state:
11.9%
Residents with income below 50% of the poverty level in 2022:
This zip code:
4.0%
Whole state:
5.7%
Median number of rooms in houses and condos:
Here:
6.9
State:
6.4
Median number of rooms in apartments:
Here:
4.8
State:
4.1
Notable locations in this zip code not listed on our city pages
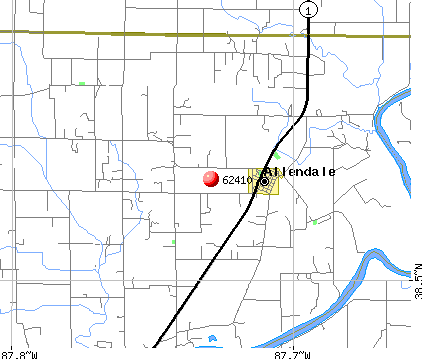
Churches in zip code 62410 include: Adams Corner United Methodist Church (A), Simpson Church (B), Allendale United Methodist Church (C), First Christian Church (D). Display/hide their locations on the map
Cemeteries: Allendale Cemetery (1), Armstrong Cemetery (2), Jordan Cemetery (3), Adams Corner Cemetery (4), Craig Farm Cemetery (5), Oreo Cemetery (6), Spidle Cemetery (7). Display/hide their locations on the map
Size of family households: 167 2-persons, 98 3-persons, 68 4-persons, 11 5-persons, 7 6-persons, 12 7-or-more-persons
Size of nonfamily households: 85 1-person, 11 2-persons
224 married couples with children.
36 single-parent households (8 men, 28 women).
97.7% of residents of 62410 zip code speak English at home.
0.6% of residents speak Spanish at home (100% not well).
1.1% of residents speak other Indo-European language at home (38% very well, 15% well, 31% not well, 15% not at all).
Foreign born population: 19 (1.5%) (63.4% of them are naturalized citizens)
This zip code:
1.5%
Whole state:
14.4%
47%Bhutan
21%Hong Kong
11%Netherlands
39%German
23%English
8%American
6%Irish
3%Scotch-Irish
2%Scottish
0%Italian
Year of entry for the foreign-born population
132010 or later
32000 to 2009
11990 to 1999
2Before 1990
Facilities with environmental interests located in this zip code:
ALLENDALE NORTH STP (ILLINOIS ROUTE 1 NORTH in ALLENDALE, IL)
STATE MASTER (Illinois EPA Project) - National Pollutant Discharge Elimination System Permit National Pollutant Discharge Elimination System NON-MAJOR (Tracking pollutant discharge elimination systems) - permit National Pollutant Discharge Elimination System NON-MAJOR (Tracking pollutant discharge elimination systems) - permit Business SIC classification: SEWERAGE SYSTEMS Alternative names: ALLENDALE-NORTH, VILLAGE OF
ALLENDALE SOUTH STP (SOUTH STREET in ALLENDALE, IL)
STATE MASTER (Illinois EPA Project) - National Pollutant Discharge Elimination System Permit National Pollutant Discharge Elimination System NON-MAJOR (Tracking pollutant discharge elimination systems) - permit National Pollutant Discharge Elimination System NON-MAJOR (Tracking pollutant discharge elimination systems) - permit Business SIC classification: SEWERAGE SYSTEMS Alternative names: ALLENDALE, VILLAGE OF
K/C RECLAMATION LANDFILL (RURAL ROUTE in ALLENDALE, IL)
STATE MASTER (Illinois EPA Project) - AIR PROGRAM AIR MINOR (AIRS/AFS) Business SIC classification: REFUSE SYSTEMS
MARATHON PIPE LINE CO-WABASH TWP STATION (RURAL in ALLENDALE, IL)
STATE MASTER (Illinois EPA Project) - AIR PROGRAM AIR MINOR (AIRS/AFS) Business SIC classification: CRUDE PETROLEUM PIPELINES
ALLENDALE ELEMENTARY SCHOOL (BOX 130 in ALLENDALE, IL)
(Geographic Names Information System) (National Center for Education Statistics) - STATE ID-2009301702001 Organizations: ALLENDALE C C SCHOOL DIST 17 (SCHOOL DISTRICT)
ALLENDALE GRAVEL COMPANY (SECT. 27, TWN. 1N, RGE. 12W in ALLENDALE, IL)
National Pollutant Discharge Elimination System NON-MAJOR (Tracking pollutant discharge elimination systems) - permit
HUGHES, JOHN INC. (HWY 1 - 104 W. STATE STREET in ALLENDALE, IL)
National Pollutant Discharge Elimination System NON-MAJOR (Tracking pollutant discharge elimination systems) - permit Organizations: HUGHES, INC.?JOHN (CONTACT/OWNER)
Alternative names: HUGHES, INC.?JOHN
ILDOT BRG 093 0001 (OVER RACCOON CREEK RTE 1 in ALLENDALE, IL)
Conditionally Exempt Small Quantity Generators, less than 100 kg/month of hazardous waste (Resource Conservation and Recovery Act (tracking hazardous waste)) - notification
ALLENDALE C C SD (THIRD & MAIN ST in ALLENDALE, IL)
COMPLIANCE ACTIVITY (Tracking inspections of insecticide, fungicide, and rodenticide, and toxic substances)
Housing units lacking complete plumbing facilities: 1.7% Housing units lacking complete kitchen facilities: 1.7%
41.2%Bottled, tank, or LP gas
27.5%Utility gas
20.7%Electricity
8.4%Wood
1.1%Other fuel
0.7%Fuel oil, kerosene, etc.
0.7%No fuel used
Population in 1990: 1,051. Population change in the 1990s: +43 (+4.1%).
Place of birth for U.S.-born residents:
This state: 607
Northeast: 1
Midwest: 534
South: 57
West: 14
75% of the 62410 zip code residents lived in the same house 5 years ago. Out of people who lived in different houses, 70% lived in this county. Out of people who lived in different counties, 50% lived in Illinois.
94% of the 62410 zip code residents lived in the same house 1 year ago. Out of people who lived in different houses, 36% moved from this county. Out of people who lived in different houses, 43% moved from different county within same state. Out of people who lived in different houses, 11% moved from different state. Out of people who lived in different houses, 15% moved from abroad.
Private vs. public school enrollment:
Students in private schools in grades 1 to 8 (elementary and middle school): 32
Here:
21.7%
Illinois:
13.3%
Students in private schools in grades 9 to 12 (high school): 15
Here:
23.5%
Illinois:
9.9%
Students in private undergraduate colleges:
Here:
0.0%
Illinois:
27.4%
Occupation by median earnings in the past 12 months ($)
80,479Health diagnosing and treating practitioners and other technical occupations
75,235Law enforcement workers including supervisors
68,215Management occupations
64,804Sales and related occupations
60,098Architecture and engineering occupations
50,936Business and financial operations occupations
Top industries in this zip code by the number of employees in 2005:
Construction: Highway, Street, and Bridge Construction (10-19 employees: 1 establishment)
Construction: Water and Sewer Line and Related Structures Construction (10-19: 1)
Finance and Insurance: Commercial Banking (5-9: 1)
Other Services (except Public Administration): Religious Organizations (1-4: 2)
Other Services (except Public Administration): Cemeteries and Crematories (1-4: 1)
People in group quarters in 2000:
19 people in homes or halfway houses for drug/alcohol abuse
2002 - 2018 National Fire Incident Reporting System (NFIRS) incidents
According to the data from the years 2002 - 2018 the average number of fire incidents per year is 11. The highest number of reported fires - 23 took place in 2007, and the least - 3 in 2016. The data has a declining trend.
When looking into fire subcategories, the most incidents belonged to: Outside Fires (32.5%), and Structure Fires (29.8%).
Fire incident types reported to NFIRS in Zip Code 62410


 Nearest zip codes: 62460, 47524, 62417, 62863, 47666, 62466.


 According to the data from the years 2002 - 2018 the average number of fire incidents per year is 11. The highest number of reported fires - 23 took place in 2007, and the least - 3 in 2016. The data has a declining trend.
 When looking into fire subcategories, the most incidents belonged to: Outside Fires (32.5%), and Structure Fires (29.8%).