Estimated zip code population in 2022: 1,154 Zip code population in 2010: 1,231 Zip code population in 2000: 1,188
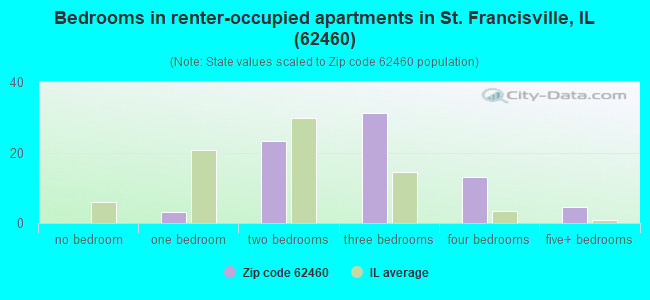
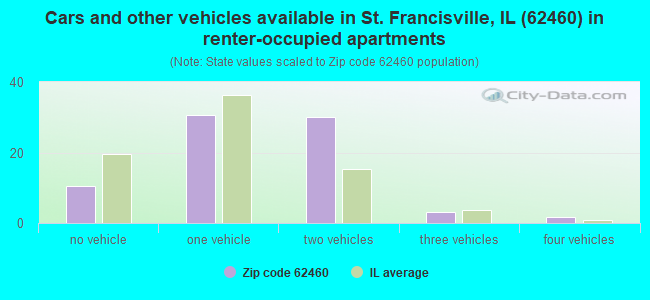
Houses and condos: 489 Renter-occupied apartments: 77
% of renters here:
18%
State:
33%
March 2022 cost of living index in zip code 62460: 83.9 (less than average, U.S. average is 100)
Land area: 46.2 sq. mi. Water area: 0.5 sq. mi.
Population density: 25 people per square mile
(very low).
OSM Map
General Map
Google Map
MSN Map
OSM Map
General Map
Google Map
MSN Map
OSM Map
General Map
Google Map
MSN Map
OSM Map
General Map
Google Map
MSN Map
Please wait while loading the map...
Real estate property taxes paid for housing units in 2022:
This zip code:
1.0% ($906)
Illinois:
2.0% ($4,912)
Median real estate property taxes paid for housing units with mortgages in 2022: $1,389 (1.4%) Median real estate property taxes paid for housing units with no mortgage in 2022: $824 (0.9%)
Business Search- 14 Million verified businesses
Males: 660
(57.2%)
Females: 494
(42.8%)
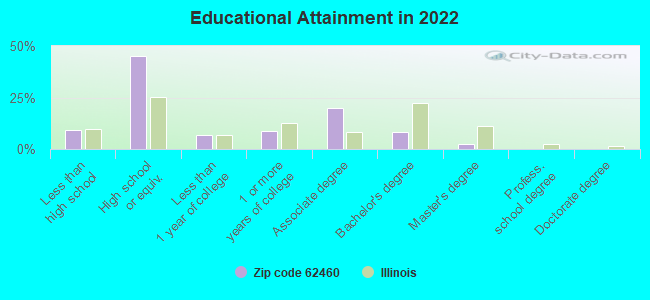
For population 25 years and over in 62460:
High school or higher: 90.5%
Bachelor's degree or higher: 10.8%
Graduate or professional degree: 2.3%
Unemployed: 8.7%
Mean travel time to work (commute): 26.2 minutes
For population 15 years and over in 62460:
Never married: 26.1%
Now married: 54.4%
Separated: 0.2%
Widowed: 9.1%
Divorced: 10.2%
Zip code 62460 compared to state average:
Median house value significantly below state average.
Unemployed percentage above state average.
Black race population percentage significantly below state average.
Hispanic race population percentage significantly below state average.
Median age above state average.
Foreign-born population percentage significantly below state average.
Renting percentage below state average.
Length of stay since moving in significantly above state average.
Number of college students significantly below state average.
Percentage of population with a bachelor's degree or higher significantly below state average.
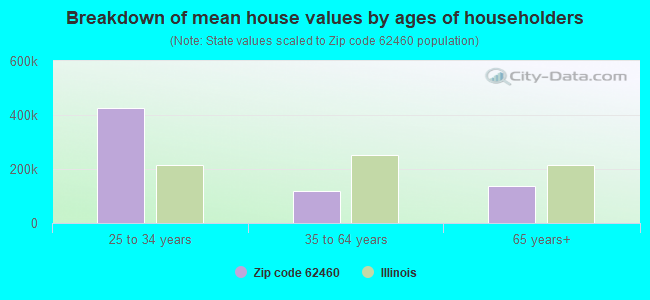
Estimated median house/condo value in 2022: $91,759
62460:
$91,759
Illinois:
$251,600
Median resident age:
This zip code:
45.6 years
Illinois median age:
39.1 years
Average household size:
This zip code:
2.6 people
Illinois:
2.4 people
Averages for the 2020 tax year for zip code 62460, filed in 2021:
Average Adjusted Gross Income (AGI) in 2020: $54,098 (Individual Income Tax Returns)
Here:
$54,098
State:
$82,626
Salary/wage: $44,008 (reported on 81.2% of returns)
Here:
$44,008
State:
$66,640
(% of AGI for various income ranges: 1150.0% for AGIs below $25k, 3510.0% for AGIs $25k-50k, 6956.0% for AGIs $50k-75k, 10195.0% for AGIs $75k-100k, 18063.3% for AGIs $100k-200k)
Taxable interest for individuals: $1,147 (reported on 31.2% of returns)
This zip code:
$1,147
Illinois:
$2,376
(% of AGI for various income ranges: 7.5% for AGIs below $25k, 22.5% for AGIs $25k-50k, 56.0% for AGIs $50k-75k, 82.5% for AGIs $75k-100k, 280.0% for AGIs $100k-200k)
Ordinary dividends: $1,400 (reported on 18.8% of returns)
Here:
$1,400
State:
$9,061
(% of AGI for various income ranges: 45.8% for AGIs below $25k, 114.0% for AGIs $50k-75k, 46.7% for AGIs $100k-200k)
Net capital gain/loss in AGI: +$6,800 (reported on 12.5% of returns)
Here:
+$6,800
State:
+$31,684
(% of AGI for various income ranges: 11.2% for AGIs $25k-50k, 997.5% for AGIs $75k-100k)
Profit/loss from business: +$3,400 (reported on 10.4% of returns)
Here:
+$3,400
State:
+$12,175
(% of AGI for various income ranges: 340.0% for AGIs $50k-75k)
Taxable individual retirement arrangement distribution: $12,580 (reported on 10.4% of returns)
62460:
$12,580
Illinois:
$21,613
(% of AGI for various income ranges: 175.8% for AGIs below $25k, 836.0% for AGIs $50k-75k)
Earned income credit: $2,257 (reported on 14.6% of returns)
Here:
$2,257
State:
$2,311
(% of AGI for various income ranges: 75.8% for AGIs below $25k, 83.8% for AGIs $25k-50k)
Percentage of individuals using paid preparers for their 2020 taxes: 95.8%
Here:
96%
State:
93%
(% for various income ranges: 94.1% for AGIs below $25k, 100.0% for AGIs $25k-50k, 100.0% for AGIs $50k-75k, 85.7% for AGIs $75k-100k, 100.0% for AGIs $100k-200k)
Averages for the 2012 tax year for zip code 62460, filed in 2013:
Average Adjusted Gross Income (AGI) in 2012: $48,829 (Individual Income Tax Returns)
Here:
$48,829
State:
$68,058
Salary/wage: $37,016 (reported on 82.7% of returns)
Here:
$37,016
State:
$55,396
(% of AGI for various income ranges: 69.3% for AGIs below $25k, 72.7% for AGIs $25k-50k, 85.0% for AGIs $50k-75k, 68.3% for AGIs $75k-100k, 38.7% for AGIs $100k-200k)
Taxable interest for individuals: $995 (reported on 38.5% of returns)
This zip code:
$995
Illinois:
$1,969
(% of AGI for various income ranges: 1.4% for AGIs below $25k, 0.8% for AGIs $25k-50k, 0.5% for AGIs $50k-75k, 0.6% for AGIs $75k-100k, 0.8% for AGIs $100k-200k)
Ordinary dividends: $1,825 (reported on 23.1% of returns)
Here:
$1,825
State:
$7,786
(% of AGI for various income ranges: 0.7% for AGIs below $25k, 0.9% for AGIs $25k-50k, 0.8% for AGIs $50k-75k, 1.4% for AGIs $100k-200k)
Net capital gain/loss in AGI: +$7,480 (reported on 9.6% of returns)
Here:
+$7,480
State:
+$22,183
Profit/loss from business: +$11,471 (reported on 13.5% of returns)
Here:
+$11,471
State:
+$12,903
Taxable individual retirement arrangement distribution: $5,350 (reported on 7.7% of returns)
62460:
$5,350
Illinois:
$17,929
Total itemized deductions: $16,400 (15% of AGI, reported on 15.4% of returns)
Here:
$16,400
State:
$26,433
Here:
15.4% of AGI
State:
19.2% of AGI
Charity contributions: $2,167 (reported on 5.8% of returns)
Here:
$2,167
State:
$4,525
Taxes paid: $6,325 (reported on 15.4% of returns)
62460:
$6,325
State:
$11,968
Earned income credit: $2,150 (reported on 19.2% of returns)
Here:
$2,150
State:
$2,349
(% of AGI for various income ranges: 5.3% for AGIs below $25k, 1.5% for AGIs $25k-50k)
Percentage of individuals using paid preparers for their 2012 taxes: 73.1%
Here:
73%
State:
57%
(% for various income ranges: 63.6% for AGIs below $25k, 75.0% for AGIs $25k-50k, 75.0% for AGIs $50k-75k, 83.3% for AGIs $75k-100k, 100.0% for AGIs $100k-200k)
Averages for the 2004 tax year for zip code 62460, filed in 2005:
Average Adjusted Gross Income (AGI) in 2004: $34,838 (Individual Income Tax Returns)
Here:
$34,838
State:
$54,625
Salary/wage: $31,177 (reported on 85.4% of returns)
Here:
$31,177
State:
$46,811
(% of AGI for various income ranges: 79.3% for AGIs below $10k, 74.9% for AGIs $10k-25k, 80.6% for AGIs $25k-50k, 80.4% for AGIs $50k-75k, 74.1% for AGIs $75k-100k, 59.2% for AGIs over 100k)
Taxable interest for individuals: $1,179 (reported on 44.3% of returns)
This zip code:
$1,179
Illinois:
$2,101
(% of AGI for various income ranges: 7.0% for AGIs below $10k, 2.8% for AGIs $10k-25k, 1.4% for AGIs $25k-50k, 1.0% for AGIs $50k-75k, 1.7% for AGIs $75k-100k, 0.3% for AGIs over 100k)
Taxable dividends: $1,108 (reported on 24.4% of returns)
Here:
$1,108
State:
$4,306
(% of AGI for various income ranges: 0.7% for AGIs below $10k, 2.2% for AGIs $10k-25k, 0.8% for AGIs $25k-50k, 0.2% for AGIs $50k-75k, 1.2% for AGIs $75k-100k, 0.2% for AGIs over 100k)
Net capital gain/loss: +$500 (reported on 12.0% of returns)
Here:
+$500
State:
+$17,321
(% of AGI for various income ranges: -0.1% for AGIs $10k-25k, 0.0% for AGIs $25k-50k, 0.6% for AGIs $50k-75k, -0.1% for AGIs $75k-100k)
Profit/loss from business: +$6,458 (reported on 12.7% of returns)
Here:
+$6,458
State:
+$11,771
(% of AGI for various income ranges: 2.2% for AGIs $10k-25k, 1.0% for AGIs $25k-50k, 4.9% for AGIs $50k-75k, 1.7% for AGIs $75k-100k)
Profit/loss from farming: +$4,167 (reported on 4.2% of returns)
Here:
+$4,167
State:
+$2,327
IRA payment deduction: $2,500 (reported on 3.2% of returns)
62460:
$2,500
Illinois:
$3,087
Total itemized deductions: $15,793 (26% of AGI, reported on 16.2% of returns)
Here:
$15,793
State:
$20,239
Here:
25.6% of AGI
State:
19.5% of AGI
Charity contributions deductions: $2,315 (4% of AGI, reported on 12.8% of returns)
Here:
$2,315
State:
$3,719
Here:
3.6% of AGI
State:
3.4% of AGI
Total tax: $4,200 (reported on 72.8% of returns)
62460:
$4,200
State:
$9,882
(% of AGI for various income ranges: 2.2% for AGIs below $10k, 3.6% for AGIs $10k-25k, 6.5% for AGIs $25k-50k, 9.2% for AGIs $50k-75k, 11.1% for AGIs $75k-100k, 17.3% for AGIs over 100k)
Earned income credit: $1,571 (reported on 16.0% of returns)
Here:
$1,571
State:
$1,788
Percentage of individuals using paid preparers for their 2004 taxes: 78.7%
Here:
79%
State:
61%
(% for various income ranges: 74.1% for AGIs below $10k, 74.8% for AGIs $10k-25k, 77.6% for AGIs $25k-50k, 85.4% for AGIs $50k-75k, 91.4% for AGIs $75k-100k, 87.5% for AGIs over 100k)
Household received Food Stamps/SNAP in the past 12 months: 25 Household did not receive Food Stamps/SNAP in the past 12 months: 408
Women who had a birth in the past 12 months: 18 (4 now married, 13 unmarried) Women who did not have a birth in the past 12 months: 144 (84 now married, 58 unmarried)
Housing units in zip code 62460 with a mortgage: 95 Houses without a mortgage: 16
Median monthly owner costs for units with a mortgage: $936 Median monthly owner costs for units without a mortgage: $391
Residents with income below the poverty level in 2022:
This zip code:
8.0%
Whole state:
11.9%
Residents with income below 50% of the poverty level in 2022:
This zip code:
6.5%
Whole state:
5.7%
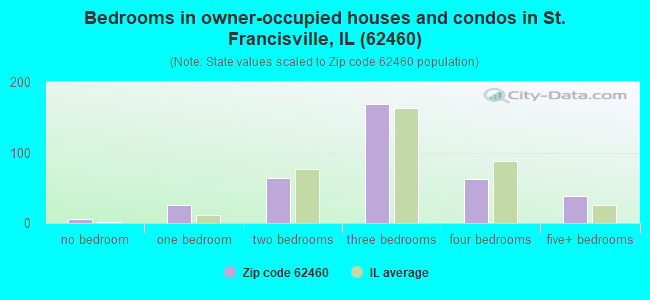
Median number of rooms in houses and condos:
Here:
6.2
State:
6.4
Median number of rooms in apartments:
Here:
5.6
State:
4.1
Notable locations in this zip code not listed on our city pages
Notable locations in zip code 62460: Denison Fire Protection District Station 1 (A), Denison Fire Protection District Station 2 (B). Display/hide their locations on the map
Churches in zip code 62460 include: Bethel Church (A), Buchanan Church (B), Free Methodist Church (C), Saint Francis Xavier Catholic Church (D), Liberty Church (E). Display/hide their locations on the map
Cemeteries: Buchanan Cemetery (1), Bunker Hill Cemetery (2), Moffett Cemetery (3), Oak Lawn Cemetery (4), Bethel Cemetery (5), Collins Cemetery (6). Display/hide their locations on the map
Size of family households: 215 2-persons, 26 3-persons, 46 4-persons, 25 5-persons, 3 6-persons
Size of nonfamily households: 97 1-person, 23 2-persons
119 married couples with children.
15 single-parent households (15 women).
98.6% of residents of 62460 zip code speak English at home.
0.5% of residents speak Spanish at home (100% very well).
0.3% of residents speak other Indo-European language at home (100% very well).
Foreign born population: 2 (0.3%) (0.0% of them are naturalized citizens)
:
0.3%
Whole state:
14.4%
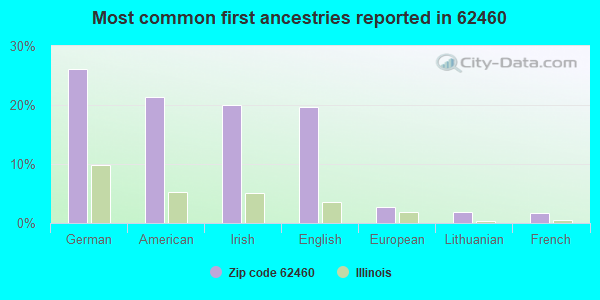
26%German
21%American
20%Irish
20%English
3%European
2%Lithuanian
2%French
Year of entry for the foreign-born population
02010 or later
02000 to 2009
01990 to 1999
2Before 1990
Facilities with environmental interests located in this zip code:
MARATHON ASHLAND PIPE LINE LLC (DENNISON TWP. in SAINT FRANCISVILLE, IL)
STATE MASTER (Illinois EPA Project) - AIR PROGRAM AIR MINOR (AIRS/AFS) CRITERIA AND HAZARDOUS AIR POLLUTANT INVENTORY (Inventory of air pollution sources) Business SIC classification: REFINED PETROLEUM PIPELINES Alternative names: MARATHON ASHLAND PIPELINE LLC
AKIN SEED COMPANY (RTE 1 BOX 203 in SAINT FRANCISVILLE, IL)
STATE MASTER (Illinois EPA Project) - HAZARDOUS WASTE PROGRAM Conditionally Exempt Small Quantity Generators, less than 100 kg/month of hazardous waste (Resource Conservation and Recovery Act (tracking hazardous waste)) - notification Organizations: AKIN CLARENCE (CONTACT/OWNER)
MT. CARMEL MUNICIPAL AIRPORT (R.R. 1, BOX 54 in ST FRANCISVILLE, IL)
CRITERIA AND HAZARDOUS AIR POLLUTANT INVENTORY (Inventory of air pollution sources) National Pollutant Discharge Elimination System NON-MAJOR (Tracking pollutant discharge elimination systems) - permit Business SIC classification: AIRPORTS, FLYING FIELDS, AND AIRPORT TERMINAL SERVICES Alternative names: MT. CARMEL AIRPORT
MARATHON PIPELINE LLC (SEC 20, T2N, R11W in ST FRANCISVILLE, IL)
Conditionally Exempt Small Quantity Generators, less than 100 kg/month of hazardous waste (Resource Conservation and Recovery Act (tracking hazardous waste))
SAINT FRANCISVILLE, CITY OF (4TH & PLUM STREET in SAINT FRANCISVILLE, IL)
National Pollutant Discharge Elimination System NON-MAJOR (Tracking pollutant discharge elimination systems) - permit Business SIC classification: SEWERAGE SYSTEMS Alternative names: ST. FRANCISVILLE, CITY OF
Housing units lacking complete plumbing facilities: 6.8% Housing units lacking complete kitchen facilities: 8.6%
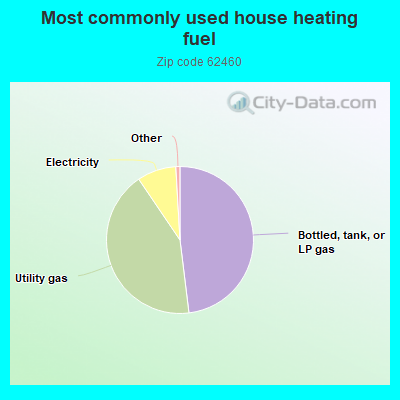
48.2%Bottled, tank, or LP gas
42.6%Utility gas
8.6%Electricity
Population in 1990: 1,806.
Place of birth for U.S.-born residents:
This state: 616
Northeast: 1
Midwest: 441
South: 57
West: 38
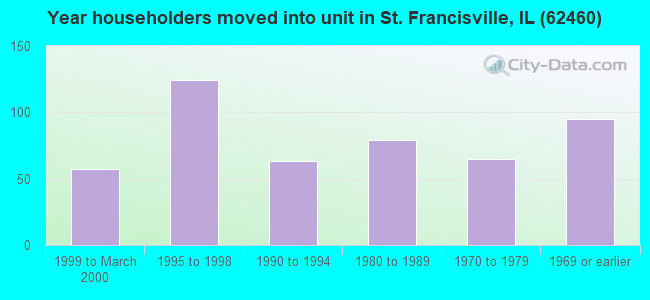
67% of the 62460 zip code residents lived in the same house 5 years ago. Out of people who lived in different houses, 77% lived in this county. Out of people who lived in different counties, 50% lived in Illinois.
89% of the 62460 zip code residents lived in the same house 1 year ago. Out of people who lived in different houses, 38% moved from this county. Out of people who lived in different houses, 65% moved from different state.
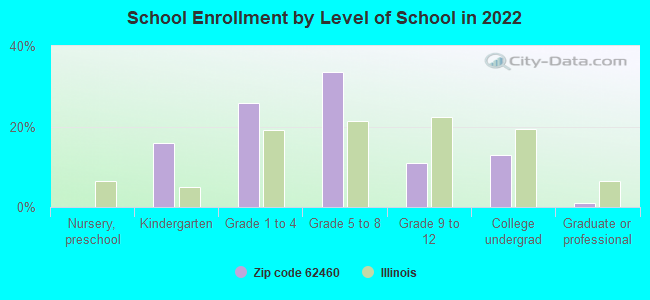
Private vs. public school enrollment:
Students in private schools in grades 1 to 8 (elementary and middle school): 2
Here:
3.4%
Illinois:
13.3%
Students in private schools in grades 9 to 12 (high school):
Here:
0.0%
Illinois:
9.9%
Students in private undergraduate colleges:
Here:
0.0%
Illinois:
27.4%
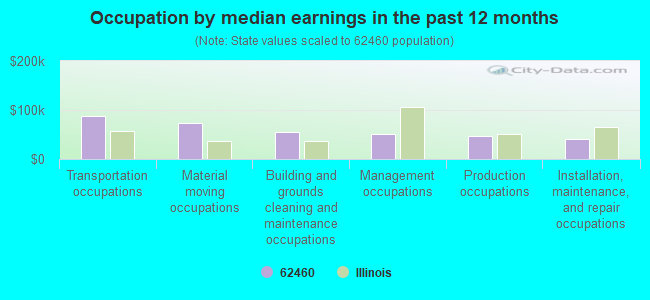
Occupation by median earnings in the past 12 months ($)
87,555Transportation occupations
73,899Material moving occupations
54,204Building and grounds cleaning and maintenance occupations
50,383Management occupations
46,909Production occupations
41,466Installation, maintenance, and repair occupations
Top industries in this zip code by the number of employees in 2005:
Educational Services: Elementary and Secondary Schools (5-9 employees: 1 establishment)
Construction: Structural Steel and Precast Concrete Contractors (5-9: 1)
Professional, Scientific, and Technical Services: Other Services Related to Advertising (5-9: 1)
Other Services (except Public Administration): Commercial and Industrial Machinery and Equipment (except Automotive and Electronic) Repair and Maintenance (1-4: 1)
Other Services (except Public Administration): General Automotive Repair (1-4: 1)
Other Services (except Public Administration): Civic and Social Organizations (1-4: 1)
2002 - 2018 National Fire Incident Reporting System (NFIRS) incidents
Based on the data from the years 2002 - 2018 the average number of fire incidents per year is 12. The highest number of fire incidents - 32 took place in 2005, and the least - 1 in 2013. The data has a dropping trend.
When looking into fire subcategories, the most incidents belonged to: Outside Fires (39.4%), and Structure Fires (36.9%).
Fire incident types reported to NFIRS in Zip Code 62460


 Nearest zip codes: 62410, 62417, 47524, 62439, 62466, 47591.


 Based on the data from the years 2002 - 2018 the average number of fire incidents per year is 12. The highest number of fire incidents - 32 took place in 2005, and the least - 1 in 2013. The data has a dropping trend.
 When looking into fire subcategories, the most incidents belonged to: Outside Fires (39.4%), and Structure Fires (36.9%).