Estimated zip code population in 2022: 643 Zip code population in 2010: 854 Zip code population in 2000: 793
Houses and condos: 329 Renter-occupied apartments: 14
% of renters here:
4%
State:
33%
March 2022 cost of living index in zip code 62461: 83.0 (low, U.S. average is 100)
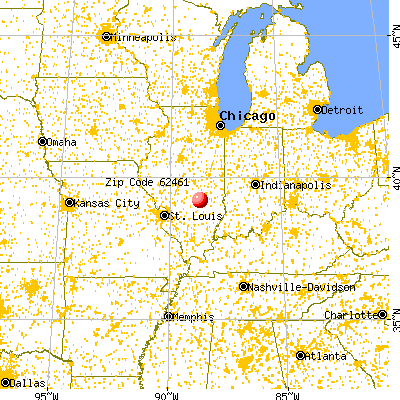
Land area: 40.0 sq. mi. Water area: 0.0 sq. mi.
Population density: 16 people per square mile
(very low).
OSM Map
General Map
Google Map
MSN Map
OSM Map
General Map
Google Map
MSN Map
OSM Map
General Map
Google Map
MSN Map
OSM Map
General Map
Google Map
MSN Map
Please wait while loading the map...
Real estate property taxes paid for housing units in 2022:
This zip code:
1.5% ($2,403)
Illinois:
2.0% ($4,912)
Median real estate property taxes paid for housing units with mortgages in 2022: $2,340 (2.3%) Median real estate property taxes paid for housing units with no mortgage in 2022: $2,504 (2.6%)
Business Search- 14 Million verified businesses
Males: 332
(51.7%)
Females: 310
(48.3%)
For population 25 years and over in 62461:
High school or higher: 94.0%
Bachelor's degree or higher: 17.2%
Graduate or professional degree: 3.1%
Unemployed: 0.6%
Mean travel time to work (commute): 16.2 minutes
For population 15 years and over in 62461:
Never married: 19.1%
Now married: 65.7%
Separated: 0.7%
Widowed: 6.2%
Divorced: 8.3%
Zip code 62461 compared to state average:
Median house value below state average.
Unemployed percentage significantly below state average.
Black race population percentage significantly below state average.
Hispanic race population percentage significantly below state average.
Median age significantly above state average.
Foreign-born population percentage significantly below state average.
Renting percentage significantly below state average.
Length of stay since moving in significantly above state average.
Number of college students significantly below state average.
Percentage of population with a bachelor's degree or higher below state average.
Estimated median house/condo value in 2022: $155,422
62461:
$155,422
Illinois:
$251,600
According to our research of Illinois and other state lists, there was 1 registered sex offender living in 62461 zip code as of May 28, 2024. The ratio of all residents to sex offenders in zip code 62461 is 709 to 1. The ratio of registered sex offenders to all residents in this zip code is near the state average.
Median resident age:
This zip code:
56.9 years
Illinois median age:
39.1 years
Average household size:
This zip code:
2.0 people
Illinois:
2.4 people
Averages for the 2020 tax year for zip code 62461, filed in 2021:
Average Adjusted Gross Income (AGI) in 2020: $57,177 (Individual Income Tax Returns)
Here:
$57,177
State:
$82,626
Salary/wage: $45,428 (reported on 81.8% of returns)
Here:
$45,428
State:
$66,640
(% of AGI for various income ranges: 1212.2% for AGIs below $25k, 3536.2% for AGIs $25k-50k, 6912.5% for AGIs $50k-75k, 10040.0% for AGIs $75k-100k, 16642.5% for AGIs $100k-200k)
Taxable interest for individuals: $764 (reported on 56.8% of returns)
This zip code:
$764
Illinois:
$2,376
(% of AGI for various income ranges: 43.3% for AGIs below $25k, 47.5% for AGIs $25k-50k, 70.0% for AGIs $50k-75k, 80.0% for AGIs $75k-100k, 155.0% for AGIs $100k-200k)
Ordinary dividends: $2,927 (reported on 25.0% of returns)
Here:
$2,927
State:
$9,061
(% of AGI for various income ranges: 66.7% for AGIs below $25k, 97.5% for AGIs $50k-75k, 557.5% for AGIs $100k-200k)
Net capital gain/loss in AGI: +$2,438 (reported on 18.2% of returns)
Here:
+$2,438
State:
+$31,684
(% of AGI for various income ranges: 25.6% for AGIs below $25k, 17.5% for AGIs $50k-75k, 412.5% for AGIs $100k-200k)
Profit/loss from business: +$5,143 (reported on 15.9% of returns)
Here:
+$5,143
State:
+$12,175
(% of AGI for various income ranges: 402.5% for AGIs $25k-50k, 95.0% for AGIs $100k-200k)
Taxable individual retirement arrangement distribution: $13,620 (reported on 11.4% of returns)
62461:
$13,620
Illinois:
$21,613
(% of AGI for various income ranges: 225.6% for AGIs below $25k, 1593.3% for AGIs $75k-100k)
Earned income credit: $1,667 (reported on 13.6% of returns)
Here:
$1,667
State:
$2,311
(% of AGI for various income ranges: 111.1% for AGIs below $25k)
Percentage of individuals using paid preparers for their 2020 taxes: 93.2%
Here:
93%
State:
93%
(% for various income ranges: 92.9% for AGIs below $25k, 90.9% for AGIs $25k-50k, 100.0% for AGIs $50k-75k, 100.0% for AGIs $75k-100k, 87.5% for AGIs $100k-200k)
Averages for the 2012 tax year for zip code 62461, filed in 2013:
Average Adjusted Gross Income (AGI) in 2012: $54,586 (Individual Income Tax Returns)
Here:
$54,586
State:
$68,058
Salary/wage: $36,895 (reported on 84.1% of returns)
Here:
$36,895
State:
$55,396
(% of AGI for various income ranges: 72.4% for AGIs below $25k, 70.8% for AGIs $25k-50k, 72.7% for AGIs $50k-75k, 70.0% for AGIs $75k-100k, 33.4% for AGIs $100k-200k)
Taxable interest for individuals: $1,088 (reported on 59.1% of returns)
This zip code:
$1,088
Illinois:
$1,969
(% of AGI for various income ranges: 3.2% for AGIs below $25k, 1.9% for AGIs $25k-50k, 0.8% for AGIs $50k-75k, 0.7% for AGIs $75k-100k, 0.8% for AGIs $100k-200k)
Ordinary dividends: $1,650 (reported on 22.7% of returns)
Here:
$1,650
State:
$7,786
(% of AGI for various income ranges: 0.7% for AGIs below $25k, 0.6% for AGIs $25k-50k, 0.4% for AGIs $75k-100k, 1.2% for AGIs $100k-200k)
Net capital gain/loss in AGI: +$4,443 (reported on 15.9% of returns)
Here:
+$4,443
State:
+$22,183
Profit/loss from business: +$7,612 (reported on 18.2% of returns)
Here:
+$7,612
State:
+$12,903
Taxable individual retirement arrangement distribution: $2,850 (reported on 9.1% of returns)
62461:
$2,850
Illinois:
$17,929
Total itemized deductions: $17,740 (20% of AGI, reported on 22.7% of returns)
Here:
$17,740
State:
$26,433
Here:
20.1% of AGI
State:
19.2% of AGI
(% of AGI for various income ranges: 20.7% for AGIs below $25k, 16.8% for AGIs $50k-75k, 6.9% for AGIs $100k-200k)
Charity contributions: $4,071 (reported on 15.9% of returns)
Here:
$4,071
State:
$4,525
Taxes paid: $5,910 (reported on 22.7% of returns)
62461:
$5,910
State:
$11,968
(% of AGI for various income ranges: 3.3% for AGIs below $25k, 4.7% for AGIs $50k-75k, 3.5% for AGIs $100k-200k)
Earned income credit: $1,700 (reported on 11.4% of returns)
Here:
$1,700
State:
$2,349
(% of AGI for various income ranges: 4.3% for AGIs below $25k)
Percentage of individuals using paid preparers for their 2012 taxes: 79.5%
Here:
80%
State:
57%
(% for various income ranges: 70.6% for AGIs below $25k, 90.0% for AGIs $25k-50k, 85.7% for AGIs $50k-75k, 80.0% for AGIs $75k-100k, 80.0% for AGIs $100k-200k)
Averages for the 2004 tax year for zip code 62461, filed in 2005:
Average Adjusted Gross Income (AGI) in 2004: $38,147 (Individual Income Tax Returns)
Here:
$38,147
State:
$54,625
Salary/wage: $31,178 (reported on 80.3% of returns)
Here:
$31,178
State:
$46,811
(% of AGI for various income ranges: 114.6% for AGIs below $10k, 63.4% for AGIs $10k-25k, 70.3% for AGIs $25k-50k, 72.8% for AGIs $50k-75k, 71.1% for AGIs $75k-100k, 39.5% for AGIs over 100k)
Taxable interest for individuals: $1,692 (reported on 58.7% of returns)
This zip code:
$1,692
Illinois:
$2,101
(% of AGI for various income ranges: 3.5% for AGIs below $10k, 6.5% for AGIs $10k-25k, 1.5% for AGIs $25k-50k, 3.2% for AGIs $50k-75k, 1.1% for AGIs $75k-100k, 1.8% for AGIs over 100k)
Taxable dividends: $636 (reported on 23.5% of returns)
Here:
$636
State:
$4,306
(% of AGI for various income ranges: 0.6% for AGIs $10k-25k, 0.5% for AGIs $25k-50k, 0.6% for AGIs $50k-75k, 0.3% for AGIs $75k-100k)
Net capital gain/loss: +$3,143 (reported on 21.6% of returns)
Here:
+$3,143
State:
+$17,321
(% of AGI for various income ranges: 0.6% for AGIs $10k-25k, 0.2% for AGIs $25k-50k, 2.6% for AGIs $50k-75k, 6.6% for AGIs $75k-100k)
Profit/loss from business: +$6,538 (reported on 15.4% of returns)
Here:
+$6,538
State:
+$11,771
Profit/loss from farming: +$768 (reported on 13.3% of returns)
Here:
+$768
State:
+$2,327
IRA payment deduction: $2,273 (reported on 2.6% of returns)
62461:
$2,273
Illinois:
$3,087
Total itemized deductions: $13,371 (17% of AGI, reported on 14.7% of returns)
Here:
$13,371
State:
$20,239
Here:
16.5% of AGI
State:
19.5% of AGI
(% of AGI for various income ranges: 6.0% for AGIs $25k-50k, 5.1% for AGIs $50k-75k, 6.2% for AGIs $75k-100k, 6.8% for AGIs over 100k)
Charity contributions deductions: $4,059 (5% of AGI, reported on 12.1% of returns)
Here:
$4,059
State:
$3,719
Here:
4.7% of AGI
State:
3.4% of AGI
(% of AGI for various income ranges: 0.7% for AGIs $25k-50k, 0.7% for AGIs $50k-75k, 2.2% for AGIs $75k-100k, 3.1% for AGIs over 100k)
Total tax: $5,065 (reported on 80.0% of returns)
62461:
$5,065
State:
$9,882
(% of AGI for various income ranges: 3.5% for AGIs below $10k, 5.2% for AGIs $10k-25k, 6.6% for AGIs $25k-50k, 8.5% for AGIs $50k-75k, 11.4% for AGIs $75k-100k, 22.4% for AGIs over 100k)
Earned income credit: $1,326 (reported on 10.9% of returns)
Here:
$1,326
State:
$1,788
Percentage of individuals using paid preparers for their 2004 taxes: 79.8%
Here:
80%
State:
61%
(% for various income ranges: 67.0% for AGIs below $10k, 80.9% for AGIs $10k-25k, 87.0% for AGIs $25k-50k, 79.5% for AGIs $50k-75k, 87.5% for AGIs $75k-100k, 93.3% for AGIs over 100k)
Household received Food Stamps/SNAP in the past 12 months: 12 Household did not receive Food Stamps/SNAP in the past 12 months: 311
Women who had a birth in the past 12 months: 5 (1 now married, 3 unmarried) Women who did not have a birth in the past 12 months: 59 (33 now married, 25 unmarried)
Housing units in zip code 62461 with a mortgage: 119 Median monthly owner costs for units with a mortgage: $1,066 Median monthly owner costs for units without a mortgage: $529
Residents with income below the poverty level in 2022:
This zip code:
8.0%
Whole state:
11.9%
Residents with income below 50% of the poverty level in 2022:
This zip code:
7.1%
Whole state:
5.7%
Median number of rooms in houses and condos:
Here:
6.4
State:
6.4
Median number of rooms in apartments:
Here:
4.9
State:
4.1
Notable locations in this zip code not listed on our city pages
Cemeteries: Agney Cemetery (1), Trinity Lutheran Cemetery (2), Shumway Cemetery (3), Wolf Creek Cemetery (4), Rentfrow Cemetery (5), Saint Marys Cemetery (6). Display/hide their locations on the map
Size of family households: 141 2-persons, 28 3-persons, 13 4-persons, 8 5-persons, 5 6-persons, 8 7-or-more-persons
Size of nonfamily households: 87 1-person, 39 2-persons
63 married couples with children.
11 single-parent households (7 men, 4 women).
98.8% of residents of 62461 zip code speak English at home.
1.3% of residents speak Spanish at home (75% well, 25% not well).
Foreign born population: 7 (1.1%) (100.0% of them are naturalized citizens)
This zip code:
1.1%
Whole state:
14.4%
100%Guatemala
14%France
65%German
22%American
2%English
1%European
1%Dutch
1%British
0%Irish
Year of entry for the foreign-born population
02010 or later
02000 to 2009
51990 to 1999
0Before 1990
Facilities with environmental interests located in this zip code:
SIM PROD (6903 E 1600TH ST in SHUMWAY, IL)
STATE MASTER (Illinois EPA Project) - SOLID WASTE PROGRAM, HAZARDOUS WASTE PROGRAM National Pollutant Discharge Elimination System NON-MAJOR (Tracking pollutant discharge elimination systems) - permit Large Quantity Generators, more that 1000 kg of hazardous waste/month (Resource Conservation and Recovery Act (tracking hazardous waste)) - notification Organizations: NEWSOME JOHN R (CONTACT/OWNER)
SHUMWAY GRADE SCHOOL (304 S WEST ST in SHUMWAY, IL)
(Geographic Names Information System) (National Center for Education Statistics) - STATE ID-0302502002004 Organizations: BEECHER CITY C U SCHOOL DIST 20 (SCHOOL DISTRICT)
SHUMWAY COLLECT & TREAT FAC (105 EAST MAIN in SHUMWAY, IL)
National Pollutant Discharge Elimination System NON-MAJOR (Tracking pollutant discharge elimination systems) - permit Business SIC classification: SEWERAGE SYSTEMS
Housing units lacking complete plumbing facilities: 1.2%
46.4%Bottled, tank, or LP gas
25.5%Utility gas
18.7%Electricity
8.7%Wood
1.2%Other fuel
Population in 1990: 539. Population change in the 1990s: +254 (+47.1%).
Place of birth for U.S.-born residents:
This state: 607
Northeast: 2
Midwest: 21
South: 1
72% of the 62461 zip code residents lived in the same house 5 years ago. Out of people who lived in different houses, 66% lived in this county. Out of people who lived in different counties, 50% lived in Illinois.
95% of the 62461 zip code residents lived in the same house 1 year ago. Out of people who lived in different houses, 12% moved from this county. Out of people who lived in different houses, 92% moved from different county within same state.
Private vs. public school enrollment:
Students in private schools in grades 1 to 8 (elementary and middle school):
Here:
0.0%
Illinois:
13.3%
Students in private schools in grades 9 to 12 (high school):
Here:
0.0%
Illinois:
9.9%
Students in private undergraduate colleges: 1
Here:
20.6%
Illinois:
27.4%
Occupation by median earnings in the past 12 months ($)
61,992Health technologists and technicians
60,396Construction and extraction occupations
56,401Production occupations
50,851Sales and related occupations
49,515Transportation occupations
46,992Material moving occupations
Companies with federal contracts located in this zip code:
BALES UNLIMITED INC (9845 E 1900TH AVE in SHUMWAY, IL; small business) : $10,493 in 3 contractsfrom 2004 to 2005
$7,724 with Army for Passenger Motor Charter Service. Signed on 2005-06-15. Completion date: 2005-06-24.
$4,700 with Army for Motor Passenger Services. Signed on 2004-01-26. Completion date: 2004-05-04.
-$1,931 with Army for Passenger Motor Charter Service. Signed on 2005-06-30. Completion date: 2005-06-24.
Top industries in this zip code by the number of employees in 2005:
Administrative and Support and Waste Management and Remediation Services: Solid Waste Collection (10-19 employees: 1 establishment)
Health Care and Social Assistance: Offices of Chiropractors (5-9: 1)
Wholesale Trade: Motor Vehicle Supplies and New Parts Merchant Wholesalers (1-4: 1)
Wholesale Trade: Home Furnishing Merchant Wholesalers (1-4: 1)
Construction: Poured Concrete Foundation and Structure Contractors (1-4: 1)
Fatal accident statistics in 2013:
Fatal accident count: 1
Vehicles involved in fatal accidents: 1
Fatal accidents caused by drunken drivers: 1
Fatalities: 1
Persons involved in fatal accidents: 2
Pedestrians involved in fatal accidents: 0
Fatal accident statistics in 2012:
Fatal accident count: 1
Vehicles involved in fatal accidents: 2
Fatal accidents caused by drunken drivers: 0
Fatalities: 1
Persons involved in fatal accidents: 4
Pedestrians involved in fatal accidents: 0
2002 - 2018 National Fire Incident Reporting System (NFIRS) incidents
Based on the data from the years 2002 - 2018 the average number of fire incidents per year is 6. The highest number of fire incidents - 18 took place in 2010, and the least - 0 in 2017. The data has a dropping trend.
When looking into fire subcategories, the most incidents belonged to: Structure Fires (62.9%), and Outside Fires (21.0%).
Fire incident types reported to NFIRS in Zip Code 62461


 Nearest zip codes: 62444, 62463, 62411, 62401, 62414, 62465.


 Based on the data from the years 2002 - 2018 the average number of fire incidents per year is 6. The highest number of fire incidents - 18 took place in 2010, and the least - 0 in 2017. The data has a dropping trend.
 When looking into fire subcategories, the most incidents belonged to: Structure Fires (62.9%), and Outside Fires (21.0%).