Estimated zip code population in 2022: 1,144 Zip code population in 2010: 1,294 Zip code population in 2000: 1,420
Houses and condos: 529 Renter-occupied apartments: 59
% of renters here:
12%
State:
33%
March 2022 cost of living index in zip code 62463: 85.0 (less than average, U.S. average is 100)
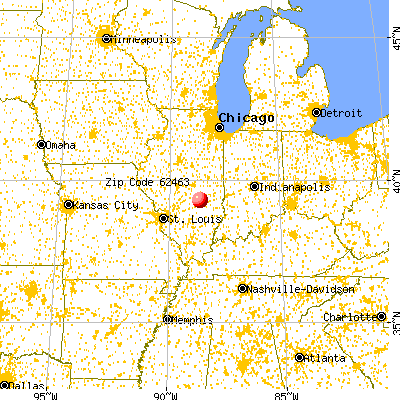
Land area: 46.6 sq. mi. Water area: 0.0 sq. mi.
Population density: 25 people per square mile
(very low).
OSM Map
General Map
Google Map
MSN Map
OSM Map
General Map
Google Map
MSN Map
OSM Map
General Map
Google Map
MSN Map
OSM Map
General Map
Google Map
MSN Map
Please wait while loading the map...
Real estate property taxes paid for housing units in 2022:
This zip code:
1.4% ($1,798)
Illinois:
2.0% ($4,912)
Median real estate property taxes paid for housing units with mortgages in 2022: $1,789 (1.4%) Median real estate property taxes paid for housing units with no mortgage in 2022: $1,825 (1.4%)
Business Search- 14 Million verified businesses
Males: 573
(50.1%)
Females: 570
(49.9%)
For population 25 years and over in 62463:
High school or higher: 92.8%
Bachelor's degree or higher: 15.7%
Graduate or professional degree: 3.1%
Unemployed: 2.5%
Mean travel time to work (commute): 24.1 minutes
For population 15 years and over in 62463:
Never married: 20.5%
Now married: 60.5%
Separated: 1.4%
Widowed: 5.1%
Divorced: 12.5%
Zip code 62463 compared to state average:
Median house value below state average.
Unemployed percentage below state average.
Black race population percentage significantly below state average.
Hispanic race population percentage significantly below state average.
Median age above state average.
Foreign-born population percentage significantly below state average.
Renting percentage significantly below state average.
Length of stay since moving in significantly above state average.
Number of college students below state average.
Percentage of population with a bachelor's degree or higher significantly below state average.
Estimated median house/condo value in 2022: $130,377
62463:
$130,377
Illinois:
$251,600
According to our research of Illinois and other state lists, there was 1 registered sex offender living in 62463 zip code as of May 28, 2024. The ratio of all residents to sex offenders in zip code 62463 is 1,361 to 1. The ratio of registered sex offenders to all residents in this zip code is lower than the state average.
Median resident age:
This zip code:
45.9 years
Illinois median age:
39.1 years
Average household size:
This zip code:
2.2 people
Illinois:
2.4 people
Averages for the 2020 tax year for zip code 62463, filed in 2021:
Average Adjusted Gross Income (AGI) in 2020: $58,362 (Individual Income Tax Returns)
Here:
$58,362
State:
$82,626
Salary/wage: $45,426 (reported on 83.9% of returns)
Here:
$45,426
State:
$66,640
(% of AGI for various income ranges: 1456.7% for AGIs below $25k, 4100.0% for AGIs $25k-50k, 5570.0% for AGIs $50k-75k, 7962.0% for AGIs $75k-100k, 15538.0% for AGIs $100k-200k)
Taxable interest for individuals: $1,614 (reported on 50.0% of returns)
This zip code:
$1,614
Illinois:
$2,376
(% of AGI for various income ranges: 43.3% for AGIs below $25k, 45.5% for AGIs $25k-50k, 61.7% for AGIs $50k-75k, 64.0% for AGIs $75k-100k, 562.0% for AGIs $100k-200k)
Ordinary dividends: $3,183 (reported on 21.4% of returns)
Here:
$3,183
State:
$9,061
(% of AGI for various income ranges: 50.0% for AGIs $25k-50k, 141.7% for AGIs $50k-75k, 484.0% for AGIs $100k-200k)
Net capital gain/loss in AGI: +$5,750 (reported on 21.4% of returns)
Here:
+$5,750
State:
+$31,684
(% of AGI for various income ranges: 41.8% for AGIs $25k-50k, 121.7% for AGIs $50k-75k, 1142.0% for AGIs $100k-200k)
Profit/loss from business: +$6,575 (reported on 14.3% of returns)
Here:
+$6,575
State:
+$12,175
(% of AGI for various income ranges: 124.2% for AGIs below $25k, 263.6% for AGIs $25k-50k, 174.0% for AGIs $75k-100k)
Taxable individual retirement arrangement distribution: $7,520 (reported on 8.9% of returns)
62463:
$7,520
Illinois:
$21,613
(% of AGI for various income ranges: 135.8% for AGIs below $25k, 426.0% for AGIs $75k-100k)
Earned income credit: $1,922 (reported on 16.1% of returns)
Here:
$1,922
State:
$2,311
(% of AGI for various income ranges: 95.8% for AGIs below $25k, 52.7% for AGIs $25k-50k)
Percentage of individuals using paid preparers for their 2020 taxes: 98.2%
Here:
98%
State:
93%
(% for various income ranges: 94.4% for AGIs below $25k, 100.0% for AGIs $25k-50k, 100.0% for AGIs $50k-75k, 100.0% for AGIs $75k-100k, 100.0% for AGIs $100k-200k)
Averages for the 2012 tax year for zip code 62463, filed in 2013:
Average Adjusted Gross Income (AGI) in 2012: $47,307 (Individual Income Tax Returns)
Here:
$47,307
State:
$68,058
Salary/wage: $35,604 (reported on 80.7% of returns)
Here:
$35,604
State:
$55,396
(% of AGI for various income ranges: 69.1% for AGIs below $25k, 77.7% for AGIs $25k-50k, 74.2% for AGIs $50k-75k, 64.0% for AGIs $75k-100k, 32.2% for AGIs $100k-200k)
Taxable interest for individuals: $1,025 (reported on 49.1% of returns)
This zip code:
$1,025
Illinois:
$1,969
(% of AGI for various income ranges: 2.4% for AGIs below $25k, 1.3% for AGIs $25k-50k, 0.6% for AGIs $50k-75k, 1.1% for AGIs $75k-100k, 0.7% for AGIs $100k-200k)
Ordinary dividends: $1,142 (reported on 21.1% of returns)
Here:
$1,142
State:
$7,786
(% of AGI for various income ranges: 0.7% for AGIs below $25k, 0.5% for AGIs $25k-50k, 0.7% for AGIs $50k-75k, 0.6% for AGIs $100k-200k)
Net capital gain/loss in AGI: +$691 (reported on 19.3% of returns)
Here:
+$691
State:
+$22,183
(% of AGI for various income ranges: 0.5% for AGIs $25k-50k, 0.3% for AGIs $50k-75k, 0.3% for AGIs $100k-200k)
Profit/loss from business: +$8,500 (reported on 15.8% of returns)
Here:
+$8,500
State:
+$12,903
(% of AGI for various income ranges: 6.6% for AGIs below $25k, 2.5% for AGIs $25k-50k, 3.2% for AGIs $50k-75k, 5.3% for AGIs $75k-100k)
Taxable individual retirement arrangement distribution: $6,533 (reported on 10.5% of returns)
62463:
$6,533
Illinois:
$17,929
Total itemized deductions: $16,155 (22% of AGI, reported on 19.3% of returns)
Here:
$16,155
State:
$26,433
Here:
21.6% of AGI
State:
19.2% of AGI
(% of AGI for various income ranges: 8.3% for AGIs $25k-50k, 13.6% for AGIs $50k-75k, 5.6% for AGIs $100k-200k)
Charity contributions: $4,671 (reported on 12.3% of returns)
Here:
$4,671
State:
$4,525
Taxes paid: $5,291 (reported on 19.3% of returns)
62463:
$5,291
State:
$11,968
(% of AGI for various income ranges: 2.0% for AGIs $25k-50k, 3.8% for AGIs $50k-75k, 2.9% for AGIs $100k-200k)
Earned income credit: $2,030 (reported on 17.5% of returns)
Here:
$2,030
State:
$2,349
(% of AGI for various income ranges: 5.2% for AGIs below $25k, 1.1% for AGIs $25k-50k)
Percentage of individuals using paid preparers for their 2012 taxes: 77.2%
Here:
77%
State:
57%
(% for various income ranges: 72.7% for AGIs below $25k, 73.3% for AGIs $25k-50k, 90.0% for AGIs $50k-75k, 80.0% for AGIs $75k-100k, 80.0% for AGIs $100k-200k)
Averages for the 2004 tax year for zip code 62463, filed in 2005:
Average Adjusted Gross Income (AGI) in 2004: $31,483 (Individual Income Tax Returns)
Here:
$31,483
State:
$54,625
Salary/wage: $28,251 (reported on 81.9% of returns)
Here:
$28,251
State:
$46,811
(% of AGI for various income ranges: 130.2% for AGIs below $10k, 70.1% for AGIs $10k-25k, 77.9% for AGIs $25k-50k, 72.9% for AGIs $50k-75k, 126.8% for AGIs $75k-100k)
Taxable interest for individuals: $1,369 (reported on 56.2% of returns)
This zip code:
$1,369
Illinois:
$2,101
(% of AGI for various income ranges: 9.9% for AGIs below $10k, 4.0% for AGIs $10k-25k, 1.9% for AGIs $25k-50k, 2.5% for AGIs $50k-75k, 1.1% for AGIs $75k-100k, 1.4% for AGIs over 100k)
Taxable dividends: $801 (reported on 25.0% of returns)
Here:
$801
State:
$4,306
(% of AGI for various income ranges: 3.7% for AGIs below $10k, 1.1% for AGIs $10k-25k, 0.4% for AGIs $25k-50k, 0.6% for AGIs $50k-75k, 0.7% for AGIs $75k-100k)
Net capital gain/loss: +$1,136 (reported on 19.6% of returns)
Here:
+$1,136
State:
+$17,321
(% of AGI for various income ranges: -0.8% for AGIs below $10k, 0.1% for AGIs $10k-25k, 2.0% for AGIs $25k-50k, -0.0% for AGIs $50k-75k, 0.1% for AGIs $75k-100k)
Profit/loss from business: +$4,936 (reported on 18.1% of returns)
Here:
+$4,936
State:
+$11,771
(% of AGI for various income ranges: 21.7% for AGIs below $10k, 5.0% for AGIs $10k-25k, 2.9% for AGIs $25k-50k, 2.1% for AGIs $50k-75k)
Profit/loss from farming: +$2,141 (reported on 11.8% of returns)
Here:
+$2,141
State:
+$2,327
IRA payment deduction: $2,950 (reported on 3.3% of returns)
62463:
$2,950
Illinois:
$3,087
Total itemized deductions: $13,093 (26% of AGI, reported on 16.1% of returns)
Here:
$13,093
State:
$20,239
Here:
25.8% of AGI
State:
19.5% of AGI
(% of AGI for various income ranges: 9.0% for AGIs $10k-25k, 4.9% for AGIs $25k-50k, 7.8% for AGIs $50k-75k, 14.5% for AGIs $75k-100k)
Charity contributions deductions: $3,261 (6% of AGI, reported on 11.4% of returns)
Here:
$3,261
State:
$3,719
Here:
6.5% of AGI
State:
3.4% of AGI
Total tax: $3,207 (reported on 79.3% of returns)
62463:
$3,207
State:
$9,882
(% of AGI for various income ranges: 7.0% for AGIs below $10k, 4.5% for AGIs $10k-25k, 6.7% for AGIs $25k-50k, 8.7% for AGIs $50k-75k, 9.0% for AGIs $75k-100k, 17.0% for AGIs over 100k)
Earned income credit: $1,494 (reported on 13.8% of returns)
Here:
$1,494
State:
$1,788
Percentage of individuals using paid preparers for their 2004 taxes: 75.1%
Here:
75%
State:
61%
(% for various income ranges: 62.9% for AGIs below $10k, 74.7% for AGIs $10k-25k, 79.5% for AGIs $25k-50k, 80.2% for AGIs $50k-75k, 85.0% for AGIs $75k-100k, 83.3% for AGIs over 100k)
Household received Food Stamps/SNAP in the past 12 months: 46 Household did not receive Food Stamps/SNAP in the past 12 months: 462
Women who had a birth in the past 12 months: 12 (8 now married, 3 unmarried) Women who did not have a birth in the past 12 months: 203 (98 now married, 104 unmarried)
Housing units in zip code 62463 with a mortgage: 185 (14 second mortgage, 14 both second mortgage and home equity loan) Houses without a mortgage: 3
Median monthly owner costs for units with a mortgage: $954 Median monthly owner costs for units without a mortgage: $513
Residents with income below the poverty level in 2022:
This zip code:
10.5%
Whole state:
11.9%
Residents with income below 50% of the poverty level in 2022:
This zip code:
3.9%
Whole state:
5.7%
Median number of rooms in houses and condos:
Here:
6.3
State:
6.4
Median number of rooms in apartments:
Here:
5.3
State:
4.1
Notable locations in this zip code not listed on our city pages
Churches in zip code 62463 include: Seventh Day Adventist Church (A), Stewardson United Methodist Church (B), Trinity Lutheran Church (C). Display/hide their locations on the map
Cemeteries: Anderson Cemetery (1), Swedish Cemetery (2), Rincker Cemetery (3), Spain Cemetery (4), Stewardson Cemetery (5), Mound Cemetery (6). Display/hide their locations on the map
Size of family households: 199 2-persons, 90 3-persons, 53 4-persons, 12 5-persons, 4 6-persons
Size of nonfamily households: 142 1-person, 6 2-persons, 4 3-persons
151 married couples with children.
85 single-parent households (33 men, 52 women).
99.3% of residents of 62463 zip code speak English at home.
0.6% of residents speak Spanish at home (100% well).
0.5% of residents speak Asian or Pacific Island language at home (100% very well).
Foreign born population: 11 (1.0%) (8.4% of them are naturalized citizens)
This zip code:
1.0%
Whole state:
14.4%
42%Honduras
33%Malaysia
44%German
23%American
11%English
4%Irish
2%Canadian
2%European
2%Scottish
Year of entry for the foreign-born population
132010 or later
02000 to 2009
01990 to 1999
3Before 1990
Facilities with environmental interests located in this zip code:
MOOMAW ELEVATOR & TRUCKING (RT. 32 S in STEWARDSON, IL)
STATE MASTER (Illinois EPA Project) - AIR PROGRAM AIR MINOR (AIRS/AFS) CRITERIA AND HAZARDOUS AIR POLLUTANT INVENTORY (Inventory of air pollution sources) National Pollutant Discharge Elimination System NON-MAJOR (Tracking pollutant discharge elimination systems) - permit Business SIC classification: GRAIN AND FIELD BEANS Organizations: MOOMAW'S (CONTACT/OWNER)
Alternative names: MOOMAW'S
JONES TRUCKING SERVICE (326 N. SPRUCE in STEWARDSON, IL)
STATE MASTER (Illinois EPA Project) - SOLID WASTE PROGRAM National Pollutant Discharge Elimination System NON-MAJOR (Tracking pollutant discharge elimination systems) - permit
IOLA QUARRY INC-BRUSH CREEK (RR 1 BOX 202 in NEAR STEWARDSON, IL)
STATE MASTER (Illinois EPA Project) - National Pollutant Discharge Elimination System Permit National Pollutant Discharge Elimination System NON-MAJOR (Tracking pollutant discharge elimination systems) - permit Business SIC classification: CRUSHED AND BROKEN LIMESTONE Alternative names: IOLA QUARRY, INC.
LAKELAND FS INC (RURAL ROUTE in STEWARDSON, IL)
STATE MASTER (Illinois EPA Project) - AIR PROGRAM AIR MINOR (AIRS/AFS) Business SIC classification: BOOKS, PERIODICALS, AND NEWSPAPERS
CUSTOM CUPBOARDS INC (302 EAST NORTH 2ND STREET in STEWARDSON, IL)
STATE MASTER (Illinois EPA Project) - AIR PROGRAM AIR MINOR (AIRS/AFS) Business SIC classification: NONCLASSIFIABLE ESTABLISHMENTS
MOULTRIE SHELBY FS INC (ST RTE 32 SOUTH in STEWARDSON, IL)
(Resource Conservation and Recovery Act (tracking hazardous waste))
IOLA QUARRY INC (HOLLAND TWP. in STEWARDSON, IL)
AIR MINOR (AIRS/AFS) CRITERIA AND HAZARDOUS AIR POLLUTANT INVENTORY (Inventory of air pollution sources) Business SIC classification: CRUSHED AND BROKEN LIMESTONE Alternative names: IOLA QUARRY, INC.-BRUSH CREEK QUARRY
LATCH CUSTOM (RR 1 BOX 71 in STEWARDSON, IL)
COMPLIANCE ACTIVITY (Tracking inspections of insecticide, fungicide, and rodenticide, and toxic substances)
PLANTERS FARM CENTER (218 N VINE ST in STEWARDSON, IL)
COMPLIANCE ACTIVITY (Tracking inspections of insecticide, fungicide, and rodenticide, and toxic substances)
Housing units lacking complete plumbing facilities: 0.8% Housing units lacking complete kitchen facilities: 3.0%
48.7%Utility gas
24.6%Bottled, tank, or LP gas
24.2%Electricity
2.6%Wood
Population in 1990: 1,219. Population change in the 1990s: +201 (+16.5%).
Place of birth for U.S.-born residents:
This state: 1,046
Midwest: 45
South: 21
West: 9
76% of the 62463 zip code residents lived in the same house 5 years ago. Out of people who lived in different houses, 53% lived in this county. Out of people who lived in different counties, 50% lived in Illinois.
95% of the 62463 zip code residents lived in the same house 1 year ago. Out of people who lived in different houses, 16% moved from this county. Out of people who lived in different houses, 72% moved from different county within same state. Out of people who lived in different houses, 14% moved from different state.
Private vs. public school enrollment:
Students in private schools in grades 1 to 8 (elementary and middle school): 65
Here:
53.8%
Illinois:
13.3%
Students in private schools in grades 9 to 12 (high school):
Here:
0.0%
Illinois:
9.9%
Students in private undergraduate colleges: 13
Here:
57.3%
Illinois:
27.4%
Occupation by median earnings in the past 12 months ($)
111,460Health diagnosing and treating practitioners and other technical occupations
57,854Transportation occupations
55,772Law enforcement workers including supervisors
51,240Installation, maintenance, and repair occupations
50,851Sales and related occupations
45,476Management occupations
Top industries in this zip code by the number of employees in 2005:


 Nearest zip codes: 62465, 62461, 62444, 62462, 62447, 62401.


