Estimated zip code population in 2022: 1,492 Zip code population in 2010: 1,529 Zip code population in 2000: 1,451
Houses and condos: 643 Renter-occupied apartments: 83
% of renters here:
13%
State:
33%
March 2022 cost of living index in zip code 62520: 85.1 (less than average, U.S. average is 100)
Land area: 21.8 sq. mi. Water area: 0.0 sq. mi.
Population density: 68 people per square mile
(very low).
OSM Map
General Map
Google Map
MSN Map
OSM Map
General Map
Google Map
MSN Map
OSM Map
General Map
Google Map
MSN Map
OSM Map
General Map
Google Map
MSN Map
Please wait while loading the map...
Real estate property taxes paid for housing units in 2022:
This zip code:
1.7% ($3,448)
Illinois:
2.0% ($4,912)
Median real estate property taxes paid for housing units with mortgages in 2022: $3,900 (1.8%) Median real estate property taxes paid for housing units with no mortgage in 2022: $2,982 (1.6%)
Business Search- 14 Million verified businesses
Males: 674
(45.2%)
Females: 817
(54.8%)
For population 25 years and over in 62520:
High school or higher: 95.3%
Bachelor's degree or higher: 14.4%
Graduate or professional degree: 5.3%
Unemployed: 2.1%
Mean travel time to work (commute): 22.9 minutes
For population 15 years and over in 62520:
Never married: 25.7%
Now married: 58.0%
Separated: 0.8%
Widowed: 6.3%
Divorced: 9.2%
Zip code 62520 compared to state average:
Unemployed percentage below state average.
Black race population percentage significantly below state average.
Hispanic race population percentage significantly below state average.
Median age significantly above state average.
Foreign-born population percentage significantly below state average.
Renting percentage significantly below state average.
Number of college students below state average.
Percentage of population with a bachelor's degree or higher significantly below state average.
Averages for the 2020 tax year for zip code 62520, filed in 2021:
Average Adjusted Gross Income (AGI) in 2020: $66,531 (Individual Income Tax Returns)
Here:
$66,531
State:
$82,626
Salary/wage: $54,154 (reported on 78.2% of returns)
Here:
$54,154
State:
$66,640
(% of AGI for various income ranges: 1109.3% for AGIs below $25k, 3148.0% for AGIs $25k-50k, 5341.8% for AGIs $50k-75k, 7085.7% for AGIs $75k-100k, 17568.9% for AGIs $100k-200k)
Taxable interest for individuals: $612 (reported on 41.0% of returns)
This zip code:
$612
Illinois:
$2,376
(% of AGI for various income ranges: 12.0% for AGIs below $25k, 24.7% for AGIs $25k-50k, 38.2% for AGIs $50k-75k, 55.7% for AGIs $75k-100k, 66.7% for AGIs $100k-200k)
Ordinary dividends: $2,660 (reported on 19.2% of returns)
Here:
$2,660
State:
$9,061
(% of AGI for various income ranges: 24.7% for AGIs $25k-50k, 48.2% for AGIs $50k-75k, 97.1% for AGIs $75k-100k, 267.8% for AGIs $100k-200k)
Net capital gain/loss in AGI: +$9,000 (reported on 14.1% of returns)
Here:
+$9,000
State:
+$31,684
(% of AGI for various income ranges: 16.0% for AGIs $25k-50k, 227.1% for AGIs $75k-100k, 896.7% for AGIs $100k-200k)
Profit/loss from business: +$8,312 (reported on 10.3% of returns)
Here:
+$8,312
State:
+$12,175
(% of AGI for various income ranges: 62.0% for AGIs below $25k, 278.7% for AGIs $25k-50k, 220.0% for AGIs $75k-100k)
Taxable individual retirement arrangement distribution: $13,325 (reported on 10.3% of returns)
62520:
$13,325
Illinois:
$21,613
(% of AGI for various income ranges: 80.7% for AGIs below $25k, 356.4% for AGIs $50k-75k, 614.4% for AGIs $100k-200k)
Total itemized deductions: $21,233 (reported on 3.8% of returns)
Here:
$21,233
State:
$34,948
(% of AGI for various income ranges: 579.1% for AGIs $50k-75k)
Taxes paid: $6,800 (reported on 3.8% of returns)
62520:
$6,800
State:
$8,563
(% of AGI for various income ranges: 185.5% for AGIs $50k-75k)
Earned income credit: $2,073 (reported on 14.1% of returns)
Here:
$2,073
State:
$2,311
(% of AGI for various income ranges: 76.0% for AGIs below $25k, 76.0% for AGIs $25k-50k)
Percentage of individuals using paid preparers for their 2020 taxes: 92.3%
Here:
92%
State:
93%
(% for various income ranges: 90.0% for AGIs below $25k, 94.4% for AGIs $25k-50k, 92.9% for AGIs $50k-75k, 90.0% for AGIs $75k-100k, 107.1% for AGIs $100k-200k, 0.0% for AGIs over 200k)
Averages for the 2012 tax year for zip code 62520, filed in 2013:
Average Adjusted Gross Income (AGI) in 2012: $55,694 (Individual Income Tax Returns)
Here:
$55,694
State:
$68,058
Salary/wage: $48,380 (reported on 84.4% of returns)
Here:
$48,380
State:
$55,396
(% of AGI for various income ranges: 72.3% for AGIs below $25k, 76.4% for AGIs $25k-50k, 77.9% for AGIs $50k-75k, 69.4% for AGIs $75k-100k, 72.1% for AGIs $100k-200k)
Taxable interest for individuals: $642 (reported on 40.3% of returns)
This zip code:
$642
Illinois:
$1,969
(% of AGI for various income ranges: 0.6% for AGIs below $25k, 0.5% for AGIs $25k-50k, 0.3% for AGIs $50k-75k, 0.4% for AGIs $75k-100k, 0.5% for AGIs $100k-200k)
Ordinary dividends: $1,653 (reported on 19.5% of returns)
Here:
$1,653
State:
$7,786
(% of AGI for various income ranges: 1.6% for AGIs below $25k, 0.6% for AGIs $50k-75k, 0.4% for AGIs $75k-100k, 0.7% for AGIs $100k-200k)
Profit/loss from business: +$6,755 (reported on 14.3% of returns)
Here:
+$6,755
State:
+$12,903
(% of AGI for various income ranges: 6.0% for AGIs below $25k, 4.9% for AGIs $50k-75k, 0.9% for AGIs $100k-200k)
Taxable individual retirement arrangement distribution: $9,833 (reported on 7.8% of returns)
62520:
$9,833
Illinois:
$17,929
Total itemized deductions: $18,957 (19% of AGI, reported on 27.3% of returns)
Here:
$18,957
State:
$26,433
Here:
19.1% of AGI
State:
19.2% of AGI
(% of AGI for various income ranges: 9.7% for AGIs $25k-50k, 7.2% for AGIs $50k-75k, 9.1% for AGIs $75k-100k, 12.0% for AGIs $100k-200k)
Charity contributions: $2,033 (reported on 19.5% of returns)
Here:
$2,033
State:
$4,525
(% of AGI for various income ranges: 1.2% for AGIs below $25k, 0.5% for AGIs $50k-75k, 0.8% for AGIs $75k-100k, 1.0% for AGIs $100k-200k)
Taxes paid: $7,895 (reported on 27.3% of returns)
62520:
$7,895
State:
$11,968
(% of AGI for various income ranges: 2.4% for AGIs $25k-50k, 3.4% for AGIs $50k-75k, 3.3% for AGIs $75k-100k, 5.6% for AGIs $100k-200k)
Earned income credit: $2,120 (reported on 13.0% of returns)
Here:
$2,120
State:
$2,349
(% of AGI for various income ranges: 5.0% for AGIs below $25k, 0.9% for AGIs $25k-50k)
Percentage of individuals using paid preparers for their 2012 taxes: 53.2%
Here:
53%
State:
57%
(% for various income ranges: 41.7% for AGIs below $25k, 50.0% for AGIs $25k-50k, 57.1% for AGIs $50k-75k, 70.0% for AGIs $75k-100k, 63.6% for AGIs $100k-200k)
Averages for the 2004 tax year for zip code 62520, filed in 2005:
Average Adjusted Gross Income (AGI) in 2004: $47,819 (Individual Income Tax Returns)
Here:
$47,819
State:
$54,625
Salary/wage: $41,481 (reported on 87.7% of returns)
Here:
$41,481
State:
$46,811
(% of AGI for various income ranges: 108.8% for AGIs below $10k, 76.4% for AGIs $10k-25k, 77.3% for AGIs $25k-50k, 81.5% for AGIs $50k-75k, 81.7% for AGIs $75k-100k, 63.3% for AGIs over 100k)
Taxable interest for individuals: $1,120 (reported on 52.9% of returns)
This zip code:
$1,120
Illinois:
$2,101
(% of AGI for various income ranges: 3.5% for AGIs below $10k, 2.1% for AGIs $10k-25k, 0.8% for AGIs $25k-50k, 1.4% for AGIs $50k-75k, 0.7% for AGIs $75k-100k, 1.6% for AGIs over 100k)
Taxable dividends: $856 (reported on 24.5% of returns)
Here:
$856
State:
$4,306
(% of AGI for various income ranges: 0.9% for AGIs $10k-25k, 0.2% for AGIs $25k-50k, 0.4% for AGIs $50k-75k, 0.2% for AGIs $75k-100k, 0.7% for AGIs over 100k)
Net capital gain/loss: +$3,506 (reported on 12.0% of returns)
Here:
+$3,506
State:
+$17,321
(% of AGI for various income ranges: 1.8% for AGIs below $10k, -0.2% for AGIs $25k-50k, -0.1% for AGIs $50k-75k, 0.1% for AGIs $75k-100k, 3.5% for AGIs over 100k)
Profit/loss from business: +$4,438 (reported on 15.2% of returns)
Here:
+$4,438
State:
+$11,771
(% of AGI for various income ranges: -0.5% for AGIs $10k-25k, 2.9% for AGIs $25k-50k, 3.2% for AGIs $50k-75k, 0.7% for AGIs $75k-100k, -0.2% for AGIs over 100k)
IRA payment deduction: $3,300 (reported on 2.7% of returns)
62520:
$3,300
Illinois:
$3,087
Total itemized deductions: $14,380 (20% of AGI, reported on 31.7% of returns)
Here:
$14,380
State:
$20,239
Here:
19.5% of AGI
State:
19.5% of AGI
(% of AGI for various income ranges: 10.2% for AGIs $10k-25k, 11.9% for AGIs $25k-50k, 7.7% for AGIs $50k-75k, 10.8% for AGIs $75k-100k, 8.9% for AGIs over 100k)
Charity contributions deductions: $2,091 (3% of AGI, reported on 25.2% of returns)
Here:
$2,091
State:
$3,719
Here:
2.6% of AGI
State:
3.4% of AGI
(% of AGI for various income ranges: 0.9% for AGIs $25k-50k, 0.8% for AGIs $50k-75k, 1.4% for AGIs $75k-100k, 1.7% for AGIs over 100k)
Total tax: $6,420 (reported on 83.2% of returns)
62520:
$6,420
State:
$9,882
(% of AGI for various income ranges: 3.1% for AGIs below $10k, 3.9% for AGIs $10k-25k, 7.1% for AGIs $25k-50k, 9.8% for AGIs $50k-75k, 10.7% for AGIs $75k-100k, 18.2% for AGIs over 100k)
Earned income credit: $1,538 (reported on 8.8% of returns)
Here:
$1,538
State:
$1,788
Percentage of individuals using paid preparers for their 2004 taxes: 52.6%
Here:
53%
State:
61%
(% for various income ranges: 37.9% for AGIs below $10k, 48.3% for AGIs $10k-25k, 50.9% for AGIs $25k-50k, 58.9% for AGIs $50k-75k, 56.0% for AGIs $75k-100k, 77.4% for AGIs over 100k)
Likely homosexual households (counted as self-reported same-sex unmarried-partner households)
Lesbian couples: 2.2% of all households
Gay men: 0.0% of all households
Household received Food Stamps/SNAP in the past 12 months: 28 Household did not receive Food Stamps/SNAP in the past 12 months: 581
Women who had a birth in the past 12 months: 6 (6 now married, 0 unmarried) Women who did not have a birth in the past 12 months: 238 (105 now married, 132 unmarried)
Housing units in zip code 62520 with a mortgage: 289 (22 second mortgage, 22 both second mortgage and home equity loan) Houses without a mortgage: 12
Median monthly owner costs for units with a mortgage: $1,367 Median monthly owner costs for units without a mortgage: $706
Residents with income below the poverty level in 2022:
This zip code:
8.5%
Whole state:
11.9%
Residents with income below 50% of the poverty level in 2022:
This zip code:
2.7%
Whole state:
5.7%
Median number of rooms in houses and condos:
Here:
6.5
State:
6.4
Median number of rooms in apartments:
Here:
5.2
State:
4.1
Notable locations in this zip code not listed on our city pages
Size of family households: 227 2-persons, 128 3-persons, 54 4-persons, 21 5-persons, 3 6-persons, 12 7-or-more-persons
Size of nonfamily households: 163 1-person, 5 2-persons
161 married couples with children.
115 single-parent households (67 men, 48 women).
98.1% of residents of 62520 zip code speak English at home.
0.9% of residents speak other Indo-European language at home (100% very well).
0.6% of residents speak other language at home (100% very well).
Foreign born population: 9 (0.7%) (0.0% of them are naturalized citizens)
:
0.7%
Whole state:
14.4%
110%Azores Islands
24%American
12%English
10%Irish
9%German
8%European
2%Slovak
2%Basque
Year of entry for the foreign-born population
122010 or later
02000 to 2009
01990 to 1999
0Before 1990
Facilities with environmental interests located in this zip code:
MECHANICSBURG FARMERS GRAIN CO (MAIN ST in DAWSON, IL)
STATE MASTER (Illinois EPA Project) - AIR PROGRAM AIR MINOR (AIRS/AFS) CRITERIA AND HAZARDOUS AIR POLLUTANT INVENTORY (Inventory of air pollution sources) Business SIC classification: GRAIN AND FIELD BEANS
DAWSON WTP (8775 OLD MECHANICSBURG ROAD in DAWSON, IL)
STATE MASTER (Illinois EPA Project) - National Pollutant Discharge Elimination System Permit National Pollutant Discharge Elimination System NON-MAJOR (Tracking pollutant discharge elimination systems) - permit Business SIC classification: WATER SUPPLY Alternative names: DAWSON WTP, VILLAGE OF
CHAR-LYNN TRUCKING, INC. (100 ROUTE 36 in DAWSON, IL)
National Pollutant Discharge Elimination System NON-MAJOR (Tracking pollutant discharge elimination systems) - permit
IL BRG 084-0155 (CH 16 OVR FAI 72 in DAWSON, IL)
Small Quantity Generators, between 100 kg and 1000 kg of hazardous waste/month (Resource Conservation and Recovery Act (tracking hazardous waste)) - notification Organizations: IDOT (CONTACT/OWNER)
IL BRG 084-156 (FAI 72 & CH 19 in DAWSON, IL)
Small Quantity Generators, between 100 kg and 1000 kg of hazardous waste/month (Resource Conservation and Recovery Act (tracking hazardous waste)) - notification Organizations: IDOT (CONTACT/OWNER)
Housing units lacking complete plumbing facilities: 0.8% Housing units lacking complete kitchen facilities: 0.8%
66.1%Utility gas
23.4%Bottled, tank, or LP gas
10.6%Electricity
Population in 1990: 558. Population change in the 1990s: +893 (+160.0%).
Place of birth for U.S.-born residents:
This state: 1,280
Northeast: 11
Midwest: 83
South: 60
West: 39
67% of the 62520 zip code residents lived in the same house 5 years ago. Out of people who lived in different houses, 68% lived in this county. Out of people who lived in different counties, 50% lived in Illinois.
97% of the 62520 zip code residents lived in the same house 1 year ago. Out of people who lived in different houses, 52% moved from this county. Out of people who lived in different houses, 45% moved from different county within same state.
Private vs. public school enrollment:
Students in private schools in grades 1 to 8 (elementary and middle school): 14
Here:
9.1%
Illinois:
13.3%
Students in private schools in grades 9 to 12 (high school): 1
Here:
6.8%
Illinois:
9.9%
Students in private undergraduate colleges: 11
Here:
41.9%
Illinois:
27.4%
Occupation by median earnings in the past 12 months ($)
83,457Production occupations
78,148Management occupations
75,880Community and social service occupations
63,705Health diagnosing and treating practitioners and other technical occupations
56,320Business and financial operations occupations
54,188Office and administrative support occupations
Companies with federal contracts located in this zip code:
AGMED INC (549 BROOKVIEW ROAD in DAWSON, IL; small business)
$13,960 with Air Force for Medical and Surgical Instruments, Equipment, and Supplies. Signed on 2005-05-31. Completion date: 2005-07-18.
Top industries in this zip code by the number of employees in 2005:
Construction: Poured Concrete Foundation and Structure Contractors (20-49 employees: 1 establishment)
Professional, Scientific, and Technical Services: Human Resources and Executive Search Consulting Services (10-19: 1)
Construction: Commercial and Institutional Building Construction (10-19: 1)
Other Services (except Public Administration): Religious Organizations (5-9: 1)
Accommodation and Food Services: Full-Service Restaurants (1-4: 2)
Wholesale Trade: Grain and Field Bean Merchant Wholesalers (1-4: 1)
Construction: Masonry Contractors (1-4: 1)
Construction: Residential Remodelers (1-4: 1)
Construction: New Housing Operative Builders (1-4: 1)
Fatal accident statistics in 2012:
Fatal accident count: 1
Vehicles involved in fatal accidents: 2
Fatal accidents caused by drunken drivers: 1
Fatalities: 1
Persons involved in fatal accidents: 2
Pedestrians involved in fatal accidents: 0
Fatal accident statistics in 2010:
Fatal accident count: 1
Vehicles involved in fatal accidents: 1
Fatal accidents caused by drunken drivers: 0
Fatalities: 1
Persons involved in fatal accidents: 1
Pedestrians involved in fatal accidents: 0
Home Mortgage Disclosure Act Aggregated Statistics For Year 2009 (Based on 4 partial tracts)
A) FHA, FSA/RHS & VA Home Purchase Loans
B) Conventional Home Purchase Loans
C) Refinancings
D) Home Improvement Loans
F) Non-occupant Loans on < 5 Family Dwellings (A B C & D)
G) Loans On Manufactured Home Dwelling (A B C & D)
Number
Average Value
Number
Average Value
Number
Average Value
Number
Average Value
Number
Average Value
Number
Average Value
LOANS ORIGINATED
14
$113,205
17
$109,511
125
$107,763
16
$42,713
7
$77,876
2
$60,375
APPLICATIONS APPROVED, NOT ACCEPTED
1
$67,680
1
$76,260
13
$110,692
0
$0
0
$0
1
$47,480
APPLICATIONS DENIED
2
$92,020
2
$129,530
18
$121,753
4
$47,468
1
$28,770
1
$32,300
APPLICATIONS WITHDRAWN
3
$78,673
1
$27,070
16
$109,295
2
$71,940
0
$0
0
$0
FILES CLOSED FOR INCOMPLETENESS
0
$0
0
$0
2
$76,420
0
$0
0
$0
0
$0
Aggregated Statistics For Year 2008 (Based on 4 partial tracts)
A) FHA, FSA/RHS & VA Home Purchase Loans
B) Conventional Home Purchase Loans
C) Refinancings
D) Home Improvement Loans
E) Loans on Dwellings For 5+ Families
F) Non-occupant Loans on < 5 Family Dwellings (A B C & D)
G) Loans On Manufactured Home Dwelling (A B C & D)
Number
Average Value
Number
Average Value
Number
Average Value
Number
Average Value
Number
Average Value
Number
Average Value
Number
Average Value
LOANS ORIGINATED
9
$121,918
20
$107,310
54
$103,064
11
$37,938
1
$60,020
9
$70,116
1
$41,910
APPLICATIONS APPROVED, NOT ACCEPTED
0
$0
2
$80,725
8
$113,358
1
$69,090
0
$0
0
$0
1
$30,420
APPLICATIONS DENIED
0
$0
3
$105,723
25
$109,320
6
$57,742
0
$0
1
$47,810
1
$30,730
APPLICATIONS WITHDRAWN
1
$86,760
1
$42,340
14
$108,501
2
$29,855
0
$0
0
$0
0
$0
FILES CLOSED FOR INCOMPLETENESS
0
$0
0
$0
3
$119,737
1
$44,770
0
$0
0
$0
0
$0
Aggregated Statistics For Year 2007 (Based on 4 partial tracts)
A) FHA, FSA/RHS & VA Home Purchase Loans
B) Conventional Home Purchase Loans
C) Refinancings
D) Home Improvement Loans
F) Non-occupant Loans on < 5 Family Dwellings (A B C & D)
G) Loans On Manufactured Home Dwelling (A B C & D)
Number
Average Value
Number
Average Value
Number
Average Value
Number
Average Value
Number
Average Value
Number
Average Value
LOANS ORIGINATED
4
$111,882
38
$99,927
52
$95,344
17
$29,324
10
$59,446
3
$35,250
APPLICATIONS APPROVED, NOT ACCEPTED
0
$0
4
$117,935
6
$85,232
1
$48,190
0
$0
1
$26,750
APPLICATIONS DENIED
1
$80,190
5
$74,598
22
$91,172
8
$50,771
0
$0
3
$74,750
APPLICATIONS WITHDRAWN
0
$0
4
$100,032
9
$85,810
3
$44,027
1
$19,630
1
$35,310
FILES CLOSED FOR INCOMPLETENESS
0
$0
0
$0
2
$95,375
0
$0
0
$0
0
$0
Aggregated Statistics For Year 2006 (Based on 4 partial tracts)
A) FHA, FSA/RHS & VA Home Purchase Loans
B) Conventional Home Purchase Loans
C) Refinancings
D) Home Improvement Loans
E) Loans on Dwellings For 5+ Families
F) Non-occupant Loans on < 5 Family Dwellings (A B C & D)
G) Loans On Manufactured Home Dwelling (A B C & D)
Number
Average Value
Number
Average Value
Number
Average Value
Number
Average Value
Number
Average Value
Number
Average Value
Number
Average Value
LOANS ORIGINATED
3
$105,233
43
$88,404
44
$90,402
12
$29,363
1
$247,670
9
$64,972
3
$47,717
APPLICATIONS APPROVED, NOT ACCEPTED
1
$69,770
2
$128,085
5
$64,958
2
$28,090
0
$0
1
$31,990
1
$47,980
APPLICATIONS DENIED
1
$99,770
5
$64,514
27
$96,204
5
$56,206
0
$0
1
$33,420
3
$70,877
APPLICATIONS WITHDRAWN
0
$0
4
$127,378
18
$114,128
1
$58,920
0
$0
0
$0
0
$0
FILES CLOSED FOR INCOMPLETENESS
0
$0
1
$79,400
4
$98,265
0
$0
0
$0
0
$0
0
$0
Aggregated Statistics For Year 2005 (Based on 4 partial tracts)
A) FHA, FSA/RHS & VA Home Purchase Loans
B) Conventional Home Purchase Loans
C) Refinancings
D) Home Improvement Loans
F) Non-occupant Loans on < 5 Family Dwellings (A B C & D)
G) Loans On Manufactured Home Dwelling (A B C & D)
Number
Average Value
Number
Average Value
Number
Average Value
Number
Average Value
Number
Average Value
Number
Average Value
LOANS ORIGINATED
3
$115,910
42
$82,817
55
$92,442
11
$26,340
11
$89,710
2
$34,445
APPLICATIONS APPROVED, NOT ACCEPTED
0
$0
5
$91,294
6
$118,682
1
$14,750
1
$54,250
0
$0
APPLICATIONS DENIED
1
$76,480
7
$61,783
26
$109,985
5
$23,792
2
$55,790
2
$29,555
APPLICATIONS WITHDRAWN
0
$0
5
$102,180
20
$104,329
1
$163,230
0
$0
0
$0
FILES CLOSED FOR INCOMPLETENESS
0
$0
1
$113,940
4
$105,852
0
$0
0
$0
0
$0
Aggregated Statistics For Year 2004 (Based on 4 partial tracts)
A) FHA, FSA/RHS & VA Home Purchase Loans
B) Conventional Home Purchase Loans
C) Refinancings
D) Home Improvement Loans
E) Loans on Dwellings For 5+ Families
F) Non-occupant Loans on < 5 Family Dwellings (A B C & D)
G) Loans On Manufactured Home Dwelling (A B C & D)
Number
Average Value
Number
Average Value
Number
Average Value
Number
Average Value
Number
Average Value
Number
Average Value
Number
Average Value
LOANS ORIGINATED
4
$112,525
33
$91,643
74
$91,205
9
$26,506
1
$151,470
6
$67,532
2
$44,165
APPLICATIONS APPROVED, NOT ACCEPTED
0
$0
4
$83,650
9
$120,887
1
$23,760
0
$0
1
$75,260
0
$0
APPLICATIONS DENIED
1
$64,090
6
$63,653
23
$95,484
8
$32,756
0
$0
1
$55,080
2
$43,670
APPLICATIONS WITHDRAWN
0
$0
4
$81,825
19
$97,713
1
$23,290
0
$0
1
$41,570
1
$49,930
FILES CLOSED FOR INCOMPLETENESS
0
$0
0
$0
2
$76,655
1
$11,380
0
$0
0
$0
0
$0
Aggregated Statistics For Year 2003 (Based on 4 partial tracts)
A) FHA, FSA/RHS & VA Home Purchase Loans
B) Conventional Home Purchase Loans
C) Refinancings
D) Home Improvement Loans
F) Non-occupant Loans on < 5 Family Dwellings (A B C & D)
Number
Average Value
Number
Average Value
Number
Average Value
Number
Average Value
Number
Average Value
LOANS ORIGINATED
7
$93,874
36
$86,051
198
$86,268
10
$19,922
10
$59,418
APPLICATIONS APPROVED, NOT ACCEPTED
1
$45,350
2
$94,460
14
$82,570
0
$0
0
$0
APPLICATIONS DENIED
1
$76,200
9
$64,788
30
$77,795
5
$17,624
2
$34,905
APPLICATIONS WITHDRAWN
0
$0
4
$102,575
19
$108,071
1
$22,890
0
$0
FILES CLOSED FOR INCOMPLETENESS
0
$0
0
$0
2
$85,530
0
$0
0
$0
Aggregated Statistics For Year 2002 (Based on 2 partial tracts)
A) FHA, FSA/RHS & VA Home Purchase Loans
B) Conventional Home Purchase Loans
C) Refinancings
D) Home Improvement Loans
F) Non-occupant Loans on < 5 Family Dwellings (A B C & D)
Number
Average Value
Number
Average Value
Number
Average Value
Number
Average Value
Number
Average Value
LOANS ORIGINATED
3
$58,713
7
$78,589
37
$78,853
4
$21,045
1
$61,780
APPLICATIONS APPROVED, NOT ACCEPTED
0
$0
1
$147,380
4
$64,138
1
$13,680
0
$0
APPLICATIONS DENIED
0
$0
2
$60,600
9
$90,233
1
$11,550
0
$0
APPLICATIONS WITHDRAWN
0
$0
1
$171,190
3
$77,343
0
$0
0
$0
FILES CLOSED FOR INCOMPLETENESS
0
$0
0
$0
1
$118,140
0
$0
0
$0
Aggregated Statistics For Year 2001 (Based on 2 partial tracts)
A) FHA, FSA/RHS & VA Home Purchase Loans
B) Conventional Home Purchase Loans
C) Refinancings
D) Home Improvement Loans
F) Non-occupant Loans on < 5 Family Dwellings (A B C & D)
Number
Average Value
Number
Average Value
Number
Average Value
Number
Average Value
Number
Average Value
LOANS ORIGINATED
1
$81,820
9
$74,277
34
$79,055
6
$24,052
1
$41,260
APPLICATIONS APPROVED, NOT ACCEPTED
0
$0
0
$0
4
$66,672
1
$19,570
0
$0
APPLICATIONS DENIED
0
$0
4
$52,878
12
$74,395
3
$12,340
1
$10,380
APPLICATIONS WITHDRAWN
0
$0
1
$49,050
6
$67,557
0
$0
0
$0
FILES CLOSED FOR INCOMPLETENESS
0
$0
0
$0
1
$44,090
0
$0
0
$0
Aggregated Statistics For Year 2000 (Based on 2 partial tracts)
A) FHA, FSA/RHS & VA Home Purchase Loans
B) Conventional Home Purchase Loans
C) Refinancings
D) Home Improvement Loans
F) Non-occupant Loans on < 5 Family Dwellings (A B C & D)
Number
Average Value
Number
Average Value
Number
Average Value
Number
Average Value
Number
Average Value
LOANS ORIGINATED
1
$76,160
9
$82,766
9
$69,063
5
$14,148
1
$80,170
APPLICATIONS APPROVED, NOT ACCEPTED
0
$0
1
$58,240
2
$81,115
1
$27,120
0
$0
APPLICATIONS DENIED
0
$0
5
$72,154
4
$48,398
1
$6,130
0
$0
APPLICATIONS WITHDRAWN
0
$0
0
$0
2
$57,535
0
$0
0
$0
FILES CLOSED FOR INCOMPLETENESS
0
$0
0
$0
1
$67,670
0
$0
0
$0
Aggregated Statistics For Year 1999 (Based on 2 partial tracts)
A) FHA, FSA/RHS & VA Home Purchase Loans
B) Conventional Home Purchase Loans
C) Refinancings
D) Home Improvement Loans
F) Non-occupant Loans on < 5 Family Dwellings (A B C & D)
Detailed PMIC statistics for the following Tracts:0038.02
, 0040.00
2002 - 2018 National Fire Incident Reporting System (NFIRS) incidents
According to the data from the years 2002 - 2018 the average number of fire incidents per year is 18. The highest number of fire incidents - 35 took place in 2006, and the least - 2 in 2016. The data has a dropping trend.
When looking into fire subcategories, the most reports belonged to: Outside Fires (57.8%), and Structure Fires (26.0%).
Fire incident types reported to NFIRS in Zip Code 62520

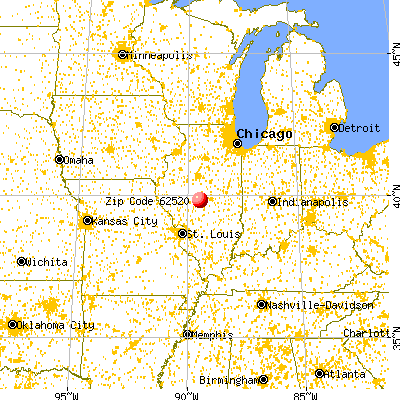


 Nearest zip codes: 62561, 62515, 62545, 62563, 62519, 62712.


 According to the data from the years 2002 - 2018 the average number of fire incidents per year is 18. The highest number of fire incidents - 35 took place in 2006, and the least - 2 in 2016. The data has a dropping trend.
 When looking into fire subcategories, the most reports belonged to: Outside Fires (57.8%), and Structure Fires (26.0%).