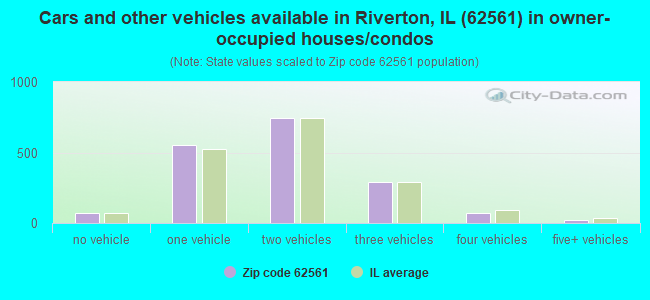
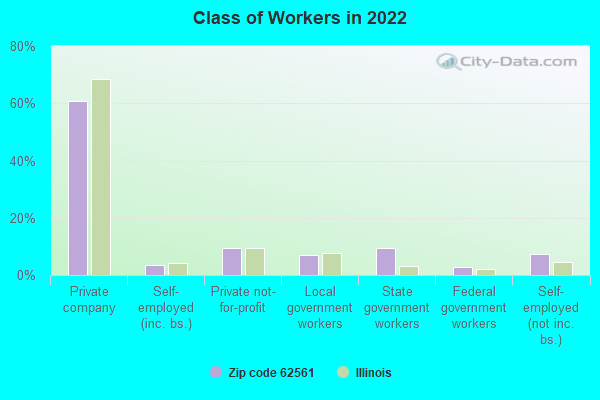
Estimated zip code population in 2022: 5,036 Zip code population in 2010: 5,315 Zip code population in 2000: 4,750
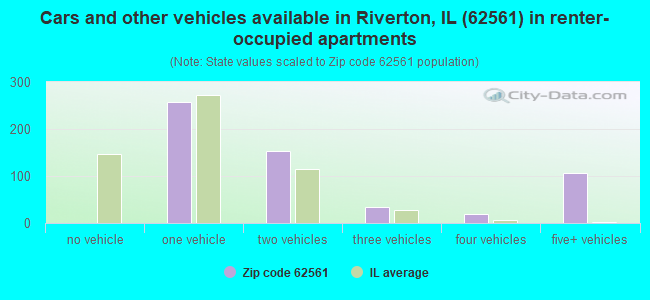
Houses and condos: 2,473 Renter-occupied apartments: 597
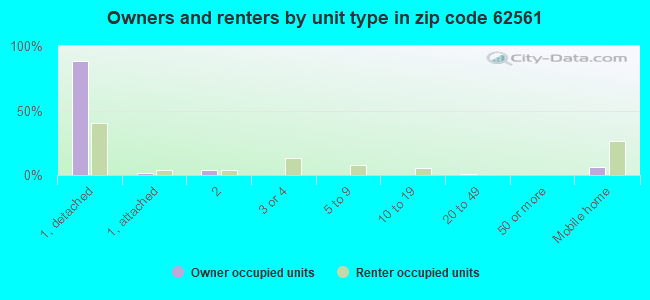
% of renters here:
25%
State:
33%
March 2022 cost of living index in zip code 62561: 84.6 (less than average, U.S. average is 100)
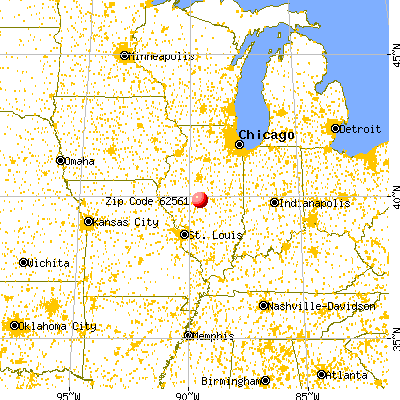
Land area: 26.6 sq. mi. Water area: 0.3 sq. mi.
Population density: 190 people per square mile
(very low).
OSM Map
General Map
Google Map
MSN Map
OSM Map
General Map
Google Map
MSN Map
OSM Map
General Map
Google Map
MSN Map
OSM Map
General Map
Google Map
MSN Map
Please wait while loading the map...
Real estate property taxes paid for housing units in 2022:
This zip code:
1.8% ($2,775)
Illinois:
2.0% ($4,912)
Median real estate property taxes paid for housing units with mortgages in 2022: $3,936 (2.1%) Median real estate property taxes paid for housing units with no mortgage in 2022: $2,239 (1.7%)
Business Search- 14 Million verified businesses
Males: 2,482
(49.3%)
Females: 2,554
(50.7%)
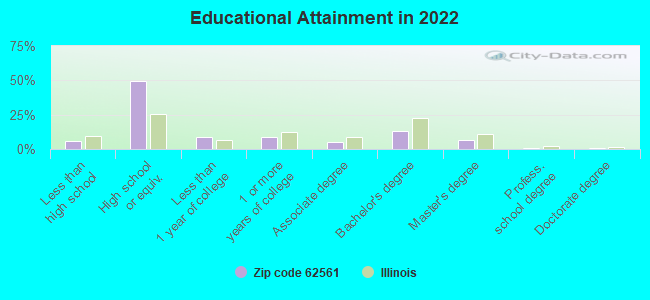
For population 25 years and over in 62561:
High school or higher: 93.2%
Bachelor's degree or higher: 20.9%
Graduate or professional degree: 7.9%
Unemployed: 2.2%
Mean travel time to work (commute): 22.0 minutes
For population 15 years and over in 62561:
Never married: 23.9%
Now married: 56.3%
Separated: 1.9%
Widowed: 5.3%
Divorced: 12.6%
Zip code 62561 compared to state average:
Median house value below state average.
Unemployed percentage below state average.
Black race population percentage significantly below state average.
Hispanic race population percentage significantly below state average.
Median age significantly above state average.
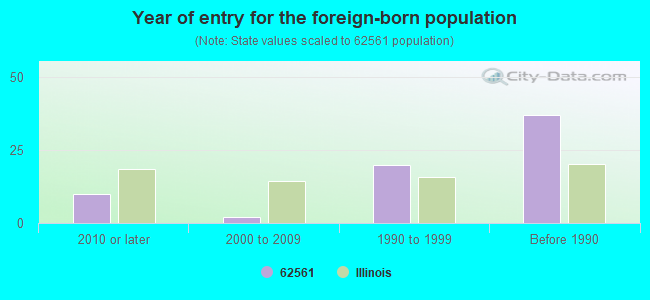
Foreign-born population percentage significantly below state average.
Length of stay since moving in significantly above state average.
Percentage of population with a bachelor's degree or higher below state average.
Estimated median house/condo value in 2022: $154,264
62561:
$154,264
Illinois:
$251,600
According to our research of Illinois and other state lists, there were 5 registered sex offenders living in 62561 zip code as of May 28, 2024. The ratio of all residents to sex offenders in zip code 62561 is 1,052 to 1. The ratio of registered sex offenders to all residents in this zip code is lower than the state average.
Median resident age:
This zip code:
50.6 years
Illinois median age:
39.1 years
Average household size:
This zip code:
2.1 people
Illinois:
2.4 people
Averages for the 2020 tax year for zip code 62561, filed in 2021:
Average Adjusted Gross Income (AGI) in 2020: $58,843 (Individual Income Tax Returns)
Here:
$58,843
State:
$82,626
Salary/wage: $47,817 (reported on 82.0% of returns)
Here:
$47,817
State:
$66,640
(% of AGI for various income ranges: 1151.3% for AGIs below $25k, 3184.2% for AGIs $25k-50k, 5468.7% for AGIs $50k-75k, 8616.4% for AGIs $75k-100k, 14301.2% for AGIs $100k-200k)
Taxable interest for individuals: $816 (reported on 36.5% of returns)
This zip code:
$816
Illinois:
$2,376
(% of AGI for various income ranges: 5.8% for AGIs below $25k, 14.5% for AGIs $25k-50k, 28.4% for AGIs $50k-75k, 58.2% for AGIs $75k-100k, 145.6% for AGIs $100k-200k)
Ordinary dividends: $3,026 (reported on 16.5% of returns)
Here:
$3,026
State:
$9,061
(% of AGI for various income ranges: 14.0% for AGIs below $25k, 35.7% for AGIs $25k-50k, 39.4% for AGIs $50k-75k, 79.5% for AGIs $75k-100k, 224.4% for AGIs $100k-200k)
Net capital gain/loss in AGI: +$5,180 (reported on 13.7% of returns)
Here:
+$5,180
State:
+$31,684
(% of AGI for various income ranges: 1.8% for AGIs below $25k, 20.0% for AGIs $25k-50k, 40.3% for AGIs $50k-75k, 65.5% for AGIs $75k-100k, 570.8% for AGIs $100k-200k)
Profit/loss from business: +$6,911 (reported on 11.0% of returns)
Here:
+$6,911
State:
+$12,175
(% of AGI for various income ranges: 71.9% for AGIs below $25k, 72.3% for AGIs $25k-50k, 168.4% for AGIs $50k-75k, 100.0% for AGIs $75k-100k, 145.6% for AGIs $100k-200k)
Taxable individual retirement arrangement distribution: $14,595 (reported on 8.6% of returns)
62561:
$14,595
Illinois:
$21,613
(% of AGI for various income ranges: 36.8% for AGIs below $25k, 66.4% for AGIs $25k-50k, 136.8% for AGIs $50k-75k, 315.5% for AGIs $75k-100k, 605.2% for AGIs $100k-200k)
Total itemized deductions: $31,533 (reported on 2.4% of returns)
Here:
$31,533
State:
$34,948
(% of AGI for various income ranges: 261.6% for AGIs $50k-75k, 432.4% for AGIs $100k-200k)
Charity contributions: $13,000 (reported on 1.2% of returns)
Here:
$13,000
State:
$13,122
(% of AGI for various income ranges: 156.0% for AGIs $100k-200k)
Taxes paid: $6,929 (reported on 2.7% of returns)
62561:
$6,929
State:
$8,563
(% of AGI for various income ranges: 61.3% for AGIs $50k-75k, 118.0% for AGIs $100k-200k)
Earned income credit: $2,361 (reported on 16.1% of returns)
Here:
$2,361
State:
$2,311
(% of AGI for various income ranges: 89.4% for AGIs below $25k, 78.1% for AGIs $25k-50k)
Percentage of individuals using paid preparers for their 2020 taxes: 94.1%
Here:
94%
State:
93%
(% for various income ranges: 93.5% for AGIs below $25k, 96.8% for AGIs $25k-50k, 95.0% for AGIs $50k-75k, 93.5% for AGIs $75k-100k, 92.7% for AGIs $100k-200k, 75.0% for AGIs over 200k)
Averages for the 2012 tax year for zip code 62561, filed in 2013:
Average Adjusted Gross Income (AGI) in 2012: $51,700 (Individual Income Tax Returns)
Here:
$51,700
State:
$68,058
Salary/wage: $43,229 (reported on 85.4% of returns)
Here:
$43,229
State:
$55,396
(% of AGI for various income ranges: 75.7% for AGIs below $25k, 80.6% for AGIs $25k-50k, 73.8% for AGIs $50k-75k, 70.3% for AGIs $75k-100k, 81.9% for AGIs $100k-200k)
Taxable interest for individuals: $711 (reported on 35.0% of returns)
This zip code:
$711
Illinois:
$1,969
(% of AGI for various income ranges: 0.7% for AGIs below $25k, 0.5% for AGIs $25k-50k, 0.6% for AGIs $50k-75k, 0.5% for AGIs $75k-100k, 0.4% for AGIs $100k-200k)
Ordinary dividends: $1,988 (reported on 16.5% of returns)
Here:
$1,988
State:
$7,786
(% of AGI for various income ranges: 0.8% for AGIs below $25k, 0.3% for AGIs $25k-50k, 0.7% for AGIs $50k-75k, 0.9% for AGIs $75k-100k, 0.7% for AGIs $100k-200k)
Net capital gain/loss in AGI: +$1,603 (reported on 11.2% of returns)
Here:
+$1,603
State:
+$22,183
(% of AGI for various income ranges: 0.3% for AGIs $75k-100k, 1.1% for AGIs $100k-200k)
Profit/loss from business: +$8,816 (reported on 11.9% of returns)
Here:
+$8,816
State:
+$12,903
(% of AGI for various income ranges: 5.7% for AGIs below $25k, 2.0% for AGIs $25k-50k, 2.7% for AGIs $50k-75k, 0.9% for AGIs $75k-100k, 1.7% for AGIs $100k-200k)
Taxable individual retirement arrangement distribution: $12,100 (reported on 7.7% of returns)
62561:
$12,100
Illinois:
$17,929
(% of AGI for various income ranges: 2.2% for AGIs below $25k, 1.6% for AGIs $25k-50k, 1.4% for AGIs $50k-75k, 2.0% for AGIs $75k-100k, 2.5% for AGIs $100k-200k)
Total itemized deductions: $16,997 (18% of AGI, reported on 23.5% of returns)
Here:
$16,997
State:
$26,433
Here:
17.6% of AGI
State:
19.2% of AGI
(% of AGI for various income ranges: 3.6% for AGIs below $25k, 6.3% for AGIs $25k-50k, 6.8% for AGIs $50k-75k, 8.3% for AGIs $75k-100k, 11.9% for AGIs $100k-200k)
Charity contributions: $2,555 (reported on 16.2% of returns)
Here:
$2,555
State:
$4,525
(% of AGI for various income ranges: 0.4% for AGIs $25k-50k, 0.7% for AGIs $50k-75k, 0.9% for AGIs $75k-100k, 1.4% for AGIs $100k-200k)
Taxes paid: $7,064 (reported on 23.5% of returns)
62561:
$7,064
State:
$11,968
(% of AGI for various income ranges: 0.6% for AGIs below $25k, 1.9% for AGIs $25k-50k, 2.7% for AGIs $50k-75k, 3.1% for AGIs $75k-100k, 5.1% for AGIs $100k-200k, 3.7% for AGIs over 200k)
Earned income credit: $2,302 (reported on 16.5% of returns)
Here:
$2,302
State:
$2,349
(% of AGI for various income ranges: 6.6% for AGIs below $25k, 1.0% for AGIs $25k-50k)
Percentage of individuals using paid preparers for their 2012 taxes: 48.8%
Here:
49%
State:
57%
(% for various income ranges: 42.1% for AGIs below $25k, 49.2% for AGIs $25k-50k, 48.8% for AGIs $50k-75k, 56.7% for AGIs $75k-100k, 64.5% for AGIs $100k-200k)
Averages for the 2004 tax year for zip code 62561, filed in 2005:
Average Adjusted Gross Income (AGI) in 2004: $41,645 (Individual Income Tax Returns)
Here:
$41,645
State:
$54,625
Salary/wage: $37,016 (reported on 87.9% of returns)
Here:
$37,016
State:
$46,811
(% of AGI for various income ranges: 93.7% for AGIs below $10k, 80.0% for AGIs $10k-25k, 79.2% for AGIs $25k-50k, 80.9% for AGIs $50k-75k, 83.2% for AGIs $75k-100k, 65.0% for AGIs over 100k)
Taxable interest for individuals: $1,050 (reported on 45.0% of returns)
This zip code:
$1,050
Illinois:
$2,101
(% of AGI for various income ranges: 3.6% for AGIs below $10k, 1.4% for AGIs $10k-25k, 1.3% for AGIs $25k-50k, 1.0% for AGIs $50k-75k, 0.7% for AGIs $75k-100k, 1.2% for AGIs over 100k)
Taxable dividends: $1,051 (reported on 21.0% of returns)
Here:
$1,051
State:
$4,306
(% of AGI for various income ranges: 0.7% for AGIs below $10k, 0.8% for AGIs $10k-25k, 0.5% for AGIs $25k-50k, 0.3% for AGIs $50k-75k, 0.7% for AGIs $75k-100k, 0.6% for AGIs over 100k)
Net capital gain/loss: +$2,359 (reported on 15.0% of returns)
Here:
+$2,359
State:
+$17,321
(% of AGI for various income ranges: 1.2% for AGIs below $10k, -0.0% for AGIs $10k-25k, 0.6% for AGIs $25k-50k, 0.9% for AGIs $50k-75k, 0.3% for AGIs $75k-100k, 2.1% for AGIs over 100k)
Profit/loss from business: +$6,198 (reported on 12.0% of returns)
Here:
+$6,198
State:
+$11,771
(% of AGI for various income ranges: -1.5% for AGIs below $10k, 3.8% for AGIs $10k-25k, 1.8% for AGIs $25k-50k, 2.1% for AGIs $50k-75k, 0.2% for AGIs $75k-100k, 2.3% for AGIs over 100k)
Profit/loss from farming: +$3,091 (reported on 1.3% of returns)
Here:
+$3,091
State:
+$2,327
IRA payment deduction: $2,895 (reported on 2.3% of returns)
62561:
$2,895
Illinois:
$3,087
Self-employed pension: $6,700 (reported on 0.4% of returns)
Here:
$6,700
Illinois:
$16,965
Total itemized deductions: $14,102 (20% of AGI, reported on 25.6% of returns)
Here:
$14,102
State:
$20,239
Here:
20.0% of AGI
State:
19.5% of AGI
(% of AGI for various income ranges: 8.3% for AGIs below $10k, 6.8% for AGIs $10k-25k, 7.5% for AGIs $25k-50k, 8.6% for AGIs $50k-75k, 10.3% for AGIs $75k-100k, 9.4% for AGIs over 100k)
Charity contributions deductions: $2,025 (3% of AGI, reported on 20.6% of returns)
Here:
$2,025
State:
$3,719
Here:
2.7% of AGI
State:
3.4% of AGI
(% of AGI for various income ranges: 0.5% for AGIs $10k-25k, 0.7% for AGIs $25k-50k, 1.0% for AGIs $50k-75k, 1.1% for AGIs $75k-100k, 1.7% for AGIs over 100k)
Total tax: $5,254 (reported on 77.4% of returns)
62561:
$5,254
State:
$9,882
(% of AGI for various income ranges: 2.0% for AGIs below $10k, 4.5% for AGIs $10k-25k, 7.1% for AGIs $25k-50k, 8.5% for AGIs $50k-75k, 10.7% for AGIs $75k-100k, 17.2% for AGIs over 100k)
Earned income credit: $1,693 (reported on 14.1% of returns)
Here:
$1,693
State:
$1,788
Percentage of individuals using paid preparers for their 2004 taxes: 53.0%
Here:
53%
State:
61%
(% for various income ranges: 39.2% for AGIs below $10k, 53.2% for AGIs $10k-25k, 55.9% for AGIs $25k-50k, 58.4% for AGIs $50k-75k, 54.4% for AGIs $75k-100k, 63.8% for AGIs over 100k)
Household received Food Stamps/SNAP in the past 12 months: 138 Household did not receive Food Stamps/SNAP in the past 12 months: 2,182
Women who had a birth in the past 12 months: 72 (22 now married, 50 unmarried) Women who did not have a birth in the past 12 months: 808 (462 now married, 341 unmarried)
Housing units in zip code 62561 with a mortgage: 984 (66 second mortgage, 64 both second mortgage and home equity loan) Houses without a mortgage: 37
Median monthly owner costs for units with a mortgage: $1,399 Median monthly owner costs for units without a mortgage: $502
Residents with income below the poverty level in 2022:
This zip code:
8.3%
Whole state:
11.9%
Residents with income below 50% of the poverty level in 2022:
This zip code:
6.9%
Whole state:
5.7%
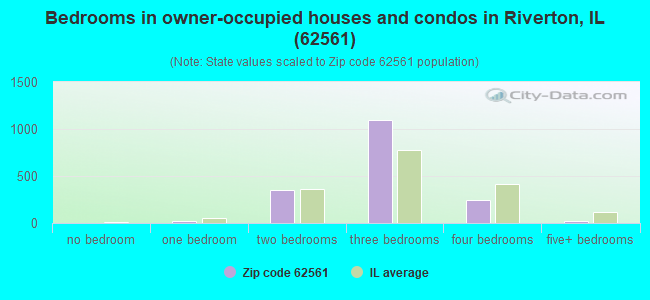
Median number of rooms in houses and condos:
Here:
5.8
State:
6.4
Median number of rooms in apartments:
Here:
4.4
State:
4.1
Notable locations in this zip code not listed on our city pages
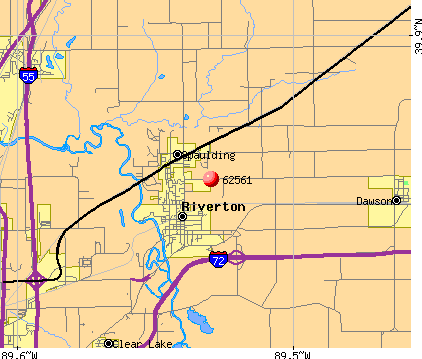
Notable locations in zip code 62561: Riverton Fire Protection District Station 2 (A), Riverton Fire Protection District (B). Display/hide their locations on the map
Cemeteries: Wolf Creek Cemetery (1), Ladysmith Cemetery (2), Mallory Cemetery (3), Taylor Cemetery (4), Bice Cemetery (5). Display/hide their locations on the map
Size of family households: 882 2-persons, 224 3-persons, 253 4-persons, 119 5-persons, 11 6-persons
Size of nonfamily households: 727 1-person, 127 2-persons, 3 3-persons
546 married couples with children.
384 single-parent households (314 men, 70 women).
98.3% of residents of 62561 zip code speak English at home.
0.1% of residents speak Spanish at home (67% very well, 33% well).
0.6% of residents speak other Indo-European language at home (90% very well, 10% well).
0.6% of residents speak Asian or Pacific Island language at home (100% very well).
Foreign born population: 68 (1.4%) (73.7% of them are naturalized citizens)
This zip code:
1.4%
Whole state:
14.4%
29%Greece
29%Malaysia
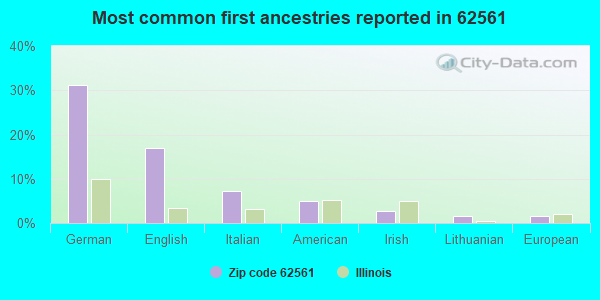
31%German
17%English
7%Italian
5%American
3%Irish
2%Lithuanian
2%European
Year of entry for the foreign-born population
102010 or later
22000 to 2009
201990 to 1999
37Before 1990
Major facilities with environmental interests located in this zip code:
LINCOLN LAND FS INC (8507 OLD DECATUR RD. in RIVERTON, IL)
STATE MASTER (Illinois EPA Project) - AIR PROGRAM AIR MINOR (AIRS/AFS) ENFORCEMENT/COMPLIANCE ACTIVITY (Integrated Compliance Information System) CRITERIA AND HAZARDOUS AIR POLLUTANT INVENTORY (Inventory of air pollution sources) Business SIC classification: FARM SUPPLIES Alternative names: LINCOLN LAND FS INCORPORATED RIVERTON NH 3
CONWAY CENTRAL EXPRESS (7220 CCX ROAD in RIVERTON, IL)
STATE MASTER (Illinois EPA Project) - SOLID WASTE PROGRAM National Pollutant Discharge Elimination System NON-MAJOR (Tracking pollutant discharge elimination systems) - permit Organizations: CONSOLIDATED FREIGHTWAYS (CONTACT/OWNER)
Alternative names: CON-WAY CENTRAL EXPRESS-XSF
LONG ELEVATOR (100 WASHINGTON in RIVERTON, IL)
STATE MASTER (Illinois EPA Project) - HAZARDOUS WASTE PROGRAM, SOLID WASTE PROGRAM Conditionally Exempt Small Quantity Generators, less than 100 kg/month of hazardous waste (Resource Conservation and Recovery Act (tracking hazardous waste)) Organizations: WHL PROPERTIES INC (CONTACT/OWNER)
JC PETITT (RR 1 6737 OLD RTE 36 in RIVERTON, IL)
STATE MASTER (Illinois EPA Project) - SOLID WASTE PROGRAM Conditionally Exempt Small Quantity Generators, less than 100 kg/month of hazardous waste (Resource Conservation and Recovery Act (tracking hazardous waste)) - notification Organizations: PRTITT JAMES C (CONTACT/OWNER)
Alternative names: J C PETITT EXCAVATING
RIVERTON HIGH SCHOOL (PO BOX 560 in RIVERTON, IL)
(Geographic Names Information System) (National Center for Education Statistics) - STATE ID-5108401400001 Organizations: RIVERTON C U SCHOOL DIST 14 (SCHOOL DISTRICT)
RIVERTON ELEM SCHOOL (PO BOX 470 in RIVERTON, IL)
(National Center for Education Statistics) - STATE ID-5108401402003 Organizations: RIVERTON C U SCHOOL DIST 14 (SCHOOL DISTRICT)
RIVERTON MIDDLE SCHOOL (P O BOX 530 in RIVERTON, IL)
(National Center for Education Statistics) - STATE ID-5108401401001 Organizations: RIVERTON C U SCHOOL DIST 14 (SCHOOL DISTRICT)
RIVERTON STP (225 WEST JEFFERSON in RIVERTON, IL)
National Pollutant Discharge Elimination System NON-MAJOR (Tracking pollutant discharge elimination systems) - permit National Pollutant Discharge Elimination System NON-MAJOR (Tracking pollutant discharge elimination systems) - permit Business SIC classification: SEWERAGE SYSTEMS Alternative names: RIVERTON STP, VILLAGE OF, RIVERTON, VILLAGE OF
MAX TRUCKING (1/2 MI. N OF DAWSON ON BUFFALO in RIVERTON, IL)
National Pollutant Discharge Elimination System NON-MAJOR (Tracking pollutant discharge elimination systems) - permit
CROWE?EVERETT LOREN (EAST TO 7.5 N. TO 8. E. in RIVERTON, IL)
National Pollutant Discharge Elimination System NON-MAJOR (Tracking pollutant discharge elimination systems) - permit Alternative names: CROWE, EVERETT LOREN
IL BRG 084-0154 (FAI 72 & TR 42D in RIVERTON, IL)
Small Quantity Generators, between 100 kg and 1000 kg of hazardous waste/month (Resource Conservation and Recovery Act (tracking hazardous waste)) - notification Organizations: IDOT (CONTACT/OWNER)
IL BRG RIVERTON (FAI 72 BETWEEN RIVERTON AND in RIVERTON, IL)
Small Quantity Generators, between 100 kg and 1000 kg of hazardous waste/month (Resource Conservation and Recovery Act (tracking hazardous waste)) - notification Organizations: IL DEPT OF TRANSPORTATION (CONTACT/OWNER)
ILDOT BRG 084 0052 (FAS631 OLD US36 OVER THE SANGA in RIVERTON, IL)
Small Quantity Generators, between 100 kg and 1000 kg of hazardous waste/month (Resource Conservation and Recovery Act (tracking hazardous waste)) - notification
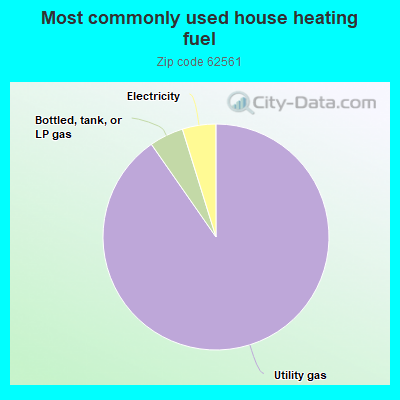
90.4%Utility gas
4.9%Bottled, tank, or LP gas
4.8%Electricity
Population in 1990: 3,921. Population change in the 1990s: +829 (+21.1%).
Place of birth for U.S.-born residents:
This state: 4,443
Northeast: 89
Midwest: 345
South: 49
West: 15
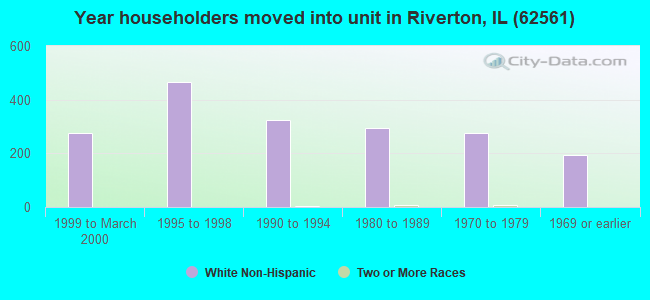
62% of the 62561 zip code residents lived in the same house 5 years ago. Out of people who lived in different houses, 82% lived in this county. Out of people who lived in different counties, 50% lived in Illinois.
92% of the 62561 zip code residents lived in the same house 1 year ago. Out of people who lived in different houses, 76% moved from this county. Out of people who lived in different houses, 13% moved from different county within same state. Out of people who lived in different houses, 7% moved from different state.
Private vs. public school enrollment:
Students in private schools in grades 1 to 8 (elementary and middle school):
Here:
0.0%
Illinois:
13.3%
Students in private schools in grades 9 to 12 (high school): 14
Here:
3.7%
Illinois:
9.9%
Students in private undergraduate colleges: 12
Here:
5.6%
Illinois:
27.4%
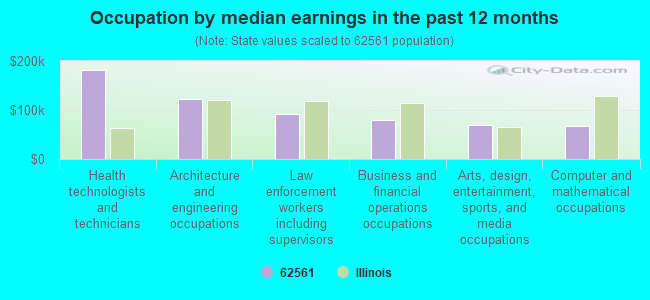
Occupation by median earnings in the past 12 months ($)
180,824Health technologists and technicians
121,753Architecture and engineering occupations
91,362Law enforcement workers including supervisors
80,554Business and financial operations occupations
70,329Arts, design, entertainment, sports, and media occupations
66,827Computer and mathematical occupations
Companies with federal contracts located in this zip code:
LONG ELEVATOR & MACHINE CO INC (1ST & WASHINGTON ST in RIVERTON, IL) : $104,679 in 8 contractsfrom 2004 to 2006
Contracts for Maintenance, Repair and Rebuilding of Equipment -- Service and Trade Equipment, Maintenance, Repair and Rebuilding of Equipment -- Miscellaneous, Installation of Equipment -- Miscellaneous, Maintenance, Repair and Rebuilding of Equipment -- Materials Handling Equipment by Air Force, National Park Service Signed by year:2000: $0; 2001: $0; 2002: $0; 2003: $0; 2004: $43,836; 2005: $62,443; 2006: -$1,600.
Biggest contracts:
$44,892 with Air Force for Maintenance, Repair and Rebuilding of Equipment -- Service and Trade Equipment. Signed on 2005-10-01. Completion date: 2006-09-30.
$42,120 with Air Force for Maintenance, Repair and Rebuilding of Equipment -- Miscellaneous. Signed on 2004-10-01. Completion date: 2005-09-30.
$10,184 with Air Force for Installation of Equipment -- Miscellaneous. Signed on 2005-09-15. Completion date: 2005-09-30.
$5,531 with Air Force for Maintenance, Repair and Rebuilding of Equipment -- Service and Trade Equipment. Signed on 2005-08-22. Completion date: 2005-08-27.
Top industries in this zip code by the number of employees in 2005:
Information: Radio Stations (50-99 employees: 1 establishment)
Construction: Other Building Equipment Contractors (50-99: 1)
Accommodation and Food Services: Food Service Contractors (20-49: 1, 10-19: 1, 5-9: 1)
Other Services (except Public Administration): Industrial Launderers (20-49: 1)
Administrative and Support and Waste Management and Remediation Services: Janitorial Services (10-19: 1, 1-4: 2)
Health Care and Social Assistance: Child Day Care Services (10-19: 1, 1-4: 2)
Fatal accident statistics in 2014:
Fatal accident count: 1
Vehicles involved in fatal accidents: 2
Fatal accidents caused by drunken drivers: 0
Fatalities: 1
Persons involved in fatal accidents: 3
Pedestrians involved in fatal accidents: 0
Fatal accident statistics in 2013:
Fatal accident count: 1
Vehicles involved in fatal accidents: 2
Fatal accidents caused by drunken drivers: 0
Fatalities: 1
Persons involved in fatal accidents: 2
Pedestrians involved in fatal accidents: 0
Home Mortgage Disclosure Act Aggregated Statistics For Year 2009 (Based on 2 partial tracts)
A) FHA, FSA/RHS & VA Home Purchase Loans
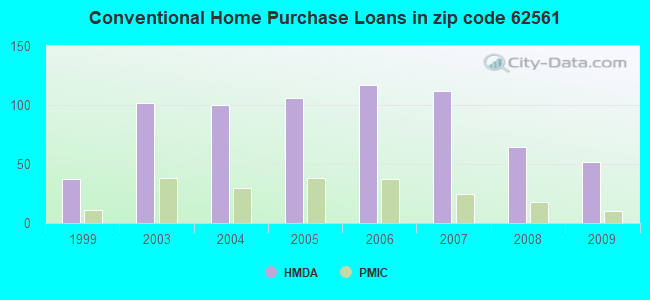
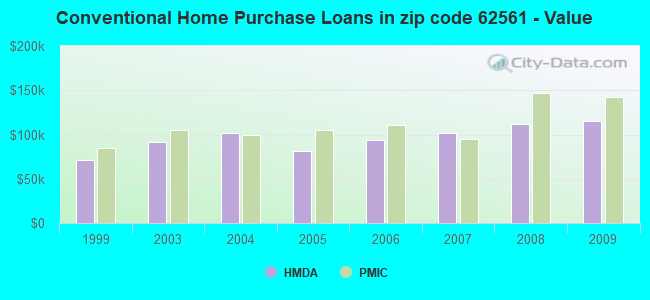
B) Conventional Home Purchase Loans
C) Refinancings
D) Home Improvement Loans
E) Loans on Dwellings For 5+ Families
F) Non-occupant Loans on < 5 Family Dwellings (A B C & D)
G) Loans On Manufactured Home Dwelling (A B C & D)
Number
Average Value
Number
Average Value
Number
Average Value
Number
Average Value
Number
Average Value
Number
Average Value
Number
Average Value
LOANS ORIGINATED
42
$120,022
52
$115,812
395
$108,577
44
$35,575
1
$223,410
20
$100,464
6
$63,630
APPLICATIONS APPROVED, NOT ACCEPTED
1
$132,920
1
$113,120
42
$116,184
1
$19,800
0
$0
1
$65,040
1
$130,090
APPLICATIONS DENIED
6
$82,483
6
$116,183
55
$130,679
17
$35,599
0
$0
0
$0
3
$48,547
APPLICATIONS WITHDRAWN
10
$85,688
1
$84,840
47
$111,255
7
$88,274
0
$0
0
$0
0
$0
FILES CLOSED FOR INCOMPLETENESS
1
$238,970
0
$0
3
$114,533
0
$0
0
$0
0
$0
0
$0
Aggregated Statistics For Year 2008 (Based on 2 partial tracts)
A) FHA, FSA/RHS & VA Home Purchase Loans
B) Conventional Home Purchase Loans
C) Refinancings
D) Home Improvement Loans
E) Loans on Dwellings For 5+ Families
F) Non-occupant Loans on < 5 Family Dwellings (A B C & D)
G) Loans On Manufactured Home Dwelling (A B C & D)
Number
Average Value
Number
Average Value
Number
Average Value
Number
Average Value
Number
Average Value
Number
Average Value
Number
Average Value
LOANS ORIGINATED
30
$120,049
64
$112,082
151
$102,557
37
$39,936
1
$190,890
27
$64,625
3
$39,593
APPLICATIONS APPROVED, NOT ACCEPTED
0
$0
7
$76,961
25
$129,409
4
$70,700
0
$0
0
$0
3
$45,720
APPLICATIONS DENIED
0
$0
7
$95,546
81
$115,040
21
$67,400
0
$0
4
$23,330
4
$34,642
APPLICATIONS WITHDRAWN
3
$101,337
3
$63,630
35
$107,747
3
$58,917
0
$0
0
$0
0
$0
FILES CLOSED FOR INCOMPLETENESS
0
$0
1
$141,400
10
$123,584
1
$63,630
0
$0
0
$0
0
$0
Aggregated Statistics For Year 2007 (Based on 2 partial tracts)
A) FHA, FSA/RHS & VA Home Purchase Loans
B) Conventional Home Purchase Loans
C) Refinancings
D) Home Improvement Loans
E) Loans on Dwellings For 5+ Families
F) Non-occupant Loans on < 5 Family Dwellings (A B C & D)
G) Loans On Manufactured Home Dwelling (A B C & D)
Number
Average Value
Number
Average Value
Number
Average Value
Number
Average Value
Number
Average Value
Number
Average Value
Number
Average Value
LOANS ORIGINATED
10
$114,817
112
$101,922
148
$100,270
47
$31,559
1
$1,197,660
24
$80,716
4
$56,208
APPLICATIONS APPROVED, NOT ACCEPTED
0
$0
11
$91,395
14
$86,860
4
$31,462
0
$0
0
$0
1
$91,910
APPLICATIONS DENIED
1
$107,460
11
$83,683
52
$93,813
28
$56,560
0
$0
1
$63,630
7
$77,770
APPLICATIONS WITHDRAWN
0
$0
10
$74,094
25
$96,718
7
$50,904
0
$0
1
$35,350
3
$35,350
FILES CLOSED FOR INCOMPLETENESS
0
$0
0
$0
6
$94,973
0
$0
0
$0
1
$148,470
0
$0
Aggregated Statistics For Year 2006 (Based on 2 partial tracts)
A) FHA, FSA/RHS & VA Home Purchase Loans
B) Conventional Home Purchase Loans
C) Refinancings
D) Home Improvement Loans
E) Loans on Dwellings For 5+ Families
F) Non-occupant Loans on < 5 Family Dwellings (A B C & D)
G) Loans On Manufactured Home Dwelling (A B C & D)
Number
Average Value
Number
Average Value
Number
Average Value
Number
Average Value
Number
Average Value
Number
Average Value
Number
Average Value
LOANS ORIGINATED
10
$104,070
117
$94,110
133
$88,901
37
$22,624
4
$243,562
21
$62,418
8
$48,252
APPLICATIONS APPROVED, NOT ACCEPTED
1
$192,300
10
$95,304
16
$58,769
4
$41,005
0
$0
3
$48,077
6
$36,057
APPLICATIONS DENIED
3
$121,603
10
$70,276
83
$98,145
11
$82,141
0
$0
3
$38,177
11
$59,902
APPLICATIONS WITHDRAWN
0
$0
10
$134,471
69
$116,337
6
$32,758
0
$0
0
$0
0
$0
FILES CLOSED FOR INCOMPLETENESS
0
$0
1
$251,690
11
$117,234
0
$0
0
$0
0
$0
1
$73,530
Aggregated Statistics For Year 2005 (Based on 2 partial tracts)
A) FHA, FSA/RHS & VA Home Purchase Loans
B) Conventional Home Purchase Loans
C) Refinancings
D) Home Improvement Loans
E) Loans on Dwellings For 5+ Families
F) Non-occupant Loans on < 5 Family Dwellings (A B C & D)
G) Loans On Manufactured Home Dwelling (A B C & D)
Number
Average Value
Number
Average Value
Number
Average Value
Number
Average Value
Number
Average Value
Number
Average Value
Number
Average Value
LOANS ORIGINATED
8
$138,572
106
$81,105
170
$95,520
33
$24,381
1
$586,810
33
$101,679
8
$25,805
APPLICATIONS APPROVED, NOT ACCEPTED
1
$87,670
13
$90,931
23
$105,067
3
$17,910
0
$0
4
$61,155
1
$62,220
APPLICATIONS DENIED
1
$142,810
21
$57,772
78
$103,965
14
$24,341
0
$0
6
$56,560
8
$16,438
APPLICATIONS WITHDRAWN
0
$0
16
$77,858
66
$105,772
4
$113,828
0
$0
0
$0
0
$0
FILES CLOSED FOR INCOMPLETENESS
0
$0
4
$46,308
8
$124,079
1
$90,500
0
$0
0
$0
0
$0
Aggregated Statistics For Year 2004 (Based on 2 partial tracts)
A) FHA, FSA/RHS & VA Home Purchase Loans
B) Conventional Home Purchase Loans
C) Refinancings
D) Home Improvement Loans
E) Loans on Dwellings For 5+ Families
F) Non-occupant Loans on < 5 Family Dwellings (A B C & D)
G) Loans On Manufactured Home Dwelling (A B C & D)
Number
Average Value
Number
Average Value
Number
Average Value
Number
Average Value
Number
Average Value
Number
Average Value
Number
Average Value
LOANS ORIGINATED
16
$108,436
100
$101,327
221
$91,309
31
$27,048
3
$227,653
16
$94,649
6
$49,725
APPLICATIONS APPROVED, NOT ACCEPTED
0
$0
11
$88,439
30
$120,426
4
$25,452
0
$0
3
$113,120
1
$69,290
APPLICATIONS DENIED
3
$75,413
21
$59,320
64
$98,604
24
$40,594
0
$0
4
$41,360
7
$35,754
APPLICATIONS WITHDRAWN
0
$0
14
$88,476
54
$102,332
1
$89,080
0
$0
1
$155,540
1
$97,570
FILES CLOSED FOR INCOMPLETENESS
0
$0
0
$0
3
$114,533
1
$35,350
0
$0
0
$0
0
$0
Aggregated Statistics For Year 2003 (Based on 2 partial tracts)
A) FHA, FSA/RHS & VA Home Purchase Loans
B) Conventional Home Purchase Loans
C) Refinancings
D) Home Improvement Loans
E) Loans on Dwellings For 5+ Families
F) Non-occupant Loans on < 5 Family Dwellings (A B C & D)
Number
Average Value
Number
Average Value
Number
Average Value
Number
Average Value
Number
Average Value
Number
Average Value
LOANS ORIGINATED
20
$101,950
102
$91,577
580
$87,541
38
$19,610
0
$0
28
$61,812
APPLICATIONS APPROVED, NOT ACCEPTED
1
$142,810
6
$57,267
42
$79,016
0
$0
0
$0
0
$0
APPLICATIONS DENIED
3
$114,533
30
$53,261
92
$78,800
11
$10,412
1
$135,740
6
$42,892
APPLICATIONS WITHDRAWN
1
$108,880
14
$108,070
61
$102,434
3
$34,407
0
$0
0
$0
FILES CLOSED FOR INCOMPLETENESS
0
$0
1
$134,330
6
$86,018
0
$0
0
$0
0
$0
Aggregated Statistics For Year 1999 (Based on 1 partial tract)
A) FHA, FSA/RHS & VA Home Purchase Loans
B) Conventional Home Purchase Loans
C) Refinancings
D) Home Improvement Loans
F) Non-occupant Loans on < 5 Family Dwellings (A B C & D)
Detailed PMIC statistics for the following Tracts:0038.02
2002 - 2018 National Fire Incident Reporting System (NFIRS) incidents
Based on the data from the years 2002 - 2018 the average number of fires per year is 33. The highest number of fires - 63 took place in 2007, and the least - 1 in 2004. The data has a growing trend.
When looking into fire subcategories, the most reports belonged to: Structure Fires (42.2%), and Outside Fires (40.8%).
Fire incident types reported to NFIRS in Zip Code 62561


 Nearest zip codes: 62520, 62693, 62684, 62515, 62519, 62712.


 Based on the data from the years 2002 - 2018 the average number of fires per year is 33. The highest number of fires - 63 took place in 2007, and the least - 1 in 2004. The data has a growing trend.
 When looking into fire subcategories, the most reports belonged to: Structure Fires (42.2%), and Outside Fires (40.8%).